当前位置:网站首页>ArcGIS application foundation 4 thematic map making
ArcGIS application foundation 4 thematic map making
2022-07-06 05:36:00 【GISer Liu】

Article data As a free download
This experimental data is based on the last experiment 3 Result processing , See article ArcGIS Application basis 3 Production of population density map
One 、 Name of the experiment
ArcGIS Production of thematic map of application foundation
Two 、 The experiment purpose
0 Master the method of adding map elements
1 Master the method of map output
2 Understand the basic process of thematic map making
3、 ... and 、 Experiment preparation
1. Data preparation
0 arterials.shp: Street vector line feature data
1 airport_area.shp: Airport range vector surface feature data
2 tracts.shp: Street range vector face feature data
2. Software preparation
ArcGIS10.X
Four 、 The experimental steps
1. open ArcMap Software , newly build ArcMap Blank document , Import the above data into ArcMap Software ;
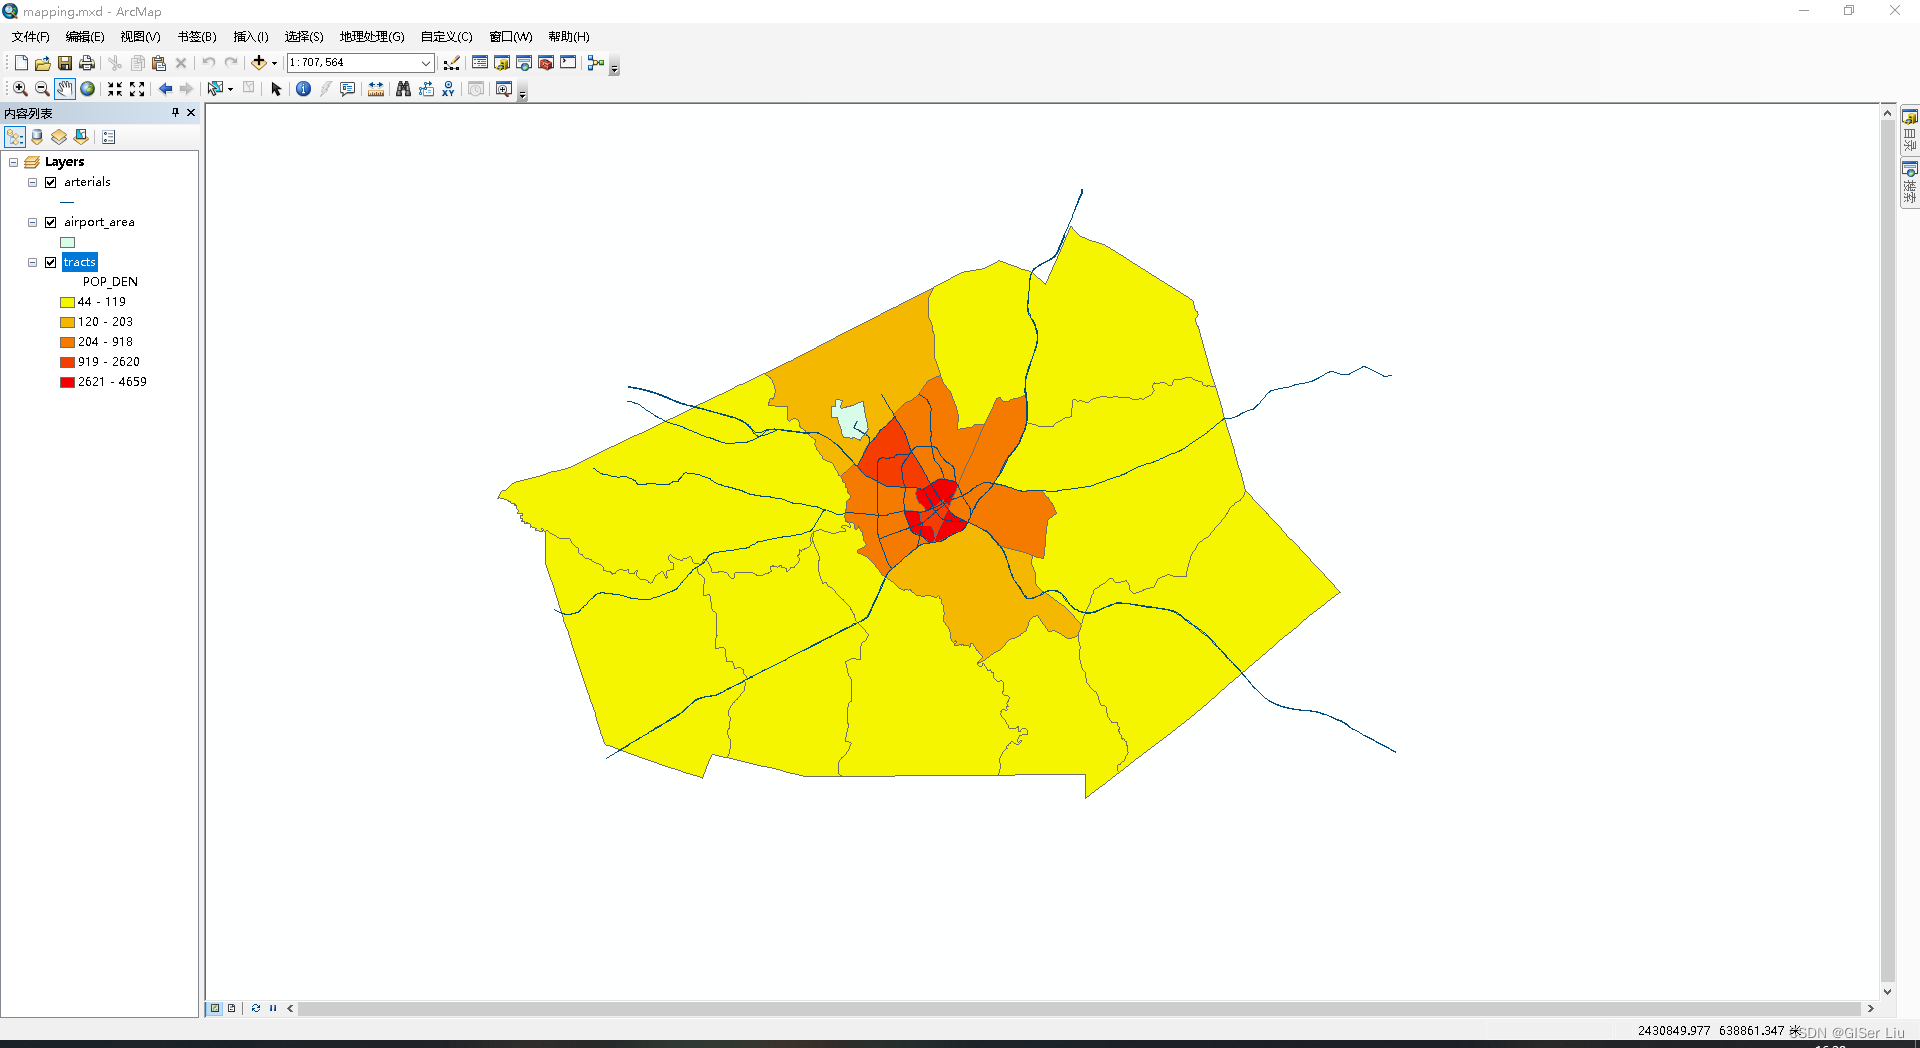
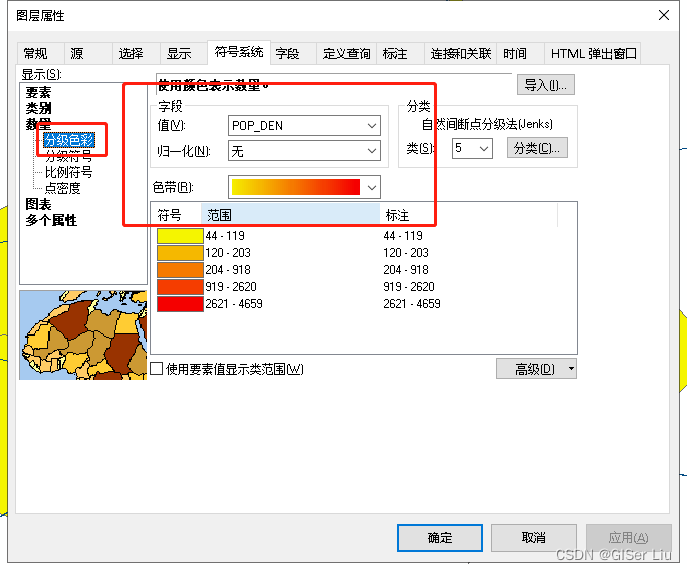
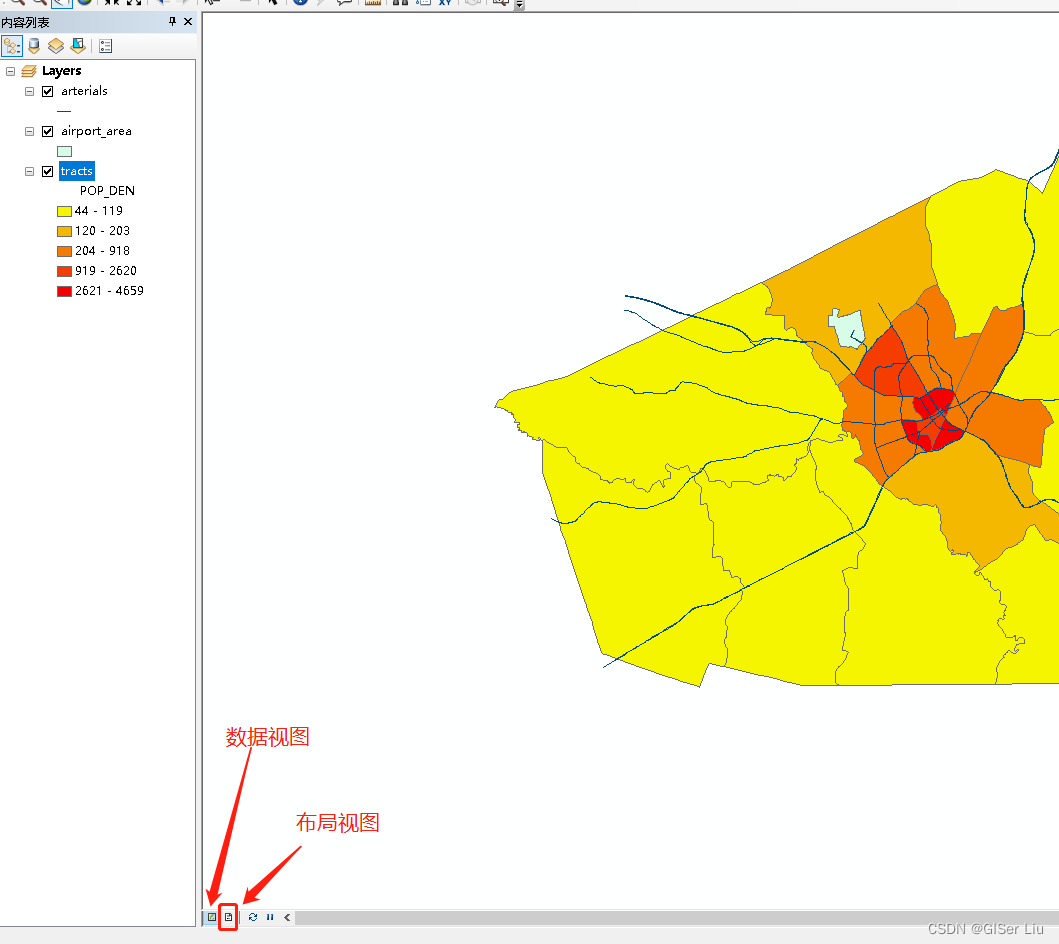
2. Yes tract.shp The data is symbolized by population density , choice tract.shp Right click on data to open properties > Symbol system > Category > Number , Select population density field , Choose the right Ribbon . Can be confirmed .
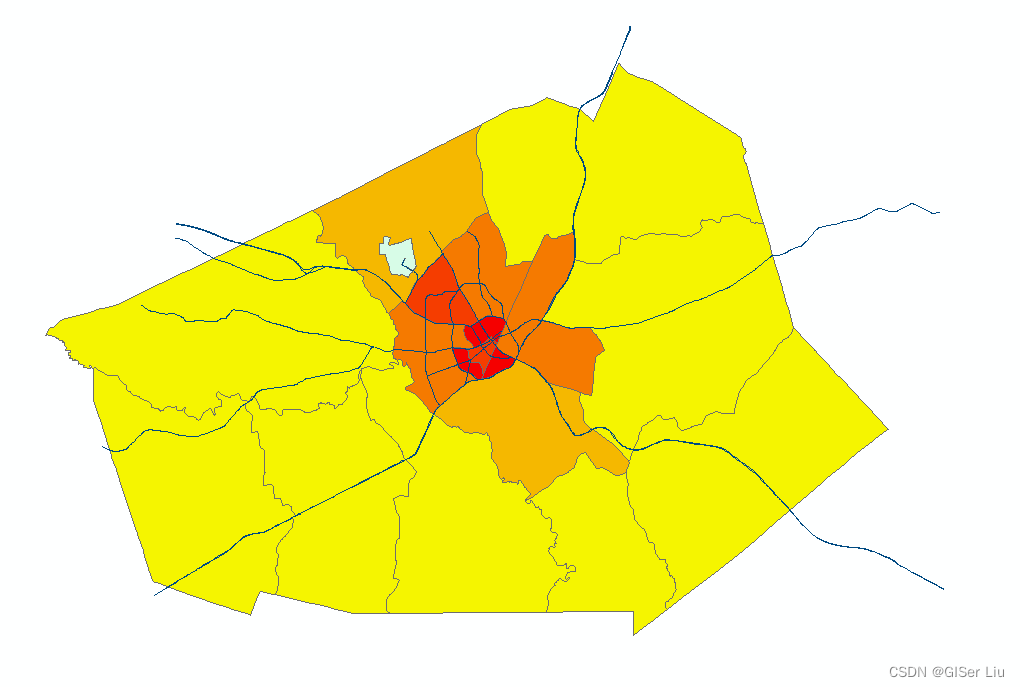
3. We make thematic mapping of the visualization results , Thematic mapping needs to be carried out in layout mode , Let's first switch the layout mode : Click layout mode in the lower left corner of the view window , Enter the layout view ;
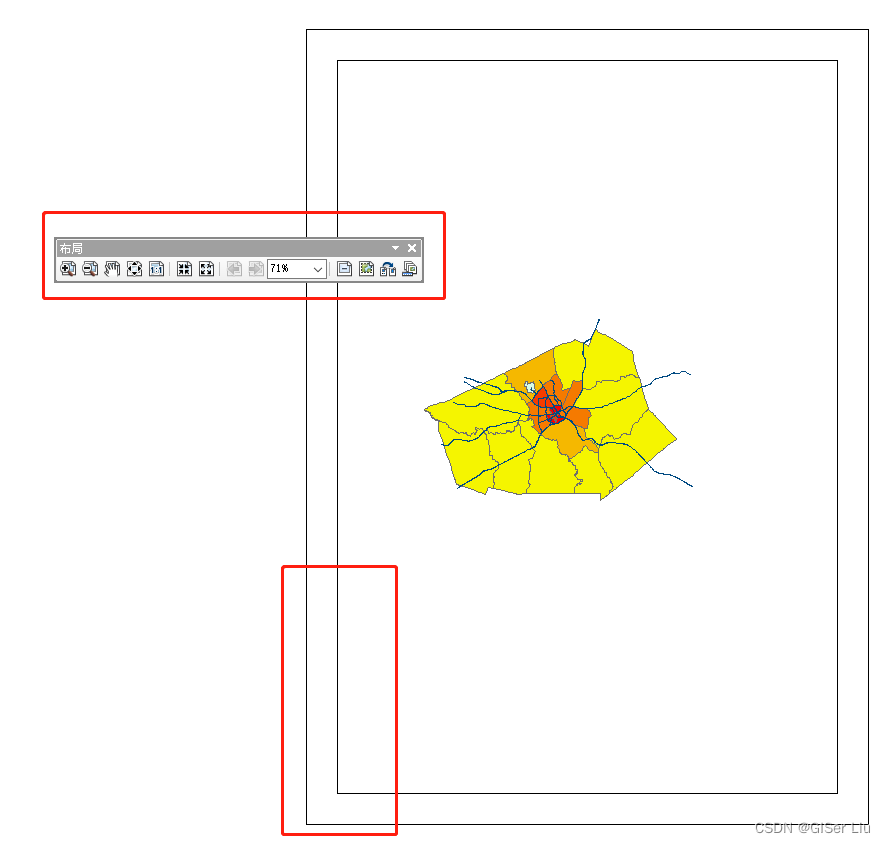
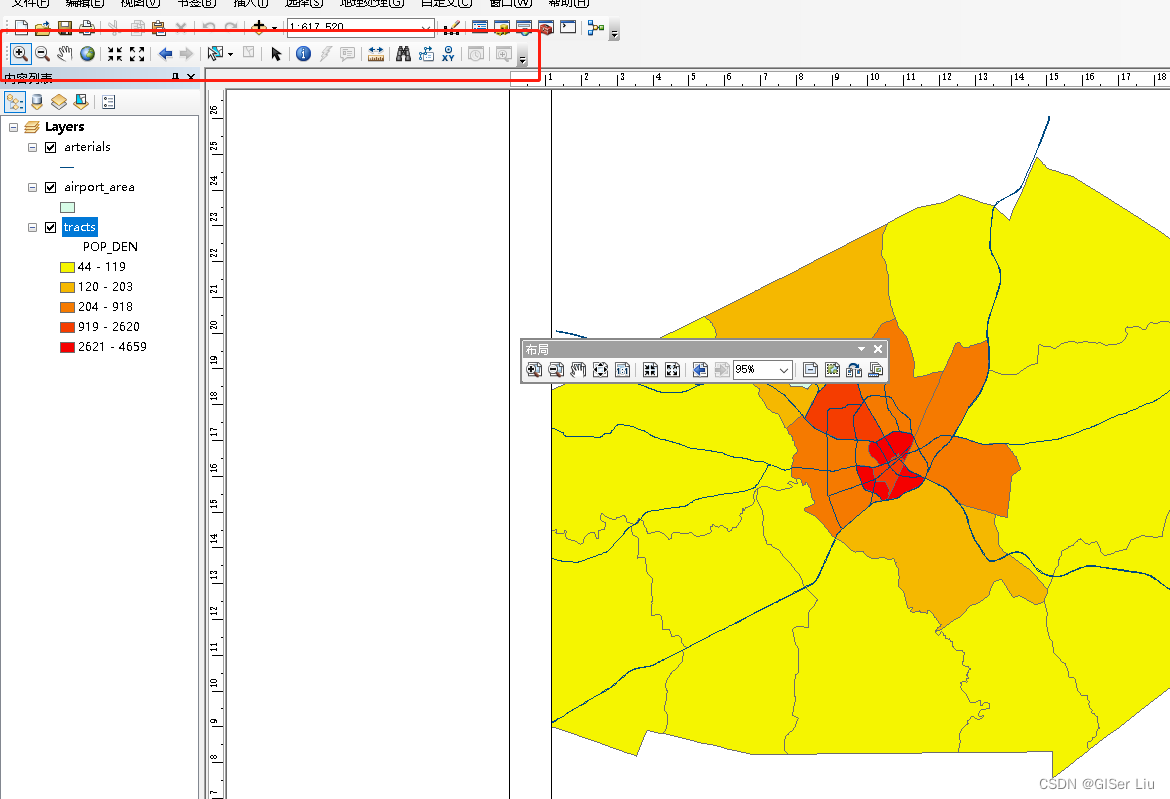
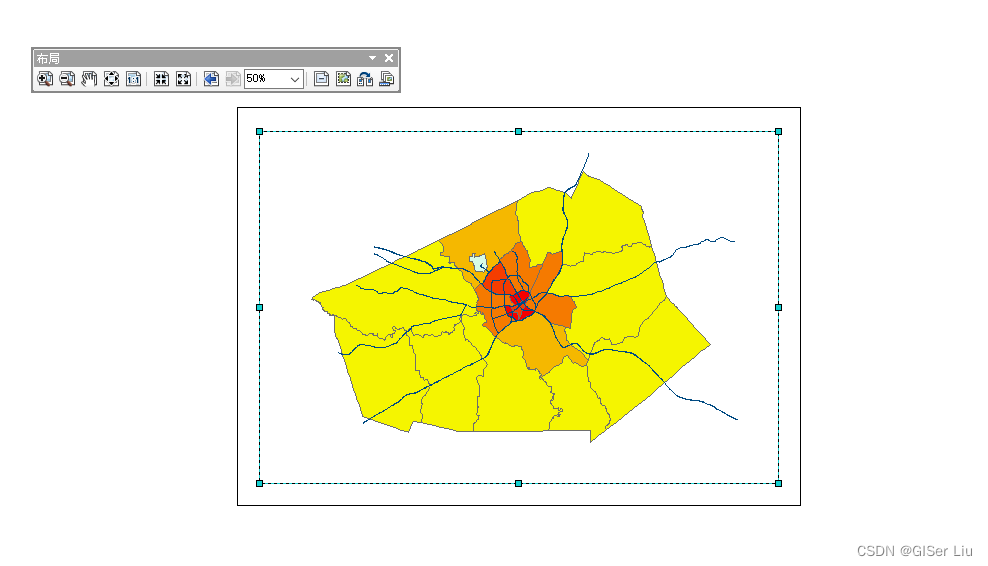
4. Under layout view , We can see the layout toolbar , We can adjust the size and position of the layout here . If you want to adjust the size of the internal data of the layout , You can select the data toolbar shown in the following figure .
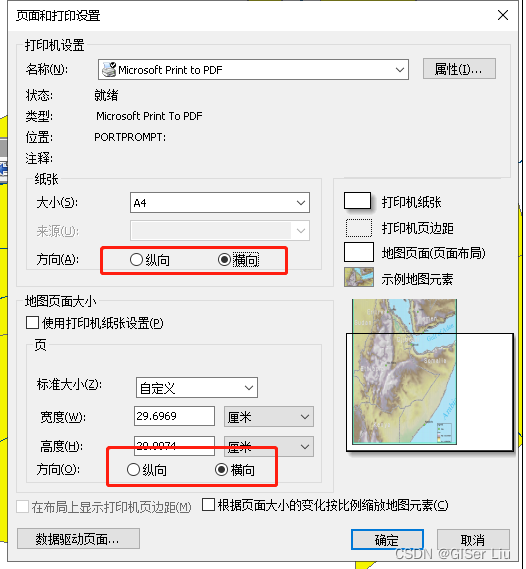
5. Under layout view , We need to add three elements of the map to the current layout : scale 、 legend 、 Compass , On this basis, you can also add titles , Characters and so on . But before that , We can see that the shape proportion of the data frame does not match the shape of the data , We can adjust the shape of the data frame in the page and print settings , Make it suitable for data layout .
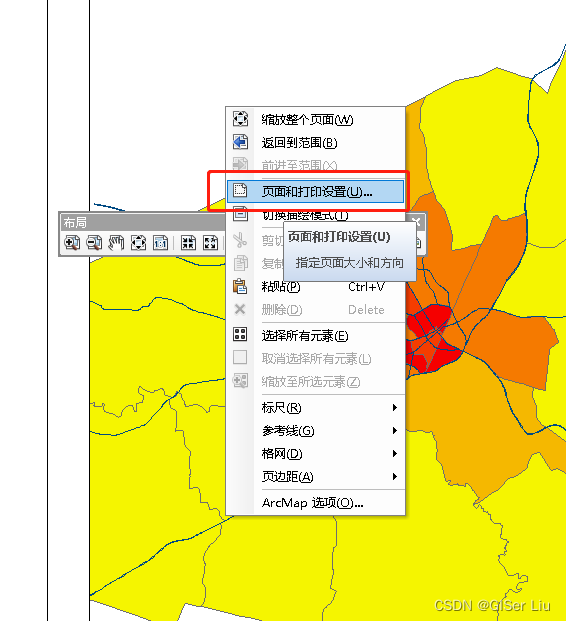
Right click under layout view > Page and print settings > Adjust the paper direction and map page direction to horizontal , determine > Manually adjust the boundary position of the data frame , Can be confirmed .
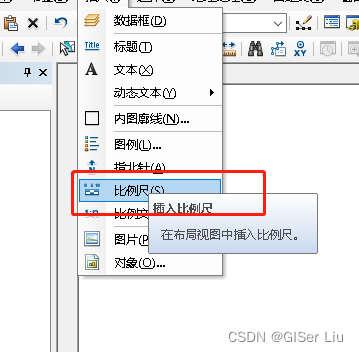
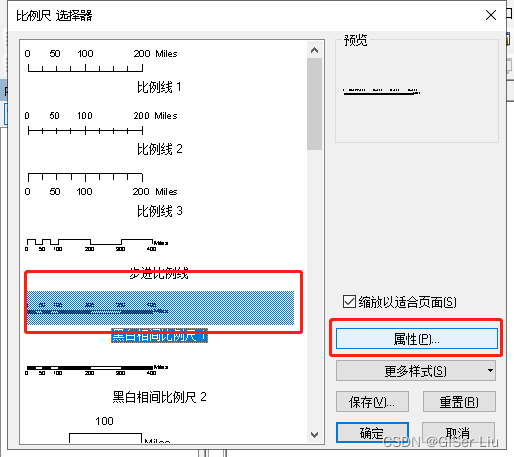
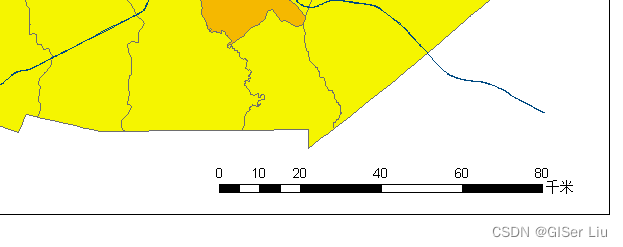
6. Insert scale bar . Now? , We can add map elements to the layout , Insert options in the menu bar and select the scale bar , The scale attribute can be set according to the specific situation , I adjust the scale unit here to km. Click OK twice and adjust the size , Just move to the right position .

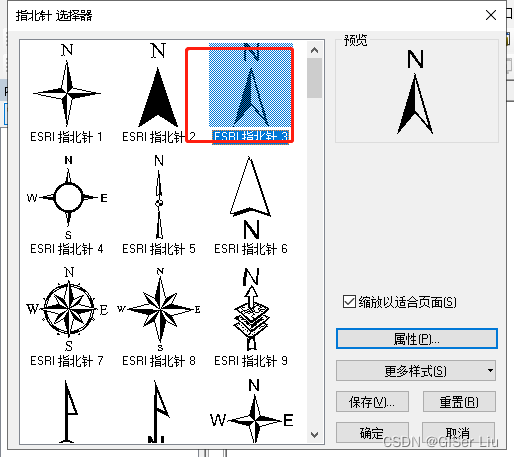
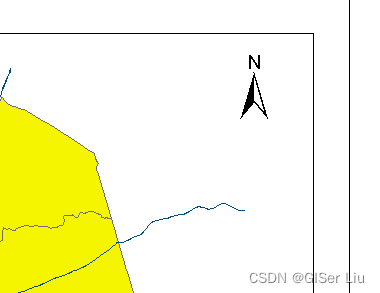
7. Insert the north arrow . Empathy , In the menu bar > Insert > Compass , Choose the right north arrow , Adjust the position and size .
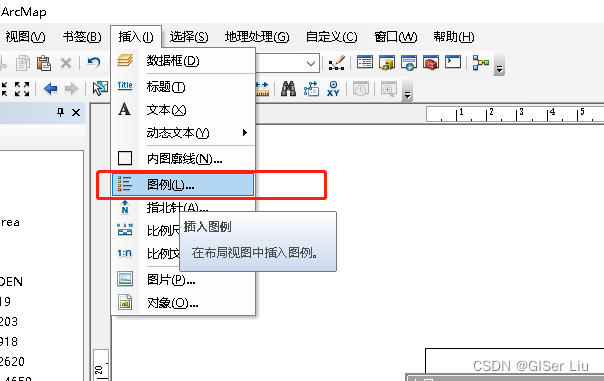
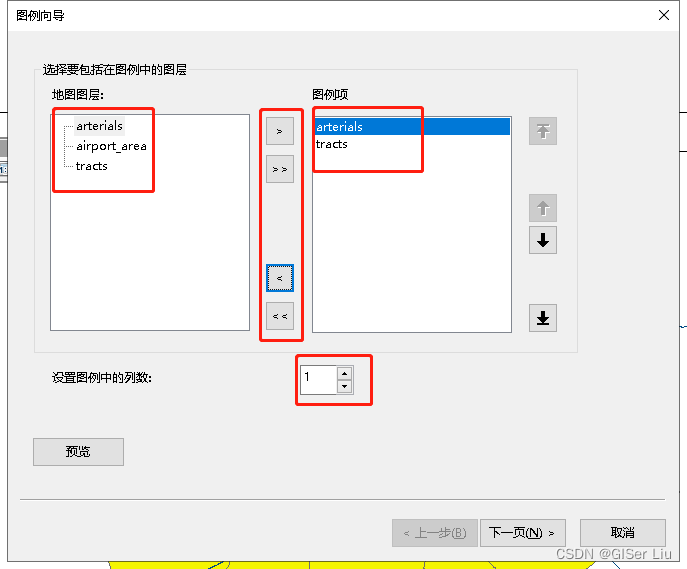
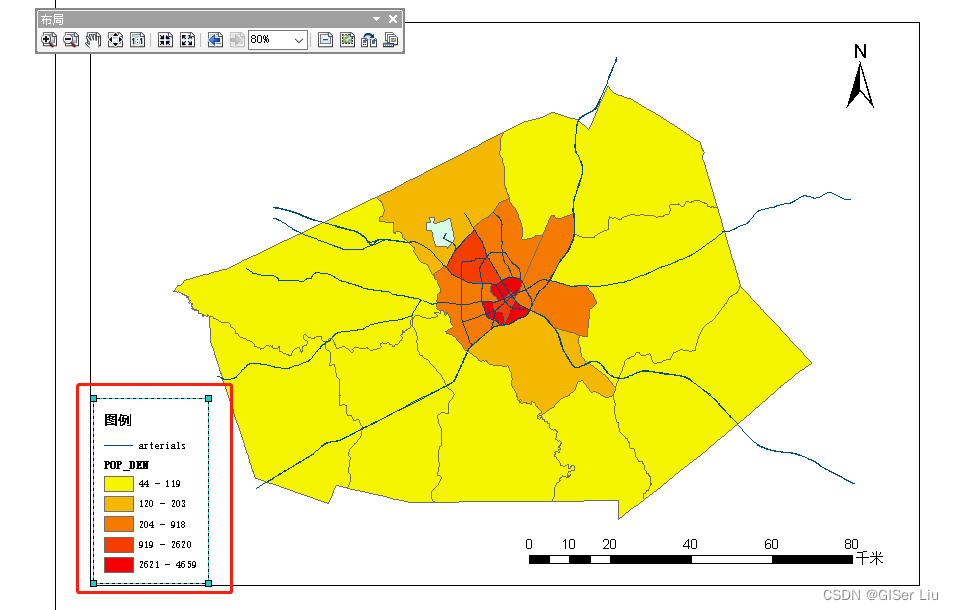
8. Insert legend , The legend is the description of the elements in the figure , The elements we show here are population density and road elements , Therefore, we only need to show these two elements in the legend , Also insert the legend . Adjust the layout .
We can select the layer to be displayed in the legend by adjusting the button in the middle , Click next .
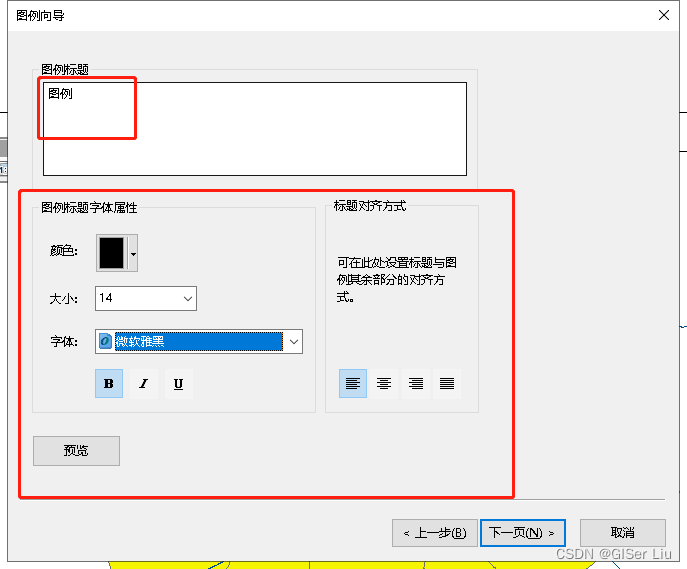
Fill in the legend title according to the actual situation , Adjust legend font properties , Click next .
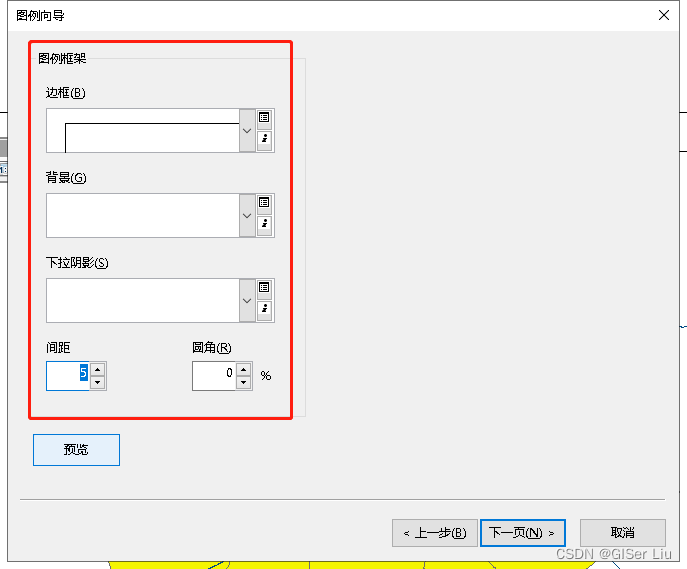
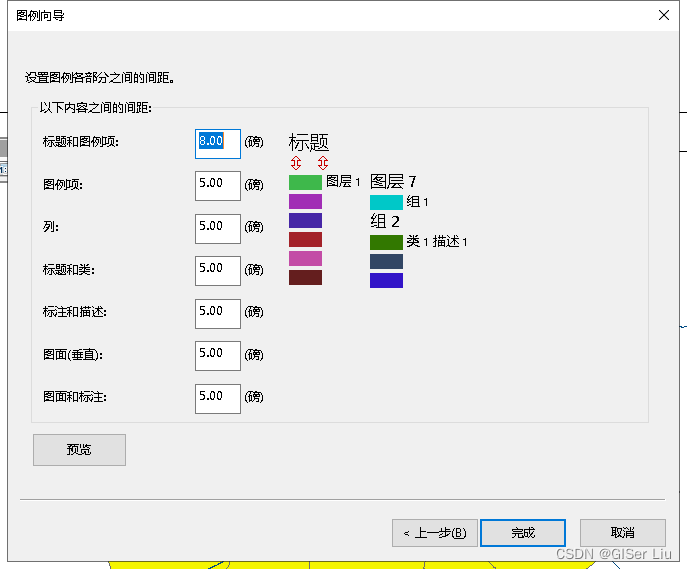
Choose the appropriate legend layout , I only choose to add borders here , Other default ; Click next .
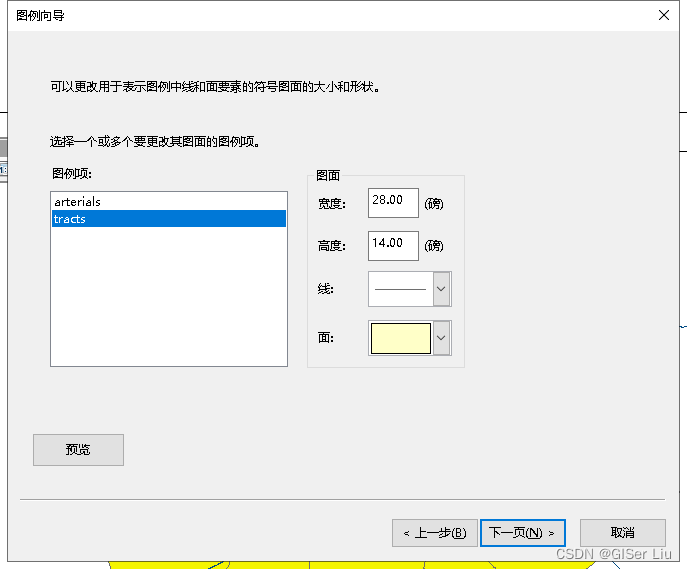
Other parameters default , Can be completed .
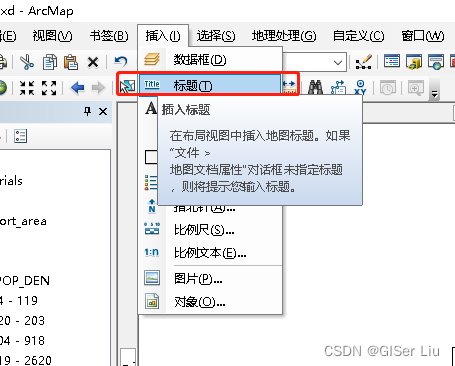
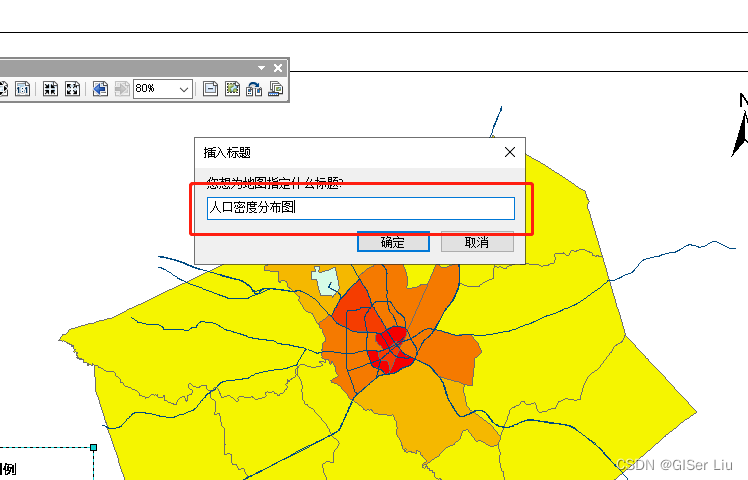
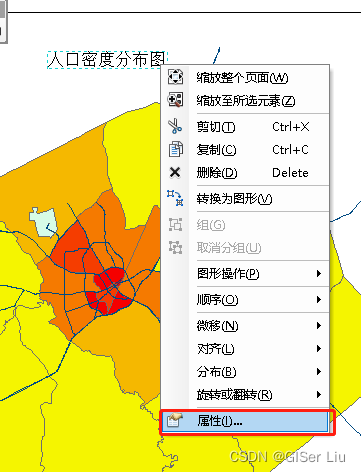
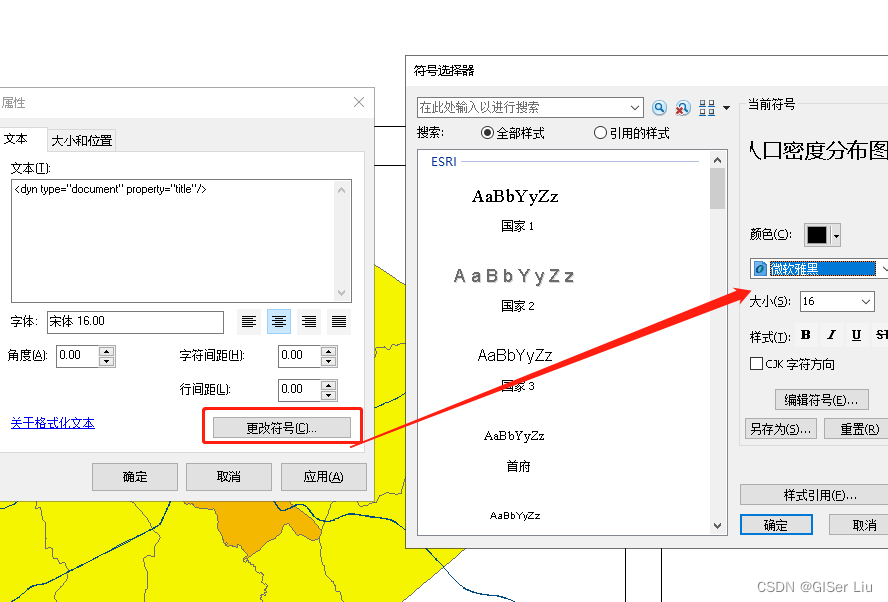
9. Insert title , Enter the title content , Right click Title Properties , Select the appropriate font and size and confirm , Our layout view is basically created .
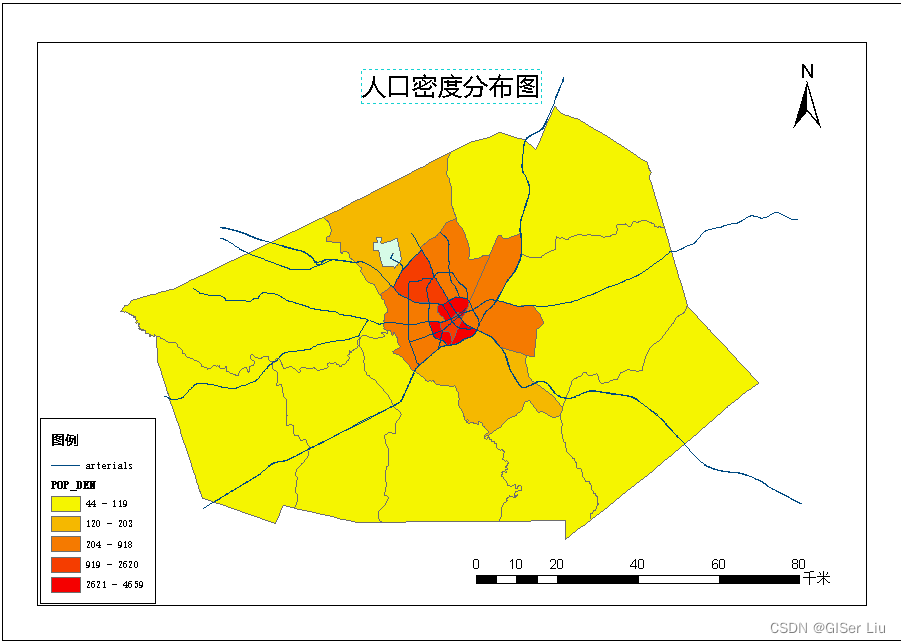
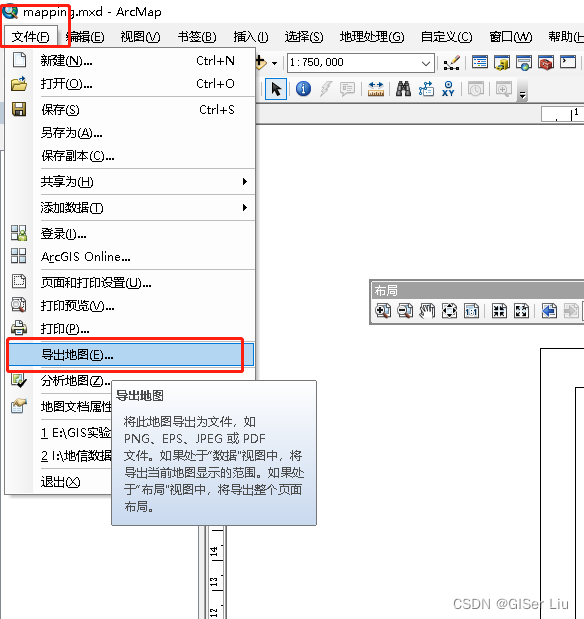
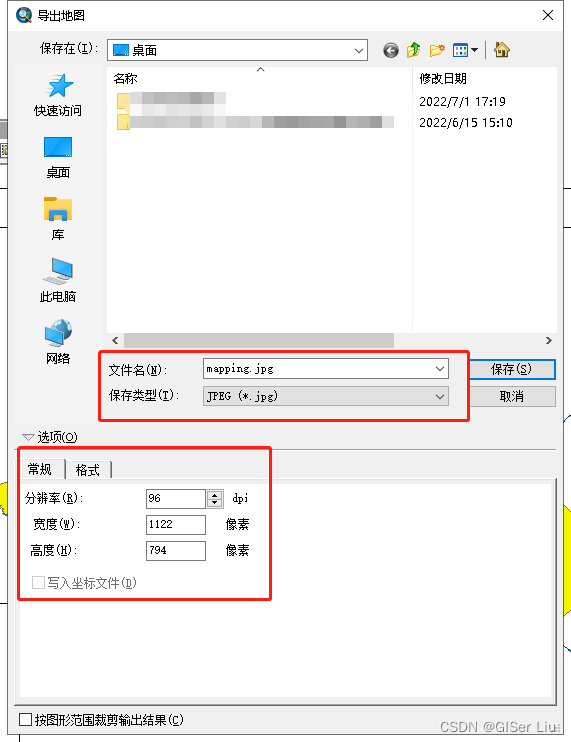
10. Export map . In the file > Export map > Select the resolution, save type and export path , Can be confirmed .
thus , The experiment is over !

If you think my article is helpful , Three even + Attention is the greatest encouragement to my creation !
more GIS Spatial analysis article
“ All articles on this site are original , Welcome to reprint , Please indicate the source of the article :https://blog.csdn.net/qq_45590504/category_11750215.html Baidu and all kinds of collection stations are not credible , Search carefully to identify . Technical articles generally have timeliness , I am used to revise and update my blog posts from time to time , So visit the source to see the latest version of this article .”
边栏推荐
- Vulhub vulnerability recurrence 71_ Unomi
- Modbus协议通信异常
- Text classification still stays at Bert? The dual contrast learning framework is too strong
- SQLite queries the maximum value and returns the whole row of data
- Unity gets the width and height of Sprite
- [cloud native] 3.1 kubernetes platform installation kubespher
- B站刘二大人-线性回归 Pytorch
- 应用安全系列之三十七:日志注入
- 用StopWatch 统计代码耗时
- [leetcode16] the sum of the nearest three numbers (double pointer)
猜你喜欢

Codeforces Round #804 (Div. 2) Editorial(A-B)
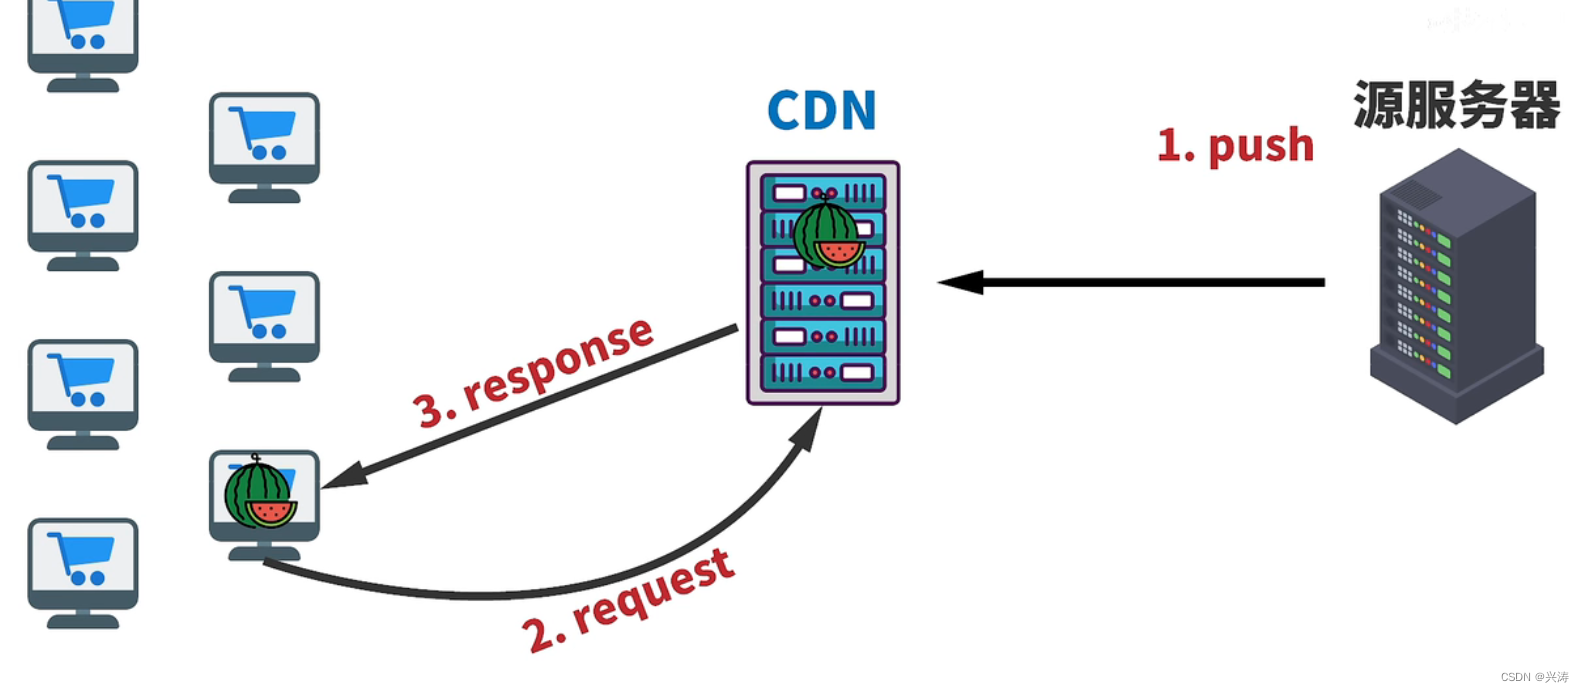
初识CDN

29io stream, byte output stream continue write line feed
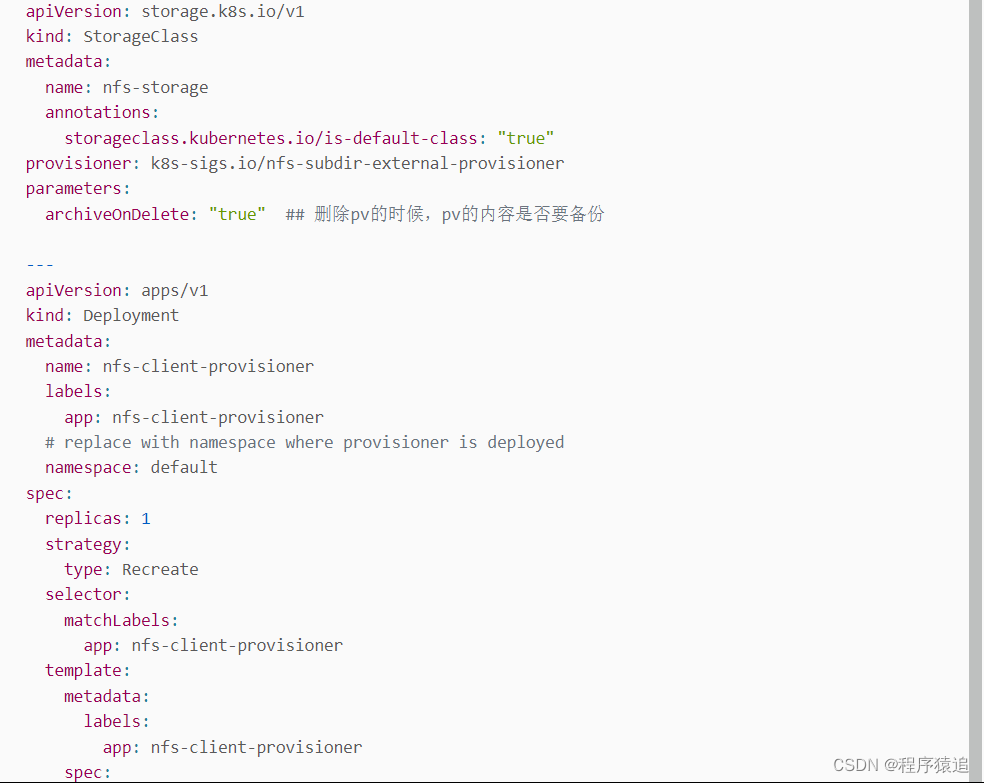
【云原生】3.1 Kubernetes平台安装KubeSpher
27io stream, byte output stream, OutputStream writes data to file
Unity Vector3. Use and calculation principle of reflect
What impact will frequent job hopping have on your career?

JS array list actual use summary
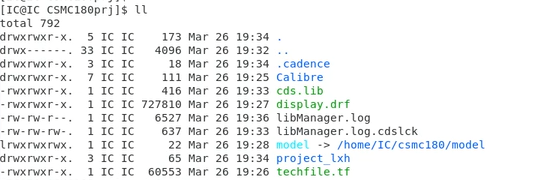
PDK process library installation -csmc
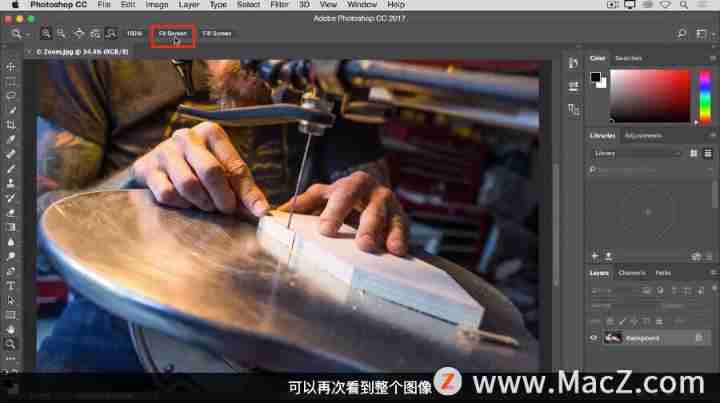
Zoom and pan image in Photoshop 2022
随机推荐
Self built DNS server, the client opens the web page slowly, the solution
[SQL Server Express Way] - authentification et création et gestion de comptes utilisateurs
[effective Objective-C] - memory management
[QNX Hypervisor 2.2用户手册]6.3.3 使用共享内存(shmem)虚拟设备
The ECU of 21 Audi q5l 45tfsi brushes is upgraded to master special adjustment, and the horsepower is safely and stably increased to 305 horsepower
LeetCode_ String inversion_ Simple_ 557. Reverse word III in string
Steady, 35K, byte business data analysis post
UCF (2022 summer team competition I)
05. 博客项目之安全
JDBC calls the stored procedure with call and reports an error
jdbc使用call调用存储过程报错
The ECU of 21 Audi q5l 45tfsi brushes is upgraded to master special adjustment, and the horsepower is safely and stably increased to 305 horsepower
【torch】|torch. nn. utils. clip_ grad_ norm_
HAC cluster modifying administrator user password
How can large websites choose better virtual machine service providers?
PDK工艺库安装-CSMC
Summary of deep learning tuning tricks
Problems encountered in installing mysql8 on MAC
Excel转换为Lua的配置文件
03. 开发博客项目之登录