当前位置:网站首页>How to create an interactive kernel density chart
How to create an interactive kernel density chart
2020-11-06 22:21:00 【roffey】
Highcharts It's a pure JavaScript A library of charts compiled , For you Web Website 、Web Applications provide intuitive 、 Interactive charts . Currently, broken lines are supported 、 curve 、 Area 、 Regional plot 、 Bar charts 、 Bar chart 、 The pie chart 、 Scatter plot 、 Angle measurement chart 、 Area map 、 Regional curve arrangement 、 Column arrangement 、 There are dozens of chart types, such as polar charts .
Click to download Highcharts The latest trial version
Kernel density estimation is a useful statistical method , Used to estimate the overall shape of the distribution of random variables . let me put it another way , Nuclear density estimates ( Also known as KDE) Can help us “ smooth ” And exploration does not follow any typical probability density distribution ( For example, normal distribution , Binomial distribution, etc ) The data of .
In this tutorial , We're going to show you how to Javascript Create interactive kernel density estimation and use Highcharts Library drawing results .
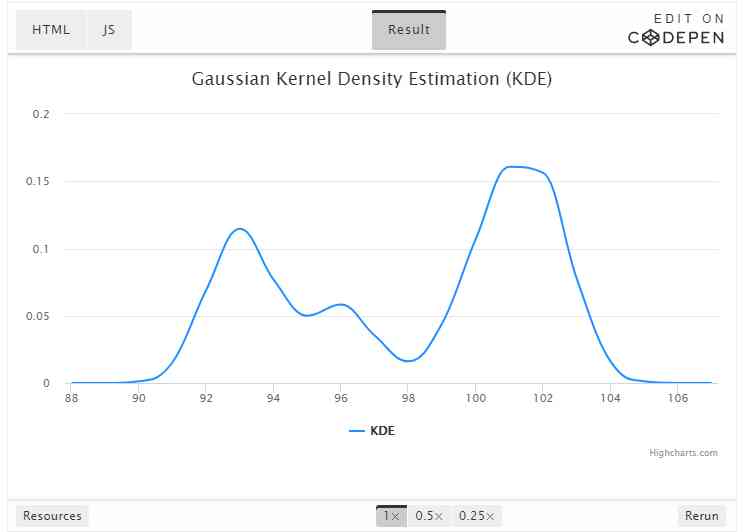
Let's first explore KDE chart ; Then we're going to delve into the code .
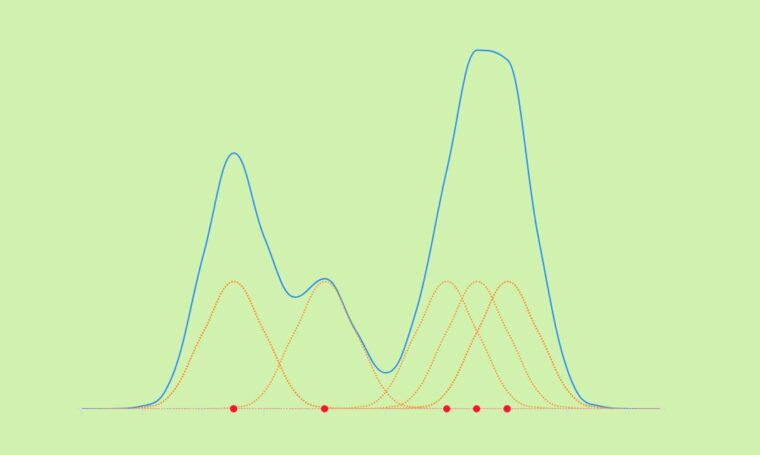
The following demonstration shows the Gaussian kernel density estimation for random data sets :
This chart helps us estimate the probability distribution of random data sets , And we can see that the data is mainly concentrated at the beginning and end of the chart .
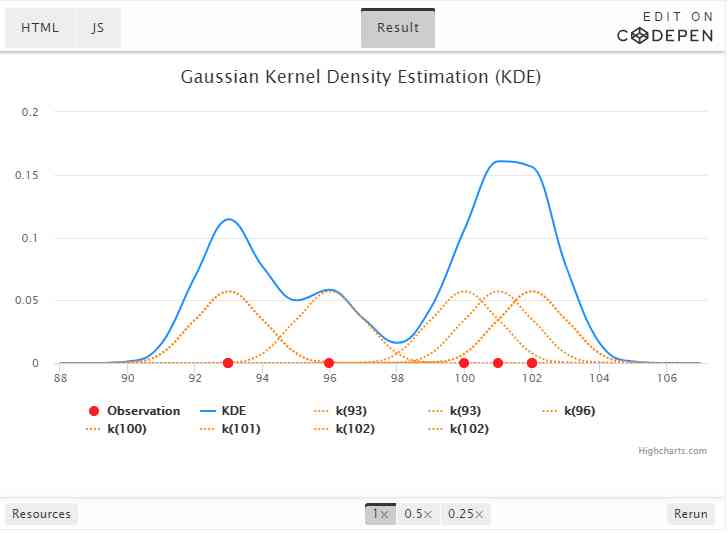
Basically , For each red data point , We draw a Gaussian kernel function in orange , Then sum all the kernel functions together , Create density estimates in blue ( Please see the demo):
By the way , There are many kernel function types , For example, Gauss , Unified ,Epanechnikov etc. . We're using a Gaussian kernel , Because it provides a smooth pattern .
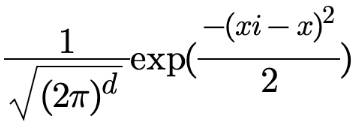
The mathematical expression of Gaussian kernel is :
Now? , You have an idea of what the kernel density estimation looks like , Let's take a look at the code behind it .
There are four main steps in the code :
- Create a Gaussian kernel function .
- Processing density estimators .
- Dealing with kernel points .
- Plot the entire data point .
Gaussian kernel
The following code represents the Gaussian kernel function :
function GaussKDE(xi, x) {
  return (1 / Math.sqrt(2 * Math.PI)) * Math.exp(Math.pow(xi - x, 2) / -2);
}
among x Represents the main data ( Observed value ),xi Represents the range and density estimation function of the rendering kernel . In our case ,xi The scope is 88 To 107, To ensure coverage 93 To 102 The range of observational data for .
Density estimation point
Here's how to recycle GaussKDE() Array representation of functions and ranges to create density estimators
xiData:
//Create the density estimate
for (i = 0; i < xiData.length; i++) {
  let temp = 0;
  kernel.push([]);
  kernel[i].push(new Array(dataSource.length));
  for (j = 0; j < dataSource.length; j++) {
    temp = temp + GaussKDE(xiData[i], dataSource[j]);
    kernel[i][j] = GaussKDE(xiData[i], dataSource[j]);
  }
  data.push([xiData[i], (1 / N) * temp]);
}
Kernel point
Only if you want to show kernel points ( Orange chart ) You need to perform this step when . otherwise , You are already satisfied with the density estimation steps . This is the code that handles the data points of each kernel :
//Create the kernels
for (i = 0; i < dataSource.length; i++) {
  kernelChart.push([]);
  kernelChart[i].push(new Array(kernel.length));
  for (j = 0; j < kernel.length; j++) {
    kernelChart[i].push([xiData[j], (1 / N) * kernel[j][i]]);
  }
}
Basically , This loop just adds the scope xiData To kernel Each array that has been processed in the density estimation step .
Draw points
After processing all the data points , You can use Highcharts Rendering series . Density estimates and kernels are spline type , The observations are plotted as scatter plots :
Highcharts.chart("container", {
  chart: {
    type: "spline",
    animation: true
  },
  title: {
    text: "Gaussian Kernel Density Estimation (KDE)"
  },
  yAxis: {
    title: { text: null }
  },
  tooltip: {
    valueDecimals: 3
  },
  plotOptions: {
    series: {
      marker: {
        enabled: false
      },
      dashStyle: "shortdot",
      color: "#ff8d1e",
      pointStart: xiData[0],
      animation: {
        duration: animationTime
      }
    }
  },
  series: [
    {
      type: "scatter",
      name: "Observation",
      marker: {
        enabled: true,
        radius: 5,
        fillColor: "#ff1e1f"
      },
      data: dataPoint,
      tooltip: {
        headerFormat: "{series.name}:",
        pointFormat: "<b>{point.x}</b>"
      },
      zIndex: 9
    },
    {
      name: "KDE",
      dashStyle: "solid",
      lineWidth: 2,
      color: "#1E90FF",
      data: data
    },
    {
      name: "k(" + dataSource[0] + ")",
      data: kernelChart[0]
    },...  ]
});
Now? , You are going to explore your own data using the function of the kernel density estimation map .
Feel free to share your comments or questions in the comments section below .
版权声明
本文为[roffey]所创,转载请带上原文链接,感谢
边栏推荐
- Design of NAND flash interface control
- 2020-08-19: what mechanism does TCP ensure reliability?
- [doodling the footprints of Internet of things] Introduction to Internet of things
- 如何创建交互式内核密度图表
- JVM class loading mechanism
- 2020-08-19:TCP是通过什么机制保障可靠性的?
- JVM memory allocation - xms128m - xmx512m - XX: permsize = 128M - XX: maxpermsize = 512M
- Novice guidance and event management system in game development
- 2020-08-15:什么情况下数据任务需要优化?
- Why is quicksort so fast?
猜你喜欢

Empty test suite appears in JUnit test
WebAPI接口设计:SwaggerUI文档 / 统一响应格式 / 统一异常处理 / 统一权限验证
Count the number of project code lines
Event monitoring problem
The native API of the future trend of the front end: web components
2020-09-03:裸写算法:回形矩阵遍历。
Cloudquery v1.2.0 release
Reserved battery interface, built-in charge and discharge circuit and electricity meter, quickly help easily handle hand-held applications
Practice of Xiaoxiong school development board: real equipment access of smart street lamp sandbox experiment
Design of NAND flash interface control
随机推荐
Introduction to the development of small game cloud
Method of code refactoring -- Analysis of method refactoring
Exclusive interview with Alibaba cloud database for 2020 PostgreSQL Asia Conference: Zeng Wenjing
The first choice for lightweight GPU applications is the NVIDIA vgpu instance launched by Jingdong Zhilian cloud
Markdown tricks
应用层软件开发教父教你如何重构,资深程序员必备专业技能
Introduction to Huawei cloud micro certification examination
Js字符串-String字符串对象方法
“非洲用户的付费意愿并不低”——专访四达时代研发总监张亮
Count the number of project code lines
20个XR项目路演,近20个资本机构出席!诚邀您参加2020 Qualcomm XR生态合作伙伴大会
Python 100 cases
2020-08-14:数据任务的执行引擎用的哪些?
Points to be considered when deleting mapping field of index in ES
The role of theme music in games
STM32F030F4P6兼容灵动微MM32F031F4P6
Win7 AppCrash (solution)
Flink's datasource Trilogy: direct API
Interviewer: how about shardingsphere
小程序商城系统插件代码该如何写?怎么用代码检查添加插件是否成功?