author : Ten sleep
summary
Stability is greater than everything , Therefore, we need to have more effective ways to avoid online failures . Under the assumption that failure is inevitable , We need to be able to fix it quickly , Reduce online impact . Based on these ideas , We proposed 1-5-10 Fast recovery goal of , So-called 1-5-10 Our goal is to enable us to solve online problems 1 Minute discovery ,5 Minute positioning ,10 Minute repair . Next, we will introduce some information about fault recovery on Alibaba cloud 、 Some best practices for diagnostics .
This article excerpts from Microservice governance technology white paper 3.9 section
Follow the Alibaba cloud native official account , Backstage reply key words 【 Technical white paper 】 You can download it. !
1 Minute discovery
monitor
The role of monitoring can be summarized as : Find problems in the application , And alarm the problem in time to the technicians for treatment . Monitoring types can be divided into system problem monitoring and business problem monitoring , System problems : Common hardware and software related problems , For example, program exception , Memory fullGC etc. , Because there are no business characteristics , The monitoring strategy can be applied to various applications . The business problem : Problems defined under specific business scenarios , For example, there are no coupons for goods , Over issuance of rights and interests , The monitoring strategy needs to be customized according to the business characteristics .
Alibaba cloud real-time application monitoring service ARMS It can automatically discover and monitor common Web The framework and RPC frame , And count the call volume of the interface 、 response time 、 Number of errors and other indicators . At the same time, we can further obtain the slow speed of the interface SQL、MQ Stack analysis report or exception classification report , right and wrong 、 Slow and other common problems for more detailed analysis .
ARMS It also provides the ability of business monitoring , In a non intrusive way , Visually define business requests , Provide rich performance indicators and diagnostic capabilities that fit the business . A new way to measure application performance and stability from a business perspective , Carry out full link monitoring of key business transactions . Business monitoring tracks and collects business information in applications , Show business level indicators in real time , For example, the response time of the business 、 Times and error rate , It solves the problem that there is no mapping relationship between applications and business performance .
There are three requirements for monitoring . real time : The discovery and early warning of problems are required to be real-time , Reduce the time delay of problem generation and discovery ; accuracy : Monitoring and early warning are required to be accurate , Including the definition of monitoring problems , For the warning threshold , Early warning level , Allocation of responsible persons , Avoid false positives ; comprehensive : Early warning information is required to be comprehensive , It can help troubleshoot and solve problems .
“ No matter what happens to the application ,ARMS Can clearly show the problem in which line of code .ARMS It's very important for us , Greatly shorten the time to repair the fault , Significantly improved user experience . Since using ARMS, We can find and fix problems in time , Never be bothered by user complaints .” —— CR Vanguard
The alarm
When the monitoring finds something wrong , It is necessary to alarm the problem to technicians in time through different levels of alarms .ARMS Alarm management can improve the operation and maintenance efficiency of the system from the following points .
5 Minutes to locate the fault
Service instance isolation and diagnosis
In the online microservice scenario , When exceptions occur in some instances of the service provider , One side , Service consumers need to avoid accessing abnormal instances , On the other hand , It is necessary to keep the abnormal scene , Facilitate subsequent troubleshooting . For another consideration , We all know Dump Memory will affect the performance of our applications to a certain extent , It may affect our online business , Can we be in Dump Isolate the traffic from the instance before memory .MSE The service instance isolation and diagnosis function of the governance center can help us isolate the traffic of abnormal instances , On the one hand, it supports the isolation of traffic from microservices , On the other hand, support will come from K8s Service To isolate the flow , It can completely isolate the business traffic in the production environment , Then we can apply real-time monitoring services in combination with Alibaba cloud ARMS Memory snapshot generation capability provided , Generate online environment memory snapshots of abnormal instances in time , Help us with subsequent problem analysis and diagnosis . The service instance isolation and diagnosis function can help us deal with sudden online accidents ( Such as memory leakage ), Improve the overall stability of the microservice system .
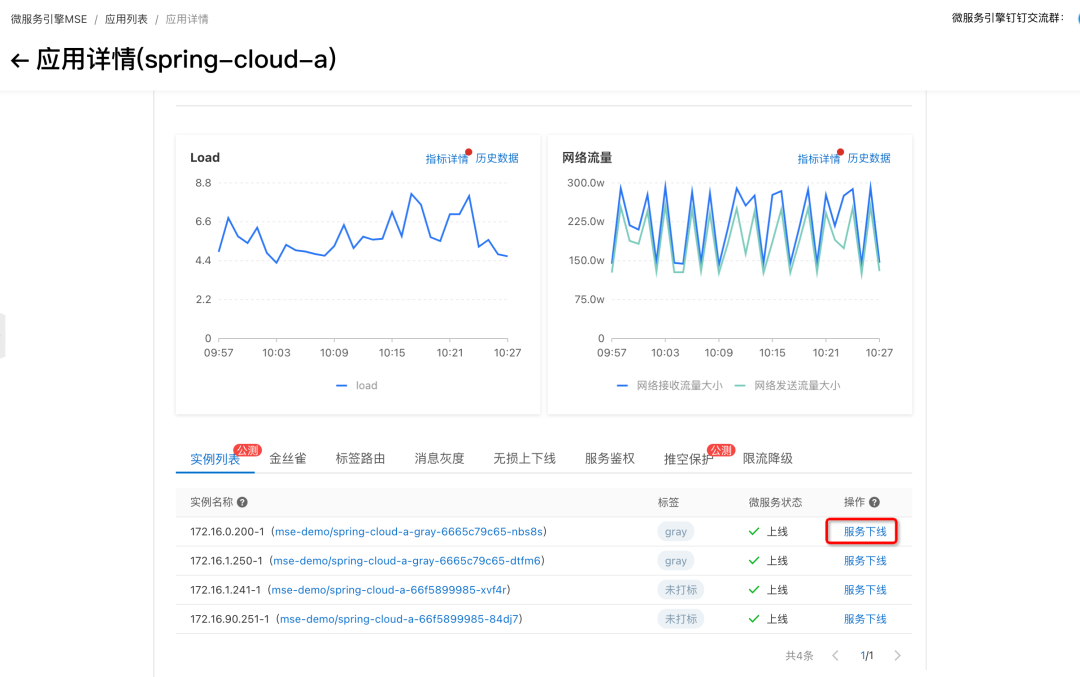
We can do it in MSE The service governance console sees the online instance list .

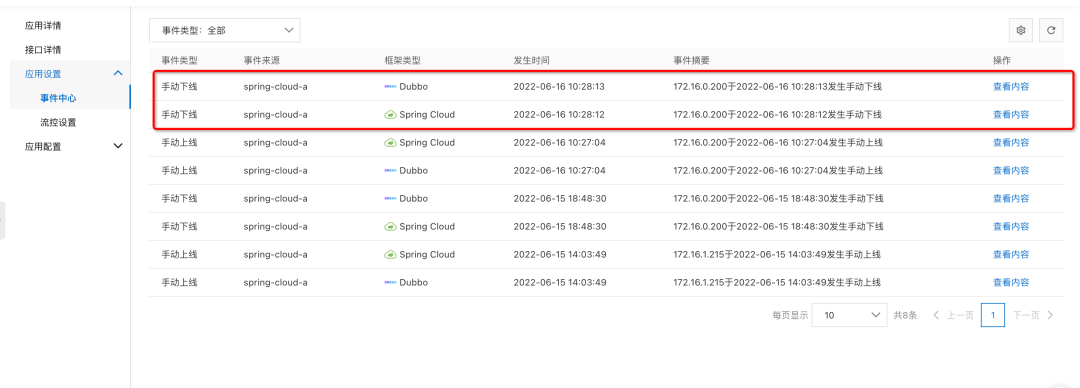
Select a specific exception instance , Conduct service offline operation , Remove the instance from the registry , At the same time, if we configure MSE Ready to check probe provided , Will also come from K8s Service To isolate the flow , We can check whether the corresponding instance is successfully offline in the event center .

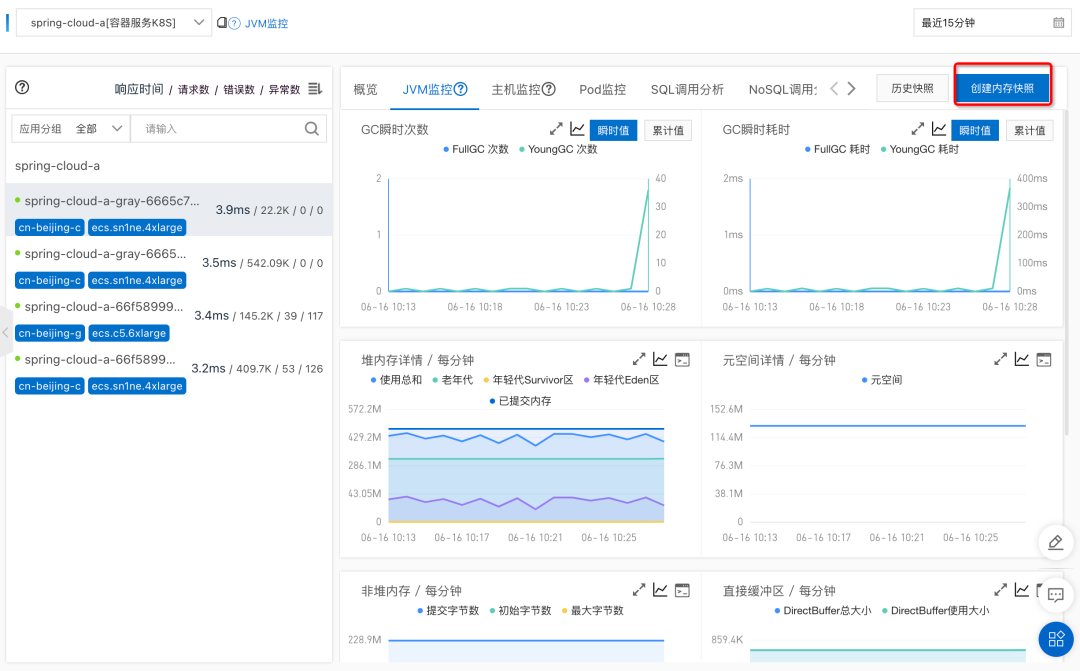
After offline operation , We can go through MSE The second level node monitoring provided can see whether there is still traffic . Wait until the flow stops completely , Alibaba cloud application monitoring service ARMS Provides the function of creating memory snapshots , Create a memory snapshot for the exception instance , For further troubleshooting .

Click the create memory snapshot button , Create memory snapshots .

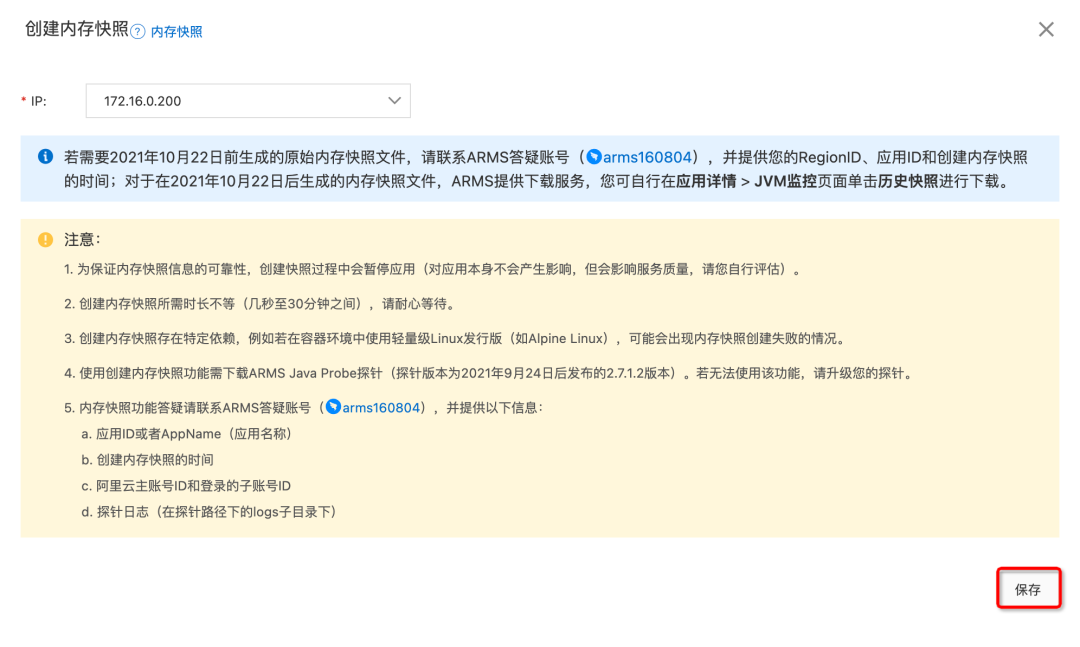
Click Save to create a snapshot task .

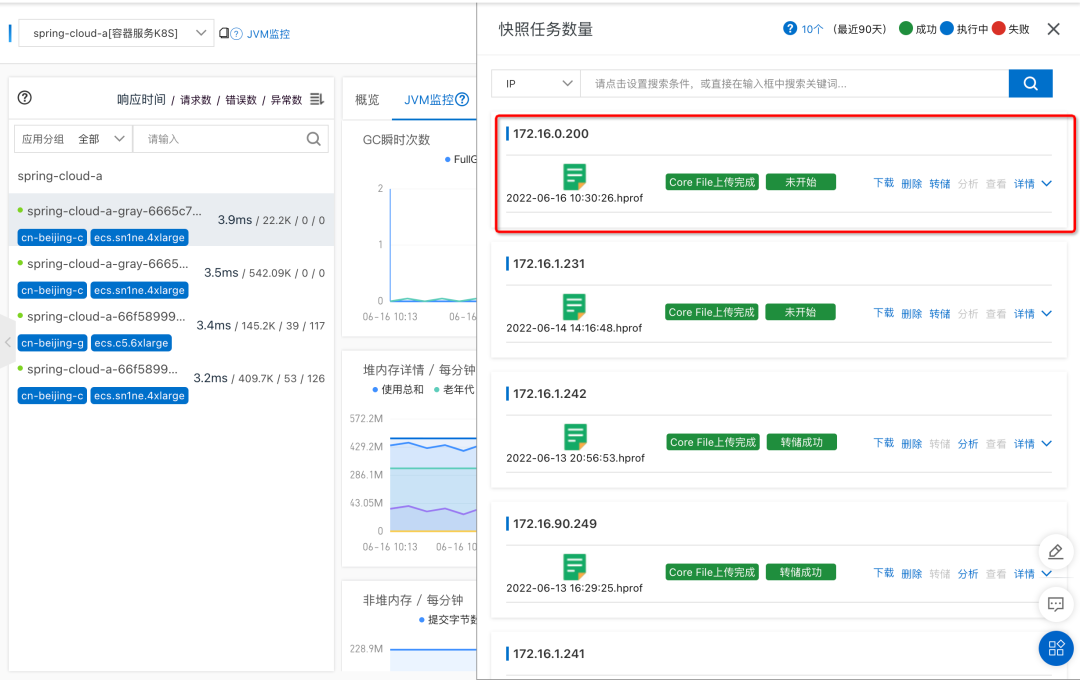
After clicking save, we see 172.16.0.200 This instance already has a snapshot

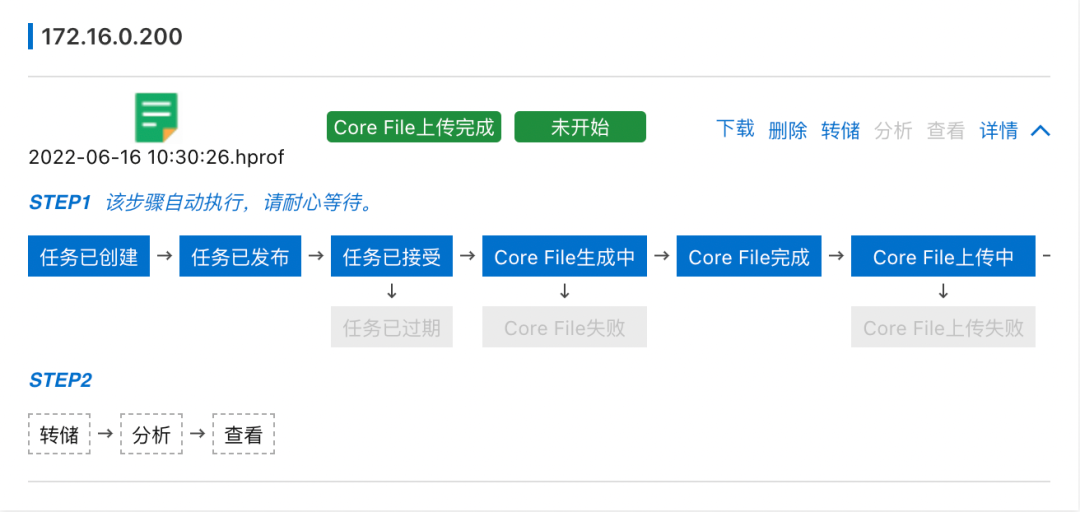
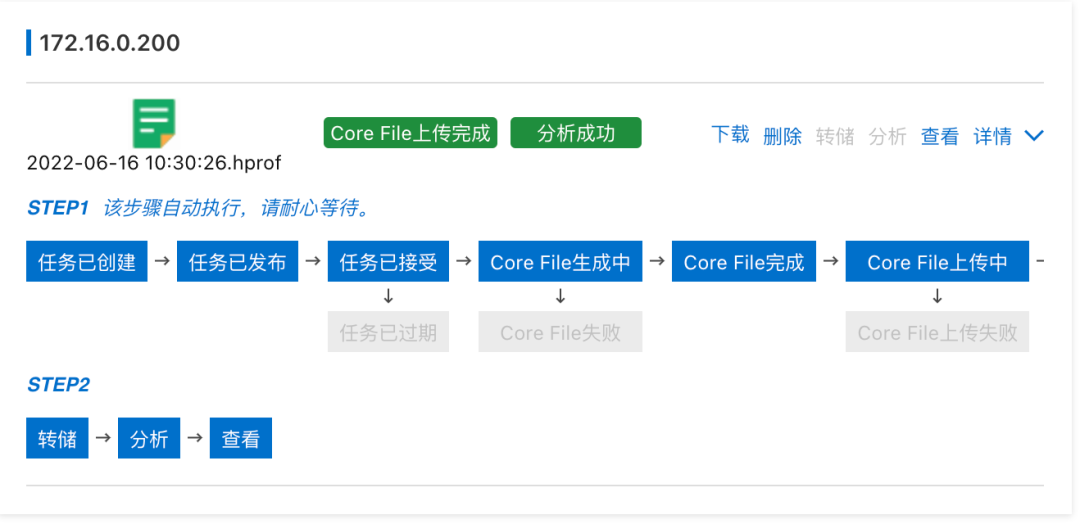
Further according to the prompt of the console , We will respectively Core File Dump 、 analysis 、 see


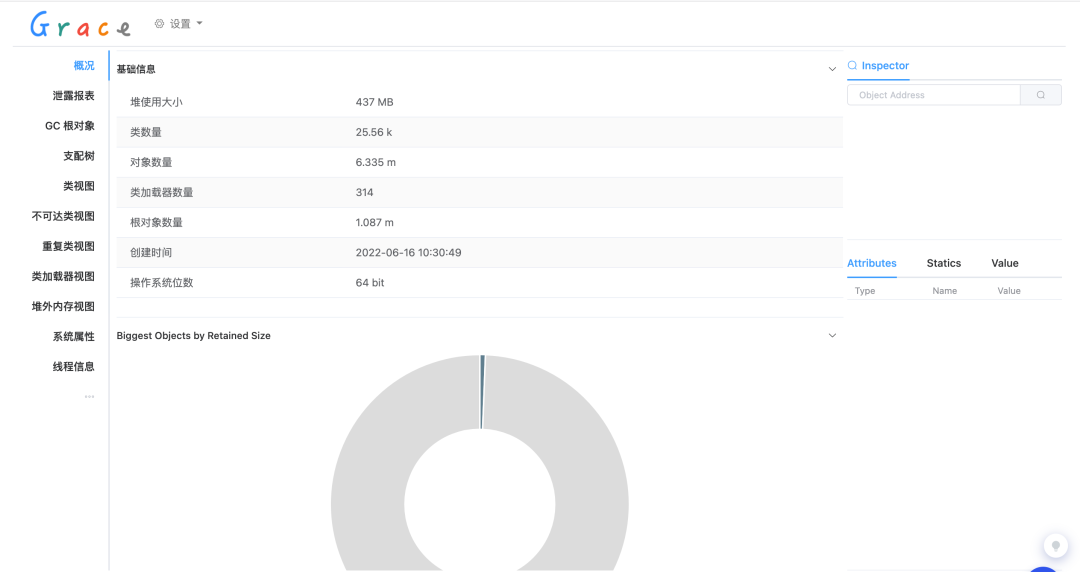
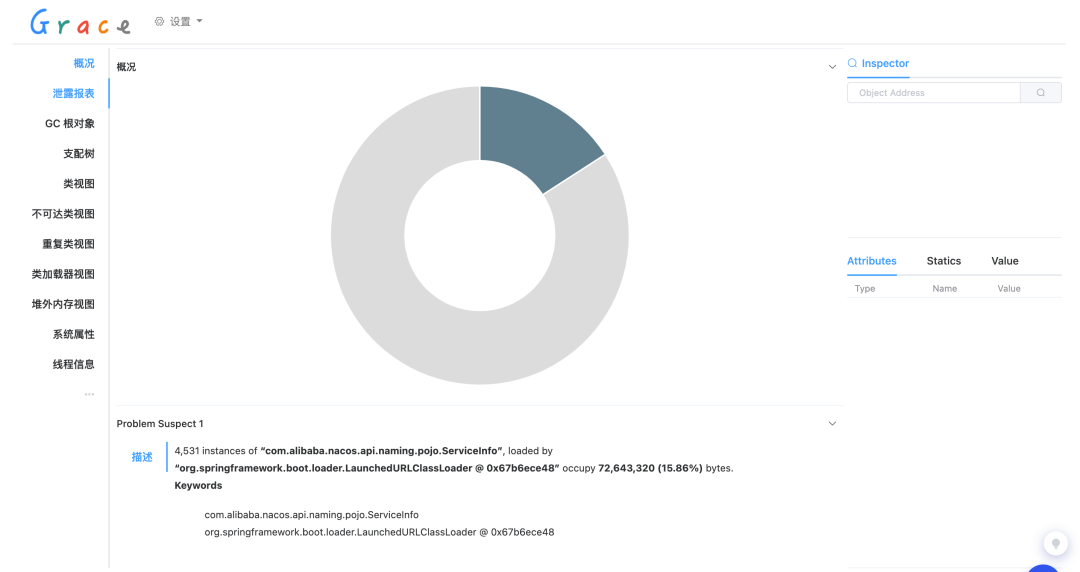
Click to view , Automatically jump to Grace Analyzed pages , We can see the overview of memory analysis , Memory leak report 、 Class loader and a series of information . View the details of memory usage through detailed memory analysis data , So as to further troubleshoot memory problems such as memory leakage and memory waste .


Last mention , We can restore the isolated traffic through the service online .

Arthas The diagnosis
Arthas It's a diagnosis Java The sharp weapon of online problems in the field , Using bytecode enhancement technology , Can be restarted without JVM In the case of process , Check the operation of the program .
JVM The overview supports viewing applications JVM Related information , Include JVM Memory 、 Operating system information 、 Variable information, etc , Help us understand JVM The general situation of .
1、JVM Memory :JVM Memory related information , Including heap memory usage 、 Non heap memory usage 、GC Situation, etc .

2、 Operating system information : Information about the operating system , Including average load , Operating system name 、 Operating system version 、Java Version, etc .

3、 Variable information : Information about variables , Including system variables and environment variables .

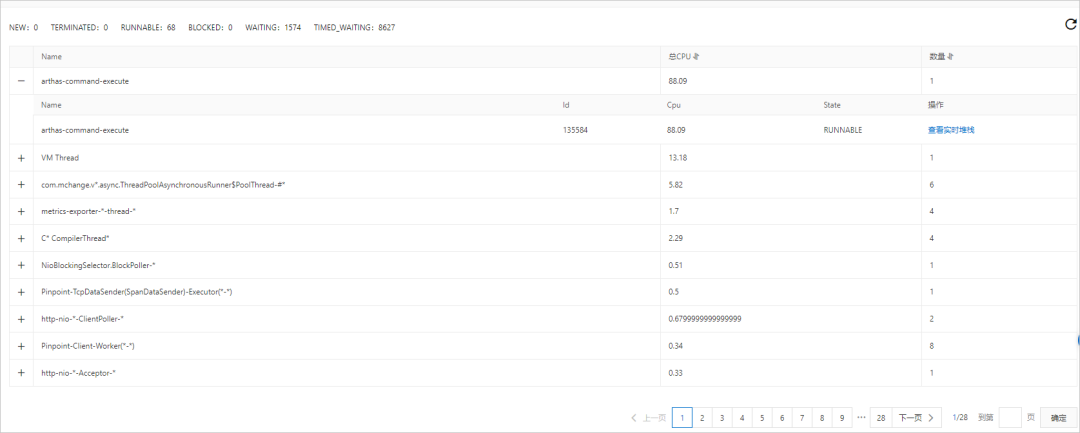
Thread time analysis supports displaying all threads of the application and viewing the stack information of threads , Help us quickly locate time-consuming threads .
1、 The thread time analysis tab will get the current in real time JVM The thread time of the process , And aggregate similar threads . You can view the thread ID、CPU Usage and status .

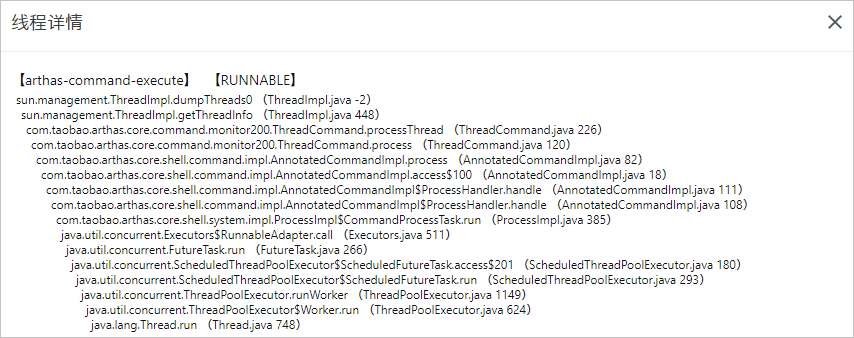
2、 We can use the operation column on the right side of the target thread , Click view live stack .

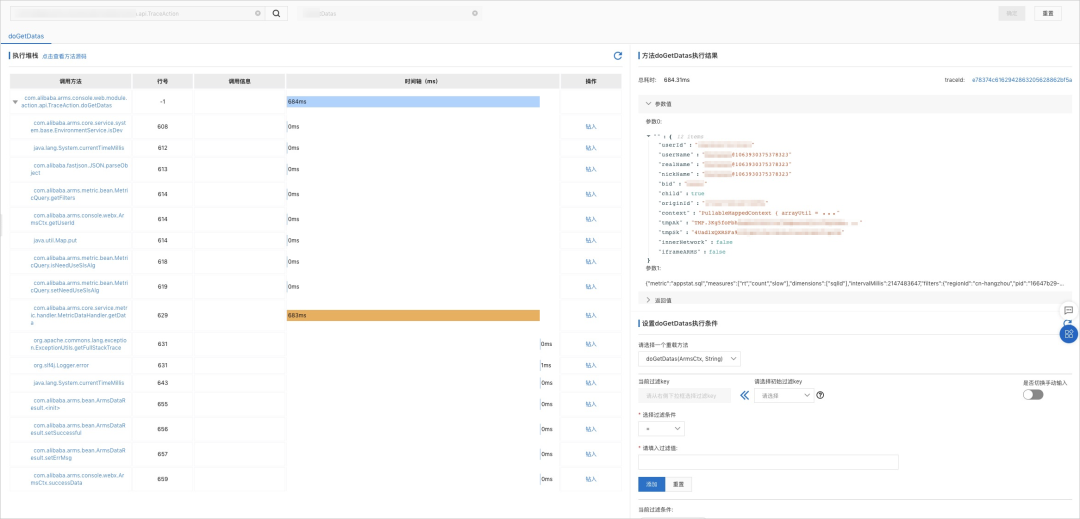
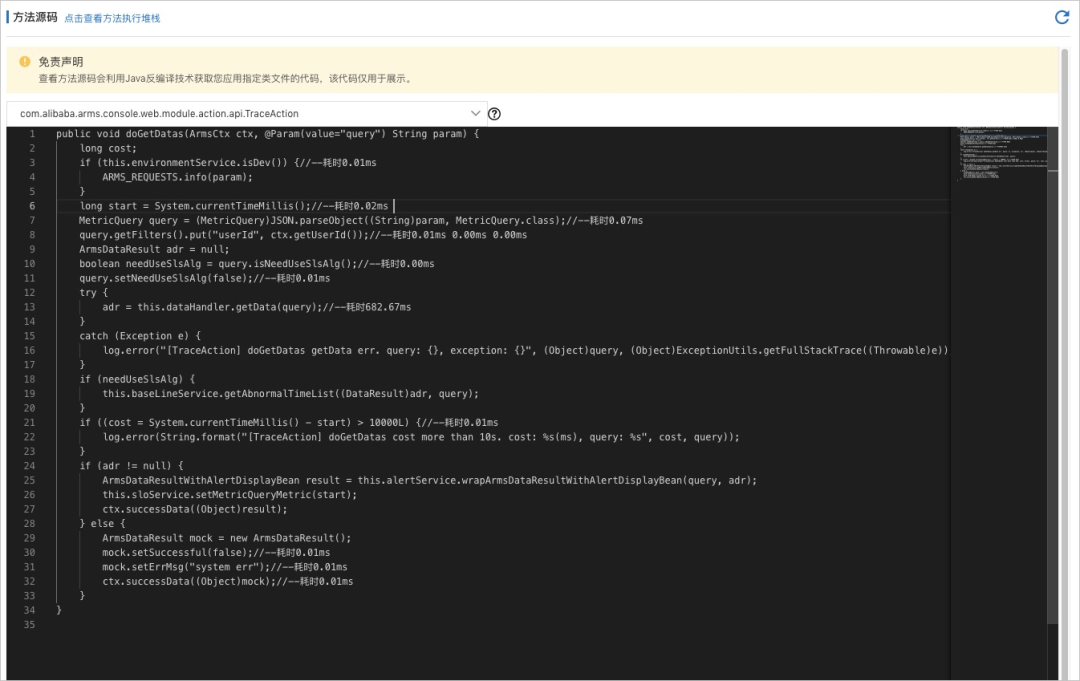
Method execution analysis supports capturing the time-consuming execution of a method 、 Enter the reference 、 Return value and other information and drill in , Help you quickly locate the root cause of slow calls , And scenarios such as problems that cannot be reproduced offline or logs are missing .

As shown in the figure below , The execution time of each internal method will be displayed in the source code in the form of comments .

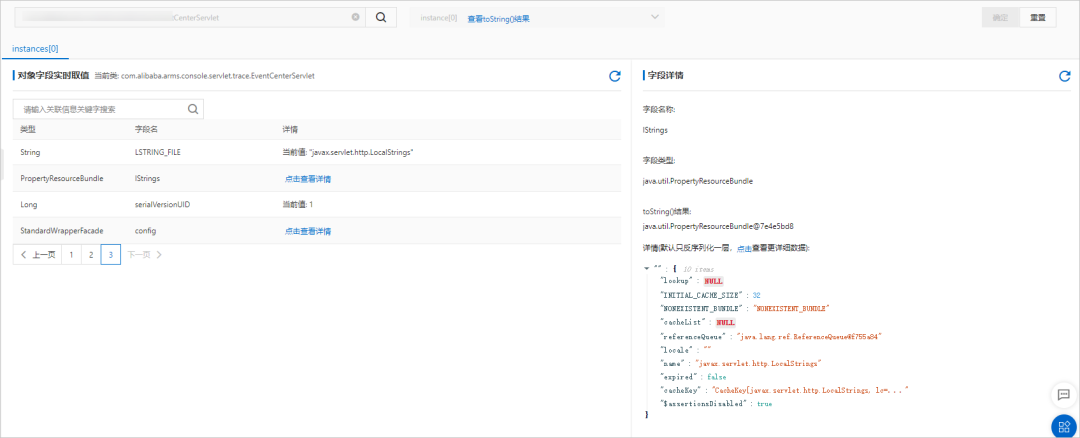
The object viewer is used to view the current state of some singleton objects , Used to troubleshoot abnormal application status , For example, application configuration 、 Black and white list 、 Member variables, etc .

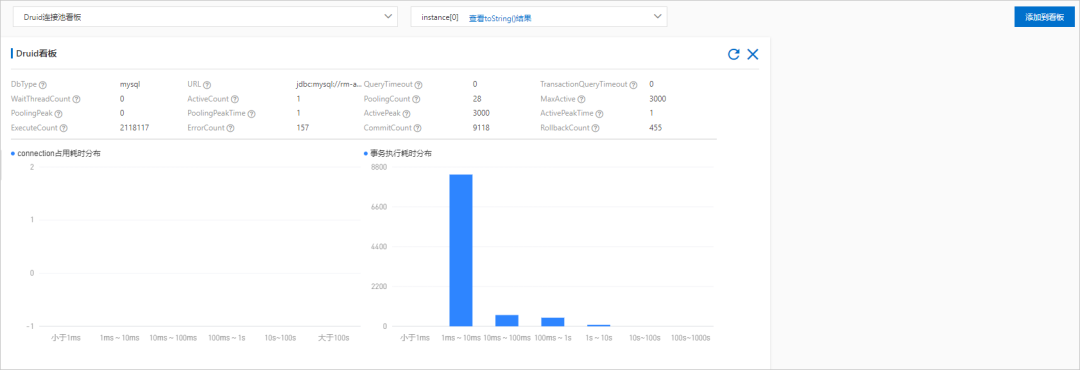
Real time Kanban is used to view the real-time status of key components used in the system , For example, check the usage of database connection pool 、HTTP Usage of connection pool , It is conducive to the troubleshooting of resource types .
As shown in the figure below, it is a Druid Real time status information of connection pool , Including basic configuration 、 Connection pool status 、 Execution time distribution, etc .

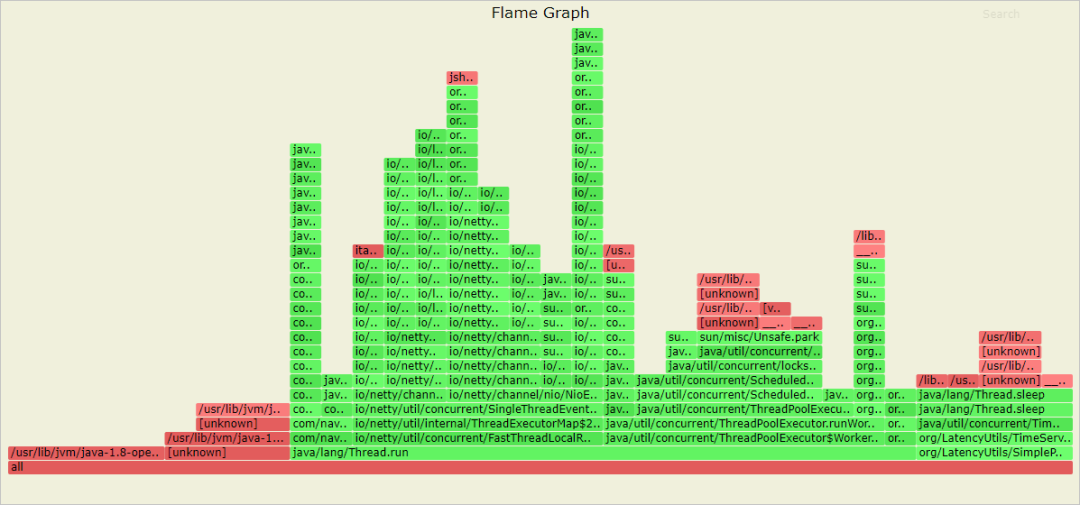
Performance analysis supports CPU Time consuming 、 Memory allocation and other objects are sampled for a certain time and the corresponding flame diagram is generated , Help you quickly locate the performance bottleneck of your application .

10 Minutes to recover
To remove from a crowd
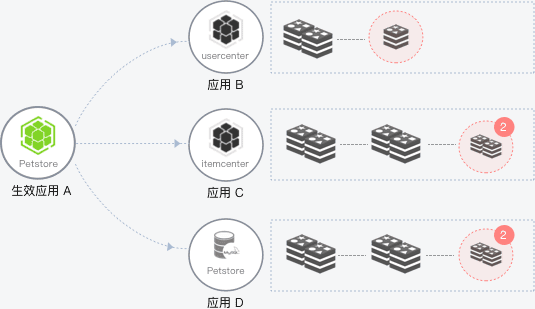
In the microservices architecture , When some instances of the service provider's application are abnormal , When the service consumer cannot perceive it, it will affect the normal invocation of the service , And affect the service performance and even usability of consumers . The outlier instance removal function will detect the availability of application instances and make dynamic adjustments , To ensure that the service is successfully invoked , So as to improve the stability of the business and the quality of service .

Service breakdown and degradation
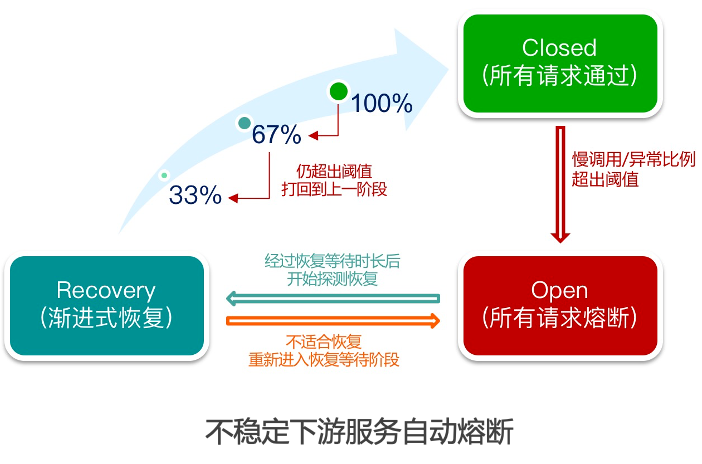
When applications encounter business peak , It is found that downstream service providers encounter performance bottlenecks , Even when it is about to affect the business . We can fuse some service consumers , Automatic fusing for persistent unstable calls , So as to improve the stability of the overall service . When the downstream services that the application depends on are unavailable , Cause loss of business flow . You can configure the service fusing capability , When the downstream service is abnormal , Service degradation enables traffic to flow on the caller "fail fast", Effectively prevent avalanches .
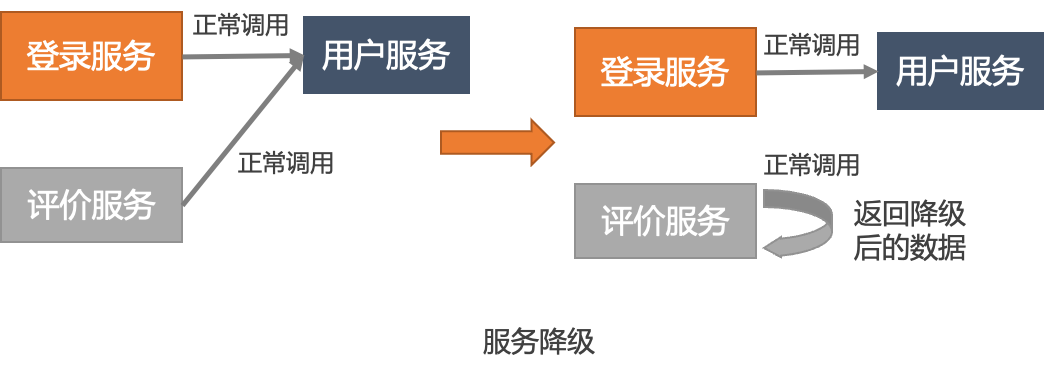
At the peak of business , Some downstream service providers are experiencing performance bottlenecks , Even affect the business . We configure automatic fusing for some non critical service consumers , When the slow call ratio or error ratio within a period of time reaches a certain condition, the fuse will be automatically triggered , In the following period, the service call returns directly Mock Result , This can ensure that the caller is not dragged down by unstable services , It can also serve the unstable downstream “ Breathe ” Time for , At the same time, it can ensure the normal operation of the entire service link .

Other scenes , Service degradation can help us ensure some important services . Some non critical services are not very stable , We hope to demote these weak dependent service calls temporarily before important activities , Reserve resources for other core services , So as to ensure the smoothness of the overall business .

Outlier instance removal and service fusing 、 Service degradation is mainly reflected in two points :
1、 Done automatically : Service degradation is an operation and maintenance action , It needs to be configured through the console , And specify the corresponding service name to achieve the corresponding effect ; And outlier instances are removed 、 Service fusing capability is to actively detect the survival of upstream nodes or successful exceptions of service calls 、 Slow call, etc , Do automatic isolation or fusing operation on this link , Guarantee the quality of service .
2、 Remove grain size : The service degradation is ( service + node IP), With Dubbo For example , A process will publish with the service interface name (Interface) Microservice named for service , If the degradation of this service is triggered , This service of this node will not be called next time , But it still calls other services . But the whole node will not try to call when the outlier instance is removed .
Flow control 、 Capacity expansion 、 restart 、 Roll back
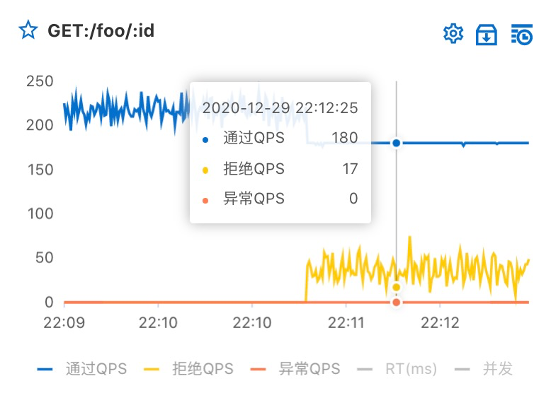
flow control : According to the flow 、 Number of concurrent threads 、 Response time and other indicators , Adjust the random flow to a suitable shape , That is, flow shaping . Through flow control capability , Configure flow control rules for service interfaces , Let requests within the capacity range pass , Redundant requests rejected , Equivalent to the role of airbag . Layers of protection , stay Nginx/Ingress The gateway layer performs coarse-grained protection , At the microservice layer API、 Interface 、 Method 、 Parameter granularity control . Avoid applications being overwhelmed by transient traffic peaks , So as to guarantee the high availability of the application .

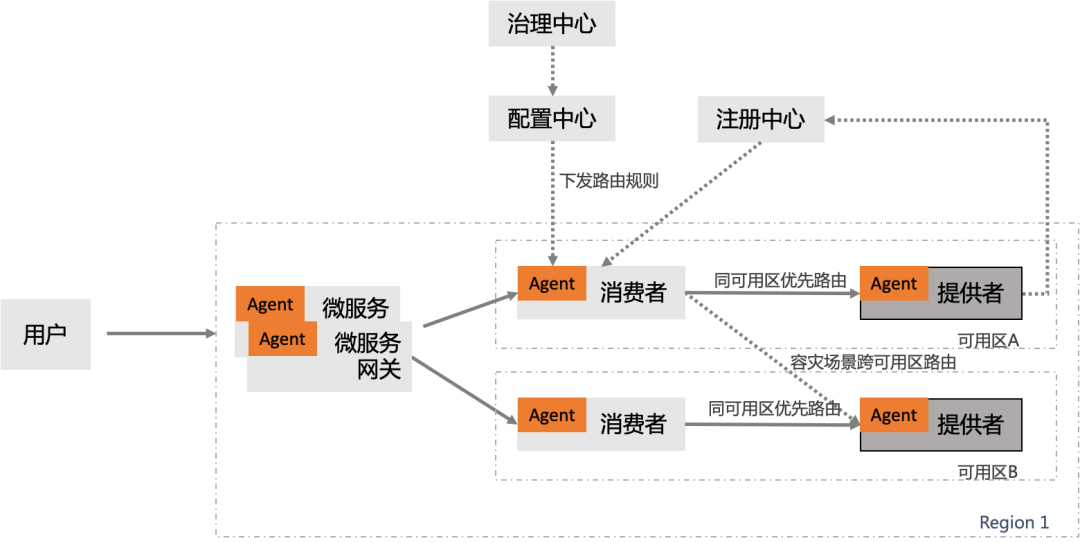
Based on the priority of the same availability zone, one click streaming
The characteristic of the same city is RT Generally, the delay is at the bottom (< 3ms within ), So by default , We can build a large LAN based on different available areas in the same city , Then distribute our application across multiple zones , In order to cope with the failure of a single availability zone, we can better control the influence surface of the failure .

MSE Service governance provides the ability of preferential routing with the computer room at the service framework level , If the target service is the same as your own zone , Then the traffic is preferentially routed to nodes in the same zone as the current one . When an availability zone is unavailable , We only need to cut the traffic at the gateway , Isolate the flow of the failed availability zone , That is, we can resume our business immediately .
tail
1-5-10 Fault fast recovery , fault 1 Minute response 、5 Minute positioning 、10 Minutes to recover ; Only by constantly failing to design 、 Drill based on fault emergency mode , Then when we really encounter an online fault, we can face the fault more calmly . We hope that the new generation of cloud native microservices can have more system self-healing capabilities , Microservice architecture can automatically sense the failure of external components , Automatically switch to the standby link , Really nip the fault in the cradle .
MSE First purchase of professional edition of registration configuration center 9 A discount ,MSE Full specification of cloud native gateway prepaid 9 A discount .
Click on
, Enjoy the discount !
原网站版权声明
本文为[InfoQ]所创,转载请带上原文链接,感谢
https://yzsam.com/2022/186/202207050124251869.html
