当前位置:网站首页>Practice and thinking of offline data warehouse and Bi development
Practice and thinking of offline data warehouse and Bi development
2022-07-02 07:16:00 【Software development heart】
Offline warehouse and bi Practice and thinking of development
background
The author's main work before coming to vipshop was mainly based on the company's self-study bi Low code platform for reporting 、 Chart development work , On this basis, we should explore the commercialization . Therefore, I have some practice in offline data warehouse modeling and development , There are also some thoughts , Try to do a brief comb here .
What is a data warehouse
First of all, a brief explanation , What is a data warehouse . Data warehouse is a collection of data storage , Its purpose is to analyze business data and support decision-making . The input of data warehouse is the data generated by each application system of the enterprise , Filter enterprise data through a specific paradigm model , Consolidation and storage , And then provide it to the data application . It can provide... For enterprises bi Ability , The purpose is to better control and guide the business process of the enterprise .
The structure of data warehouse includes Bill Inmon Paradigms and Ralph Kimball normal form , In order to bi Data report is the final application of small and medium-sized data projects , Usually used Kimball Paradigm as a development guidance model , But usually more ods Layer stores the data introduced by the business system , Similar to a hybrid architecture .
Kimball normal form 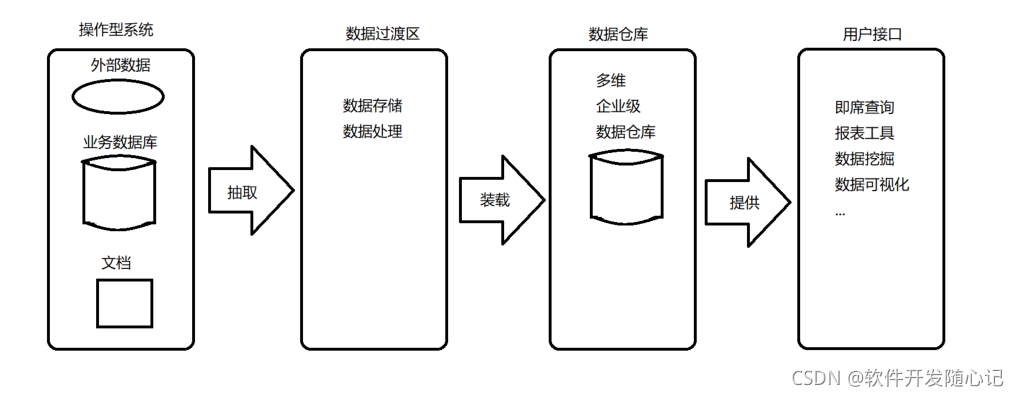
Inmon normal form 
Layered design
Data import layer (ODS): Structured processing of unstructured data , Structural data usually uses the offline data synchronization method to synchronize the data of the business system in full or increment , Prepare for data conversion and loading .
Data common layer (CDM):1, Dimension table (DIM), Through the sorting of business , Establish consistent data analysis dimensions . The unified definition and management of dimension tables is often an important factor in whether the final project is controllable .2, A detailed fact sheet (DWD), Dimension based modeling , Reuse relational Computing , Reduce data scanning .3, Public summary (DWS), It is usually summarized on the basis of the schedule , Build a unified statistical index , Creating a wide table .
Data application layer (ADS): complex , Individualization , Customized calculation index . Application based wide table data assembly .
Dimensional modeling
As mentioned above , With bi The modeling method based on application usually adopts Kimball normal form , The logical model is star model or snowflake model . Considering the complexity control , In actual development, we often use star model . The logical structure of a typical star model is shown in the figure below , A topic table is associated with multiple dimension tables , stay sql Layers are connected in different ways and accumulated , The use of semi cumulative function produces data on this basis , Do multidimensional analysis .
What do low code platforms do ?
Based on dimension model , In the scenario of report and chart development , Can design ide Generate model agreement and report agreement by dragging . The report protocol metadata is dynamically generated through engine parsing sql, get data . A model is listed below , agreement , Reports and dynamically generated sql Simple example of .
Suppose there's a model : And then there's a ide Take over the whole development process ,ide Metadata of topics can be generated , Dimension metadata , Multidimensional model metadata .
Now there is a report requirement as shown in the figure below .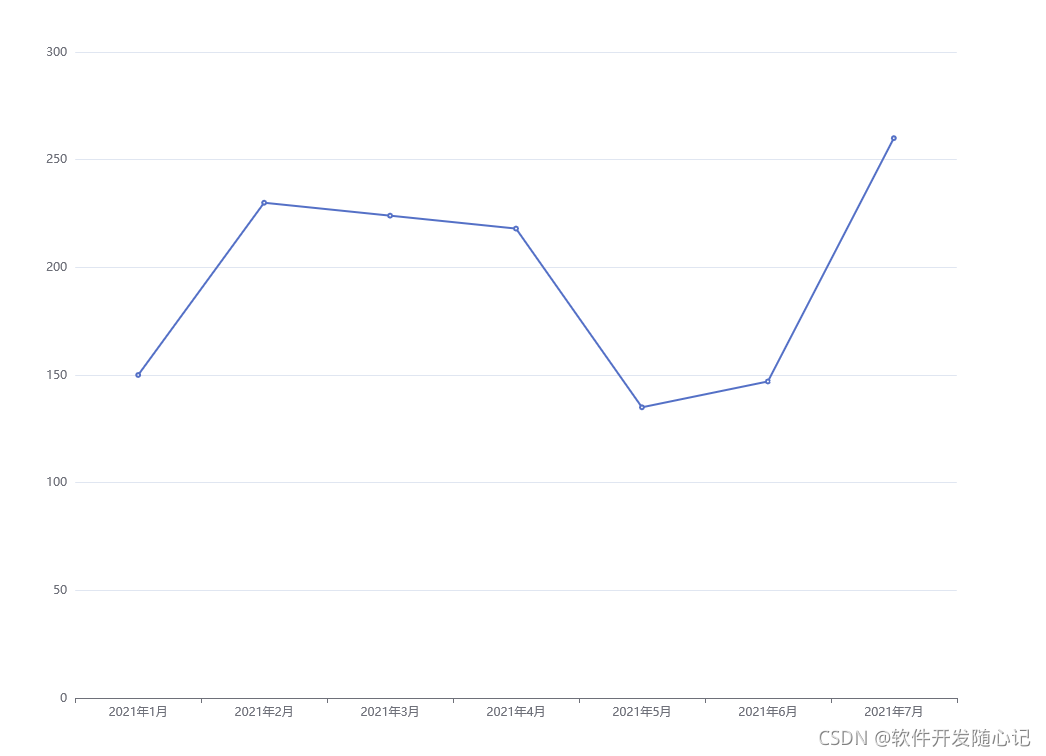 Then the implementer can pass ide Drag and drop method to pull indicators and dimensions ,
Suppose such a report agreement is generated ( Just the simplest example description ).
{ “id”:xxx,
“modelid”: Linking multidimensional models id, You can get the table and connection relationship ,
“reporttype”: “linebar”,
“rows”: [
{
“code”: “xxx”,
“dimid”:“ Metadata of linked dimension table ”
“elementname”: “yearmonth”,
“alias”: “ years ”
}
],
“indexs”: [
{
“code”: “xxx”,
“factid”:“ Metadata of linked topic table ”
“elementname”: “index”,
“aggregator”: “sum”,
“alias”: “ indicators ”
}
]
}
],
“options”: { Front end interaction related parameter Protocol , For example, the definition of time control },
“echartsoption”: {echarts Chart related parameters }
}
Then when the front end requests the report , The engine parses the Report Protocol , Combined with metadata such as model and subject dimension, as well as the transfer parameters of the front end of this request , Dynamically generate the requested sql( be based on postgres), similar
select
dim_date.yearmonth as  years ,
sum(fact.index) as  indicators
from fact fact
 left join dim_date dim_date on fact.date=dim_date.date
 where to_char(dim_date.date,'yyyy')='2021'
 group by dim_date.yearmonth
Use this sql Count , Then splice the protocols that return data , Front end rendering to echarts In the line chart component
Such a process , And that's what happened bi Low code development of reports .
Ideal vs reality , Stepping on pits and thinking in practice
1, The pain of being downstream
Offline data warehouse cannot record all operations and operation results of business system , Data synchronization can only be periodic snapshots of synchronized data . If the business system appears similar ABA This kind of problem , The diffusion of this situation in the business system will lead to the logical inconsistency of data in the data application . And the investigation process is unbearable , In the end, they often help find out the hidden business system bug. Therefore, the perfection and robustness of business system is often the key factor for the success of data warehouse .
2,olap Database selection
Before the selection of the company database postgres, Known as the most advanced open source database . Since I joined vipshop mysql Comparison of , You can still feel postgres Strong in some aspects of performance . On some small projects ,pg Can be flattened etl Work and olap analysis . But there's a lot of data , Reuse pg It's just that the little horse pulled the cart a little reluctantly . And we often encounter a scenario in business , It is the year-on-year comparison of the calculation indicators . It is difficult to deal with the above multidimensional model and report engine directly , such as , The data synchronized by the business system has this year's data in some dimensions, but there is no last year's data , This kind of data is missing, and the report display often cannot be self consistent . In this case, if you don't manually push the stored procedure to produce a report, you can only etl The phase expands all dimension values first with Cartesian product , And then it corresponds to update Corresponding indicators , It will lead to the terrible expansion of the table data , A report can't be printed in a few minutes . But if you split the model into several , It also loses the significance of unified modeling . This has always been a thorny problem .
3, Report engine capability boundary and thinking without code
Roast before that the platform report engine is becoming more and more complex , The complexity and mental burden of using report engine drag and drop method to match a usable report is no less than that of using it directly sql Roll yourself up , The boss said that the report engine is not just to simplify the development process , It also helps precipitate the business model . I have discussed with my friends a long time ago , If the codeless platform wants to be all inclusive, the final result can only be to come up with another set of Turing complete language . So I have a thought , If only the business is precipitated in the static multidimensional model , The interaction process is entrusted to a general report engine , I don't think we can cope with customers' tricky changing needs and mental burden significantly lower than handwriting sql Have both . As a platform developer , Recognize your boundaries and carefully explore what you can do in specific areas , It's a huge challenge .
边栏推荐
- Sqli-labs customs clearance (less2-less5)
- DNS攻击详解
- Oracle 11.2.0.3 handles the problem of continuous growth of sysaux table space without downtime
- Error in running test pyspark in idea2020
- Sqli Labs clearance summary - page 2
- 2021-07-05c /cad secondary development create arc (4)
- User login function: simple but difficult
- JSP智能小区物业管理系统
- MySQL中的正则表达式
- Write a thread pool by hand, and take you to learn the implementation principle of ThreadPoolExecutor thread pool
猜你喜欢


随机推荐
Oracle EBS数据库监控-Zabbix+zabbix-agent2+orabbix
Sqli labs customs clearance summary-page2
2021-07-19C#CAD二次开发创建多线段
php中树形结构转数组(拉平树结构,保留上下级排序)
ORACLE 11G SYSAUX表空间满处理及move和shrink区别
使用 Compose 实现可见 ScrollBar
Go common compilation fails
view的绘制机制(一)
ORACLE APEX 21.2安装及一键部署
ORACLE APEX 21.2安裝及一鍵部署
MySQL中的正则表达式
oracle apex ajax process + dy 校验
view的绘制机制(三)
PM2 simple use and daemon
Oracle EBS DataGuard setup
Sqli labs customs clearance summary-page4
ARP attack
Wechat applet Foundation
oracle-外币记账时总账余额表gl_balance变化(上)
sqli-labs通关汇总-page2