当前位置:网站首页>The most complete tcpdump and Wireshark packet capturing practice in the whole network
The most complete tcpdump and Wireshark packet capturing practice in the whole network
2022-07-06 17:32:00 【Tang Monk riding white horse】
tcpdump and Wireshark Practice of bag grabbing
- 1、wireshark Basic use
- 1.1、 How to capture messages
- 1.2、Wireshark panel
- 1.3、 Shortcut toolbar
- 1.5、 Set the time display format
- 1.6、 The tag symbol of the packet list panel
- 1.7、 File operations
- 1.9、 There are several common types of packet capturing files
- 1.10、 analysis https message ,TSL message
- 1.11、wireshark Expert Information Detailed information
- 1.12、wireshark Common filters
- 1.13、 Set the raw serial number
- 1.14、TTL Detailed explanation
- 1.15、 Repeat the confirmation (DupAck)
- 1.16、Flow Graph
- 1.17、I/O Graph
- 1.18、TCP Stream Graphs
- 2、 How to grab messages ?
- 3、 How to read the packet capture file ?
- 4、 How to filter messages ?
- 5、 How to transfer after filtering ?
- 6、 How to make the capture time as long as possible ?
- 7、 How to know which end of the packet capture file is captured ?
- 8、 How to locate the request and returned message of the application layer ?
- 9、 Is packet disorder bound to cause problems ?
1、wireshark Basic use
1.1、 How to capture messages
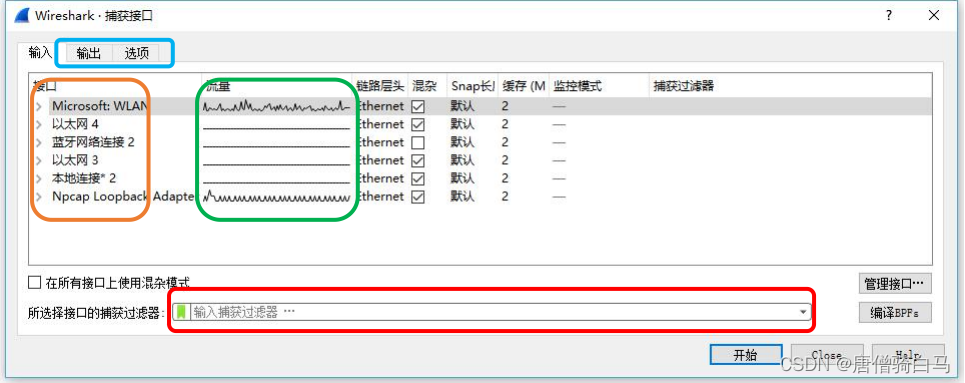
- Click capture ——> Options , Open capture window
- Network card device / Traffic / Capture filter , Click on “ Start ” Button to grab the bag
- Output ( Specify cache file )/ Options ( Show 、 Name resolution 、 Automatically stop packet capturing conditions ) panel
- Click capture ——> stop it , Stop grabbing
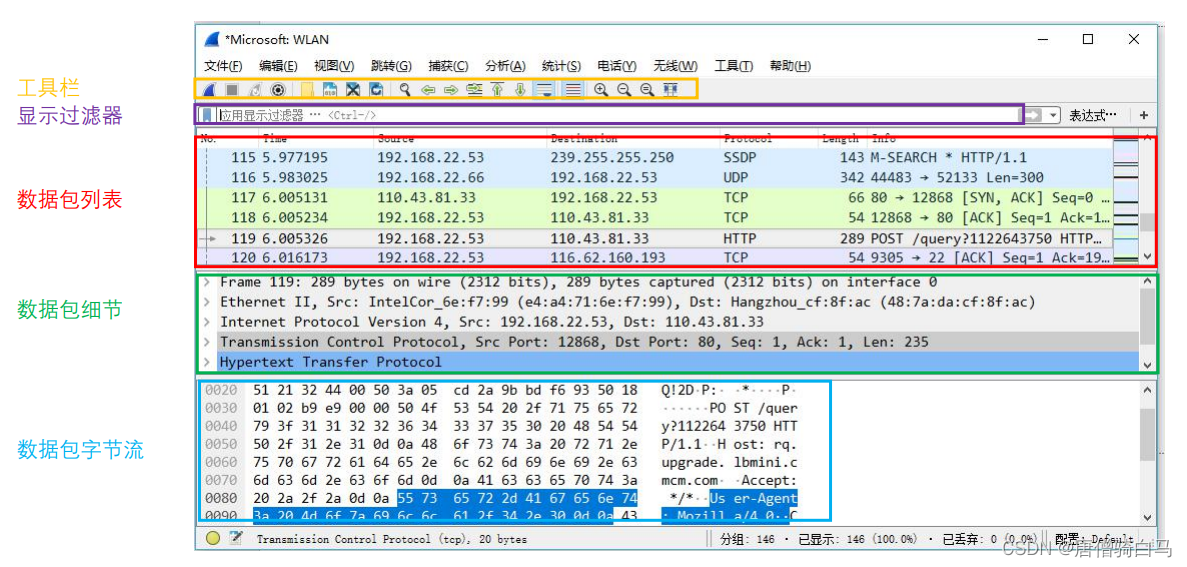
1.2、Wireshark panel
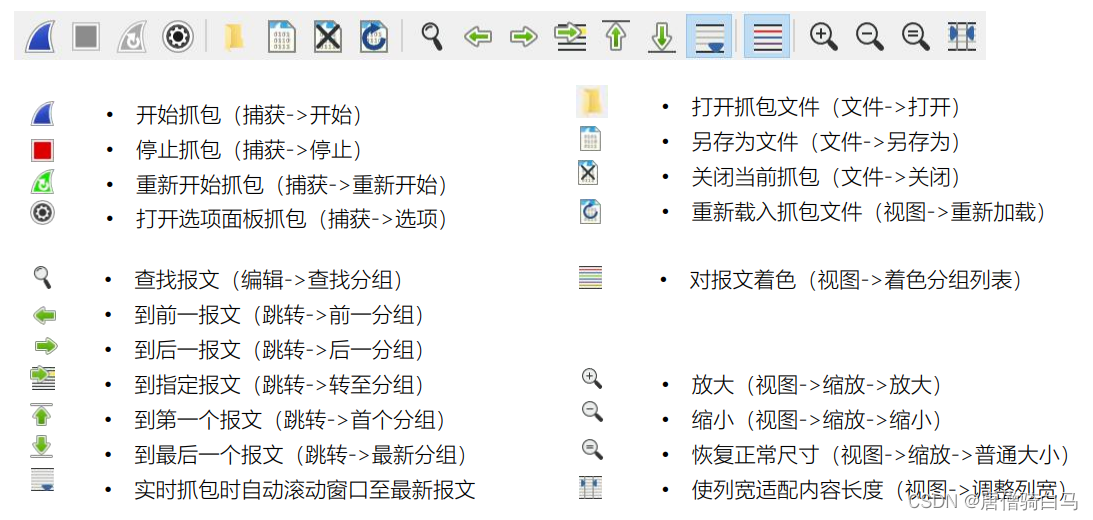
1.3、 Shortcut toolbar
##1.4、 The color of the packet ( View -> Shading rules )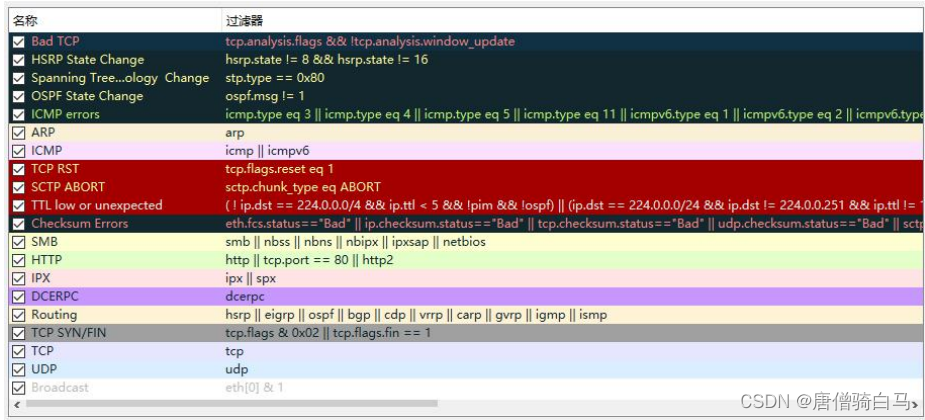
1.5、 Set the time display format
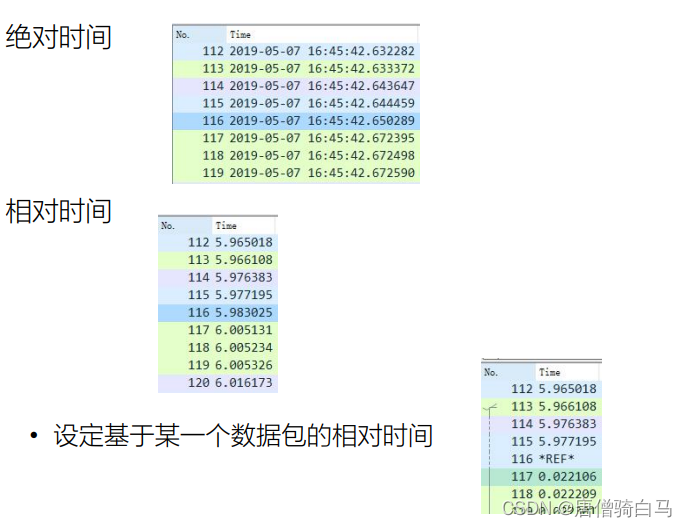
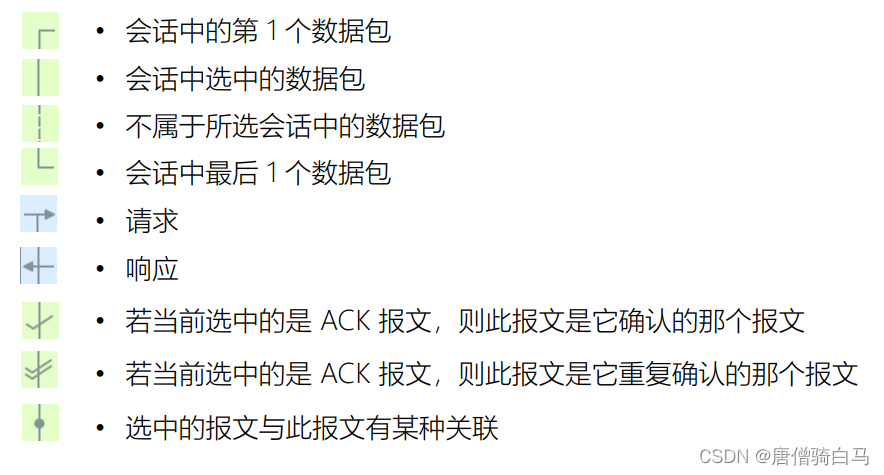
1.6、 The tag symbol of the packet list panel
1.7、 File operations
- Mark message Ctrl+M
- Export tag message ( file -> Export specific groups ), You can also export messages by filter
- Read multiple messages together ( file -> Merge )
##1.8、 How to quickly grab messages from mobile devices ?
- Open on the operating system wifi hotspot
- Mobile connection wifi hotspot
- use Wireshark Turn on capture ——> Options panel , choice wifi The interface device corresponding to the hotspot captures packets
1.9、 There are several common types of packet capturing files
- pcap
This is libpcap The format of , It's also tcpdump and Wireshark And other default file formats supported by tools .pcap In addition to the message data in the format file , It also contains the meta information of the packet capture file , Such as version number 、 Capture time 、 The maximum length of each message to be captured , wait .
- capcap
The file may contain some libpcap Data formats outside the standard , It's made up of some tcpdump Generated by other packet capturing programs . such as Citrix The company's netscaler Load Balancer , its nstrace Command generated packet capture file , That is to say .cap For extension . In addition to including pcap Beyond the information defined in the standard , It also contains LB Between the front-end connection and the back-end connection mapping Information .Wireshark Yes, you can read these .cap Of documents , As long as on the correct version .
- pcapng
pcap Although the format meets most requirements , But it also has some shortcomings . such as , Now the situation of multiple network ports has become more and more common , We also often need to grab messages from multiple network interfaces , Then in the packet capture file , If these messages are not clearly displayed with the information of the network port they belong to , Then our analysis , Don't you want to wear hats ?
To make up for it pcap Insufficient format , People need a new file format ,pcapng And that's what happened . With it , A single packet capture file can contain multiple network interfaces , The captured message .
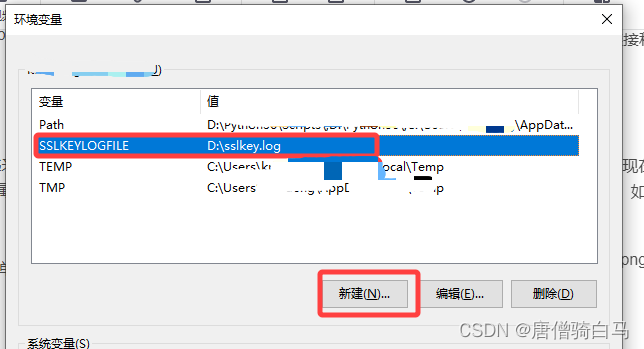
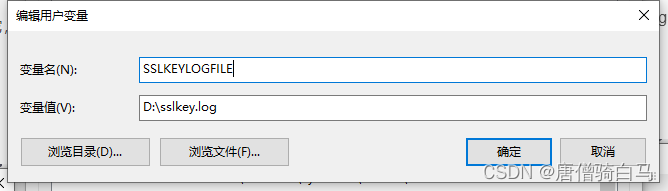
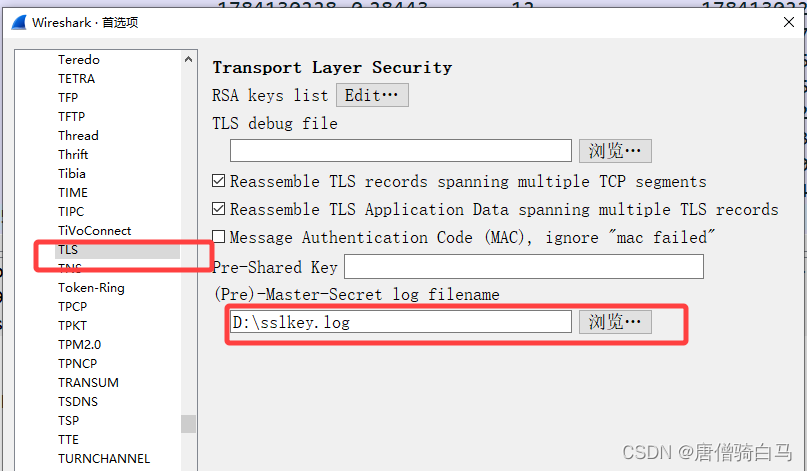
1.10、 analysis https message ,TSL message
Create a new one in the user environment variable SSLKEYLOGFILE Variable , Then fill in a log file
Restart browser , open wireshark, edit ——> Preferences ——>Protocols——>TLS, Fill in the file path written in the environment variable , Then reopen wireshark You can generate the file in the environment variable ( There is no need to create this file , open wireshark It will generate automatically )
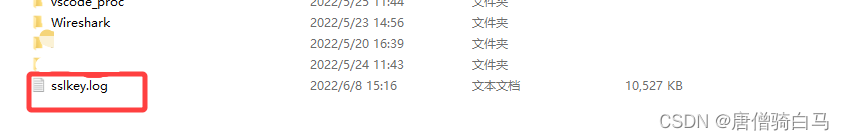
Automatically generated files
1.11、wireshark Expert Information Detailed information
- Warning The bottom color of the entry is yellow , It means there may be a problem , Focus on .
- Note The background color of the entry is light blue , It's a small problem within the allowable range , Also pay attention to . What do you mean “ Small problems within the allowable range ” Well ? for instance ,TCP It allows retransmission to a certain extent , So these retransmission messages , Belong to “ Within the allowable range ”.
- Chat The background color of the entry is normal blue , Belong to TCP/UDP The normal behavior of , As a reference . For example, you can learn that , In this communication TCP How many times do you shake hands and wave hands , wait .
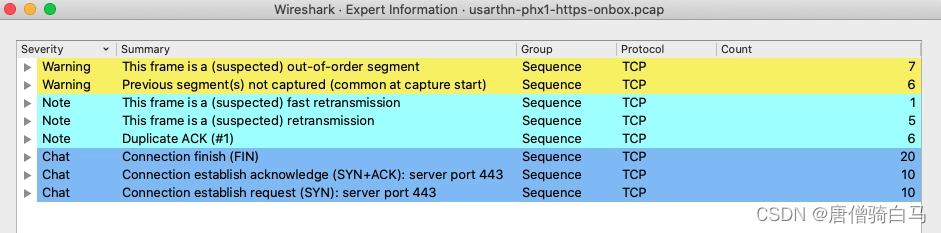
The above figure shows the situation of the client capturing files , Let's interpret these three different levels one by one Severity( Severity level ). - Warning: Yes 7 It's a disorder (Out-of-Order) Of TCP message ,6 Missed messages ( If it is at the beginning of packet capturing , This situation of not catching messages is also normal ).
- Note: Yes 1 One suspicion is rapid retransmission ,5 One is retransmission ( Generally, it is time-out retransmission ),6 Double check .
- Chat: Yes TCP Waving stage 20 individual FIN package , Handshake stage 10 individual SYN Bao He 10 individual SYN+ACK package .
1.12、wireshark Common filters
ip.addr eq my_ip: Filter out source IP Or purpose IP by my_ip Message of
ip.src eq my_ip: Filter out source IP by my_ip Message of
ip.dst eq my_ip: Filter out the purpose IP by my_ip Message of
tcp.seq eq 1 and tcp.ack eq 1 RST  The serial number of is  1, The confirmation number is also  1
frame.time >="dec 01, 2015 15:49:48" and frame.time <="dec 01, 2015 15:49:49" #frame.time  filter
frame.time >="dec 01, 2015 15:49:48" and frame.time <="dec 01, 2015 15:49:49" and ip.addr eq 10.255.252.31 and tcp.flags.reset eq 1 and !(tcp.seq eq 1 or tcp.ack eq 1)
#  about  RST  message , The filter condition is
tcp.flags.reset eq 1
ip.addr eq 10.255.252.31 and tcp.flags.reset eq 1
 The following filter , You can find the message containing this string :
tcp contains "id=abcdafeafeagfeagfaraera1242dfea"
frame contains "id=abcdafeafeagfeagfaraera1242dfea"
ip contains "id=abcdafeafeagfeagfaraera1242dfea"
http contains "id=abcdafeafeagfeagfaraera1242dfea"
tcp.len eq  length
tcp.flags.fin eq 1
tcp.flags.reset eq 1
tcp.payload eq  data
 Use the  contains  Use verbs to write filters . such as :
#  The application layer can be  http contains "abc"
#  The transport layer can be  tcp contains "abc"
#  The network layer can be  ip contains "abc"
#  The data link layer can be  frame contains "abc"
1.13、 Set the raw serial number
open wireshark, edit ——> Preferences ——>Protocols——>tcp, hold “Relative sequence numbers” Remove the front tick , You can display the bare serial number :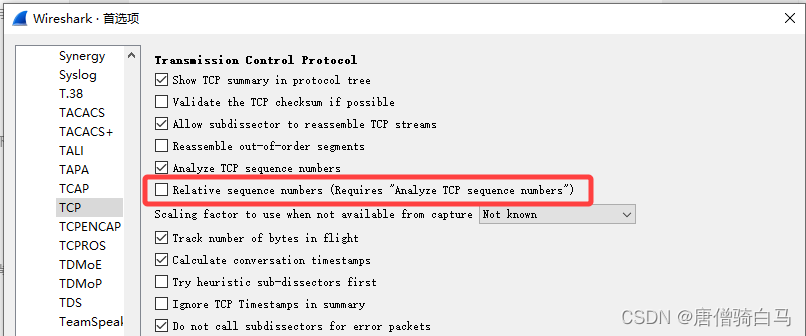
use TCP Confirmation no. , For example, the following filter :
tcp.ack_raw == 754313633
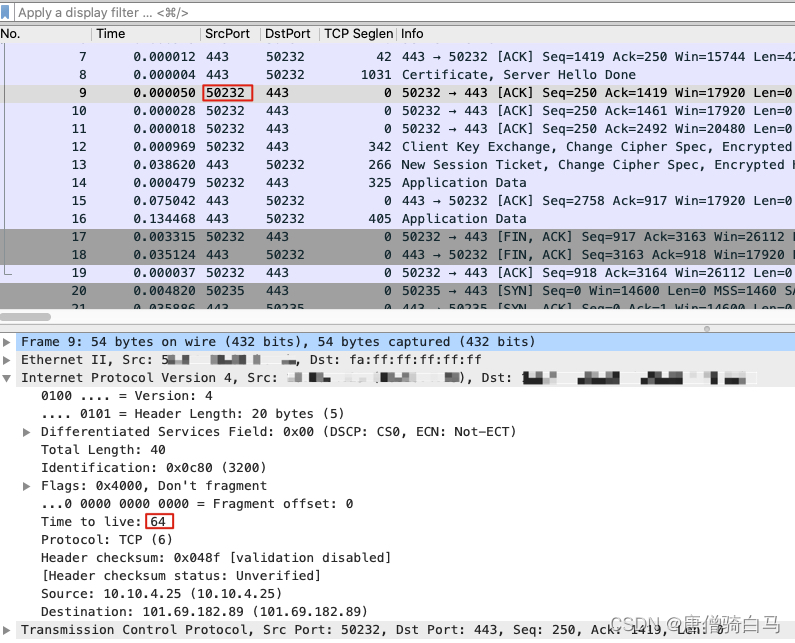
1.14、TTL Detailed explanation
TTL yes IP package ( The network layer ) A property of , Literally, it means almost the length of life , Every equipment on the third floor will put the passing IP Bag TTL Value minus 1. and IP The destination of the bag , It's just the following :
- The network package finally reaches its destination ;
- Enter the routing black hole and be discarded ;
- It was discarded halfway because of network equipment problems ;
- Continue to be forwarded by the route and TTL reduce 1, until TTL by 0 And be discarded .
Different operating systems have their initial TTL Values are different , Generally speaking Windows yes 128,Linux yes 64. thus , We can make some quick judgments .
If Baidu server is Windows, that Windows Class system is generally TTL by 128, subtract 52, obtain 76. That means that this return package actually goes through 76 Three layers of equipment , This is obviously against common sense , So the counter evidence of this Baidu server will not be Windows. This is the first point I want to say :TTL The value of reflects the number of network path hops , It can also be used to indirectly deduce the opposite OS type .
Second point : Messages in the same connection of the intranet , Its TTL Values generally do not change .
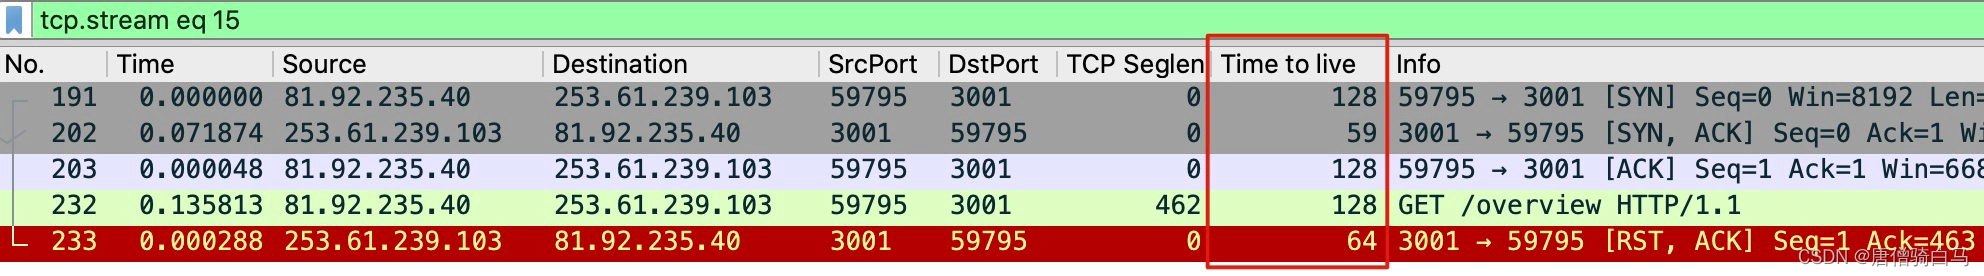
You can also see clearly , The same server , In three handshakes (SYN+ACK message ) Of TTL yes 59, When the connection is interrupted RST The bag turned into 64! obviously , This RST The package was not sent by the server that shook hands with us , otherwise TTL The value doesn't change . Who will send this package ?
Actually , Generally, it is firewall equipment . Because the firewall also follows IP agreement , And here it is TTL The value is 64, This shows that there is no other three-tier link between the firewall and the client , Or three floors directly connected .
1.15、 Repeat the confirmation (DupAck)
Repeat confirmation on TCP It has very important value , The appearance of it , Generally, it means that there is packet loss in transmission 、 Disorderly order, etc . Let's take a look at the details of these two double acknowledgement messages .
1.16、Flow Graph
You can find it like this : It opens at Statistics menu , Find... In the drop-down menu Flow Graph, Click on it , You can see this packet capture file “ Two dimensional diagram ” 了 . however , Because what we want to see is filtered TCP flow , and Flow Graph Only all messages in the packet capture file will be displayed , therefore , We need to do this : First filter out the message , Save as a new packet capture file ; Then open the new file , Check it again Flow Graph.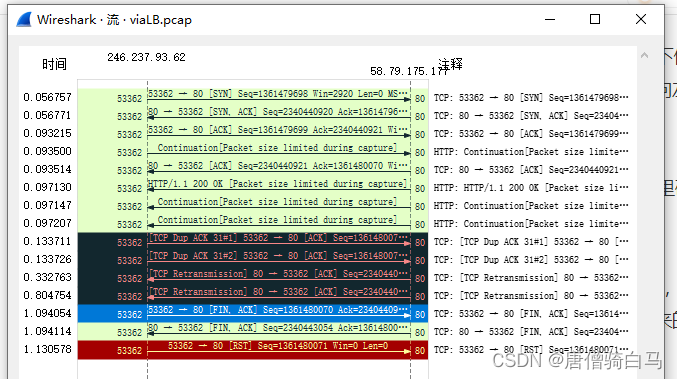
The picture above reads , Does it feel that the amount of information is more than the main interface ? Especially with the left and right arrows , For our brain to form “ The second dimension ”, The flow direction of the message can be seen directly , Instead of looking at ports or IP To derive the flow direction .
1.17、I/O Graph
This tool is in Statistics Drop down menu ,I/O Graph
Click on I/O Graph after ,Wireshark A trend chart will pop up , Its X Axis is time ,Y The shaft is the performance index :
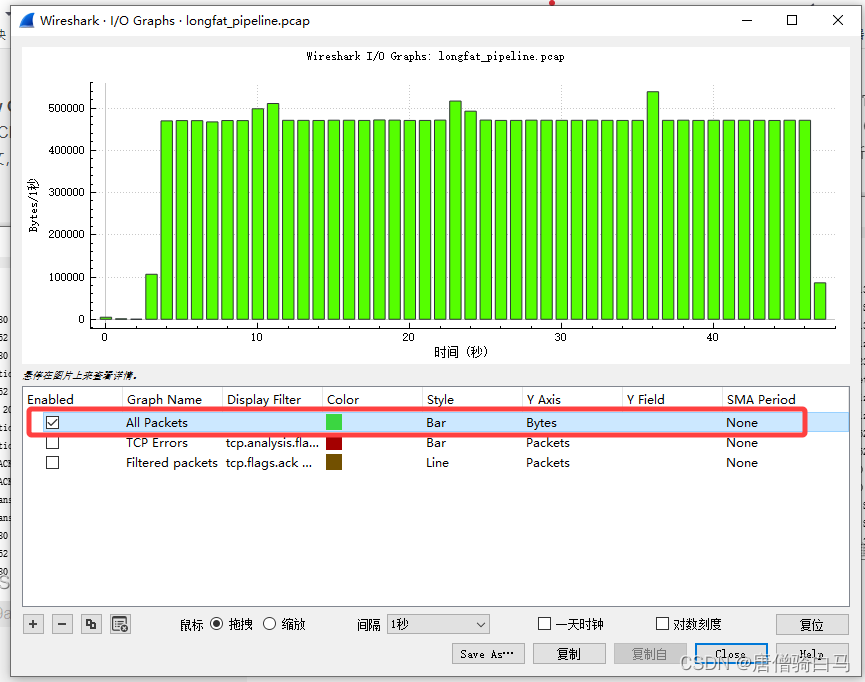
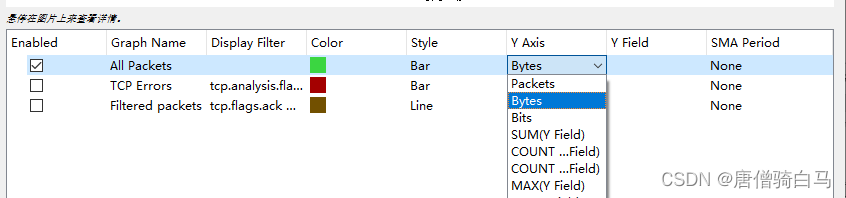
Be careful , The diagram at this time is inaccurate , So we need to make some adjustments . Since we are concerned about transmission speed , So choose All Bytes This indicator item ( It is also the one selected by default ) As Y Axis , Then modify its UOM . It's very likely that your Wireshark The default is AVG(Y Field), This is not the number of bytes we should focus on . We can double-click AVG(Y Field) Enter edit mode , Changed it to Bytes:
You may have noticed , stay X On the timeline , The speed is relatively low in the first few seconds , The first 7 Seconds before reaching 400KB/s above . Why was the speed so low at the beginning ? Actually , That's exactly what it is. TCP A microcosm of slow start : Initial stage , The speed is particularly low , But it will climb quickly .
1.18、TCP Stream Graphs
Or to Statics The drop-down menu , choice TCP Stream Graphs, Select... From the submenu Time sequence (Stevens).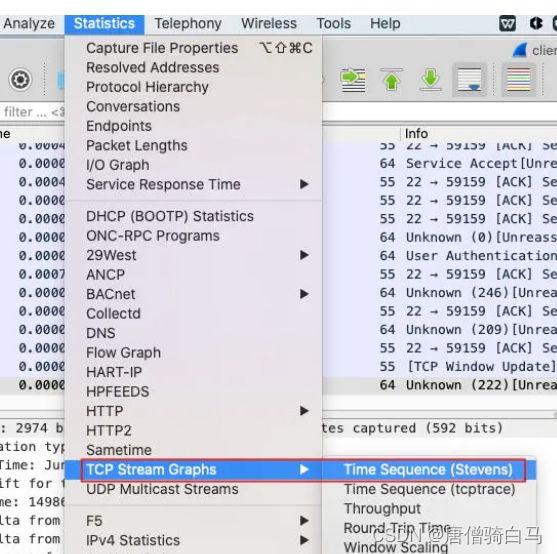
Then you can see that the time is X Axis 、TCP Serial number for Y The diagram of the shaft . You should know , The serial number is actually equal to the number of bytes , So clearly , Here, the slope of this line is the transmission rate .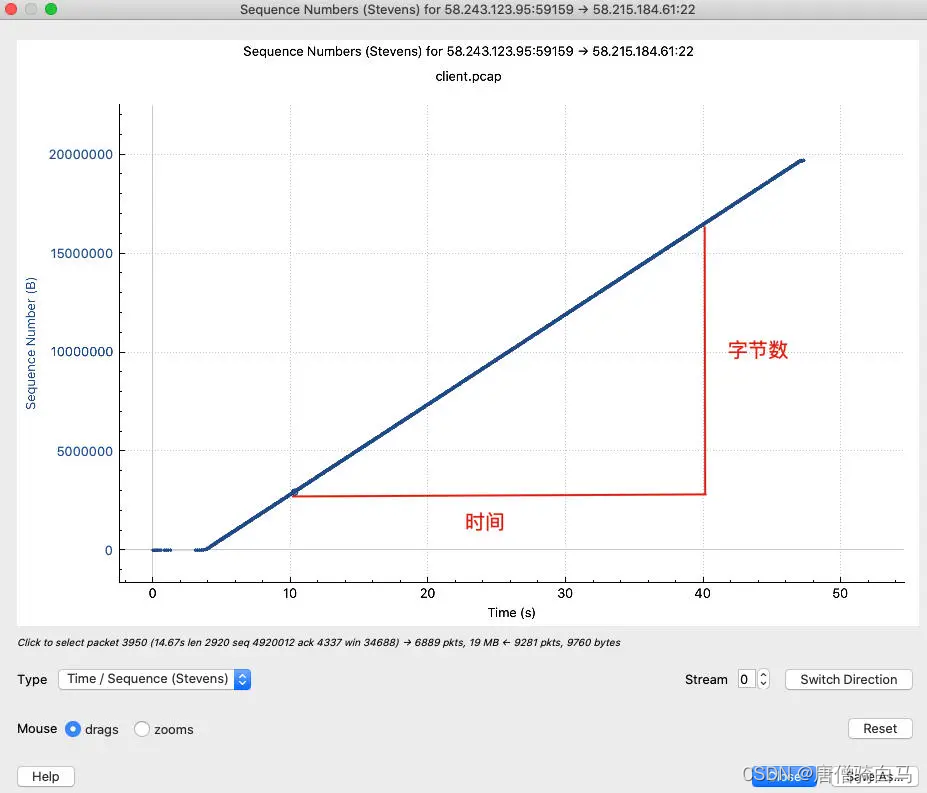
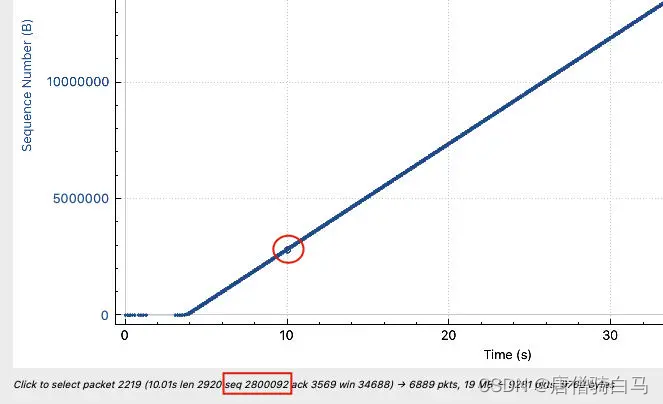
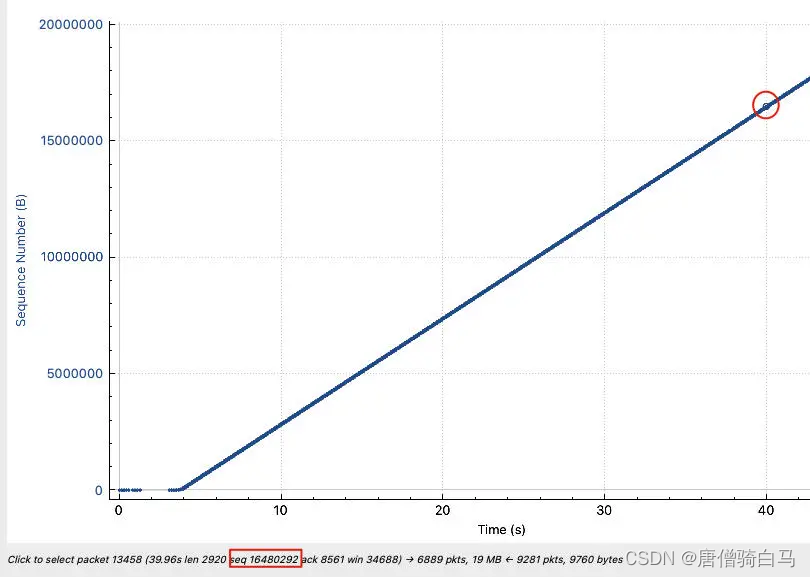
We can calculate this slope by ourselves ( rate ) How much is the . For example, we can calculate 10 The second and 40 The difference between the serial number at two seconds , Divided by (40-10) second , It's speed .10 The serial number at second is 2800092,40 Second is 16480292, So the rate is (16480292-2800092)/(40-10)=456KB/s.
You may have found , Two Graph The calculated speed is a little different ? One is 480KB/s about , One is 456KB/s, There is a difference 5% about .
Actually , This is normal . because I/O Graph The statistical Bytes Is the size of the second layer frame , and TCP Stream Graphs Focus on the fourth floor TCP The size of the segment . The latter has two to four layers of head less than the former . Strictly speaking ,TCP Stream Graphs The slope of , It's just TCP payload Rate ; and I/O Graph Displayed , That's the transmission speed we usually talk about . Of course , In qualitative discussion , This difference can be ignored
2、 How to grab messages ?
use tcpdump Grab message , The most common scenario is to grab something ip, Or from some ip The flow over here . We can use host { Opposite end IP} As a filter condition for capturing packets , such as :
tcpdump host 10.10.10.10
Another common scenario is to grab the traffic of a port , such as , We want to grab SSH Of traffic , Then it can be like this :
tcpdump port 22
There are also many parameters that we often use , such as :
-w file name , The message can be saved to a file ;
-i, Specify the packet capturing network card
-r, Read the packet capture file
c Number , A fixed number of messages can be retrieved , This is when the flow is high , It can avoid grabbing too many messages accidentally ;
-s length , You can only grab a certain length of each message , I will introduce the relevant usage scenarios later ;
-n, No address translation ( such as IP Address to hostname ,port 80 Convert to http);
-v/-vv/-vvv, More detailed message information can be printed ;
-e, You can print second level information , especially MAC Address ;
-p, Turn off hybrid mode . The so-called hybrid model , That is, sniffing (Sniffering), That is to grab the network message whose destination address is not the local address .
-X, Sometimes you want to see TCP The specific content of the message , For example, application layer data , So you can use -X This parameter , With ASCII Code to show TCP The data in it
$ sudo tcpdump port 80 -X
......
05:06:57.394573 IP _gateway.52317 > victorebpf.http: Flags [P.], seq 1:17, ack 1, win 65535, length 16: HTTP: GET / HTTP/1.1
  0x0000:  4500 0038 282d 0000 4006 3a83 0a00 0202  E..8(-..@.:.....
  0x0010:  0a00 020f cc5d 0050 0502 3a02 3ed1 3771  .....].P..:.>.7q
  0x0020:  5018 ffff 4421 0000 4745 5420 2f20 4854  P...D!..GET./.HT
  0x0030:  5450 2f31 2e31 0d0a                      TP/1.1..
Reading the packet capture file can also be used -X Parameters
[[email protected] ~]# tcpdump -r 1201.pcap -X
reading from file 1201.pcap, link-type EN10MB (Ethernet)
03:19:38.035436 IP localhost.localdomain.http > 192.168.192.120.47958: Flags [R.], seq 0, ack 3193167715, win 0, length 0
	0x0000:  4510 0028 0000 4000 4006 3888 c0a8 c06e  E..(..@[email protected]....n
	0x0010:  c0a8 c078 0050 bb56 0000 0000 be53 df63  ...x.P.V.....S.c
	0x0020:  5014 0000 543a 0000                      P...T:..
03:19:38.998385 IP localhost.localdomain.http > 192.168.192.120.47962: Flags [R.], seq 0, ack 4061809141, win 0, length 0
	0x0000:  4510 0028 0000 4000 4006 3888 c0a8 c06e  E..(..@[email protected]....n
	0x0010:  c0a8 c078 0050 bb5a 0000 0000 f21a 49f5  ...x.P.Z......I.
	0x0020:  5014 0000 b5dd 0000                      P.......
3、 How to read the packet capture file ?
tcpdump add -r Parameter and file name , You can read this file , And filter conditions can also be added . such as :
tcpdump -r file.pcap 'tcp[tcpflags] & (tcp-rst) != 0'
4、 How to filter messages ?
tcp  Tag values have  tcp-fin, tcp-syn, tcp-rst, tcp-push, tcp-push, tcp-ack, tcp-urg
#  Filter out  TCP RST  message
tcpdump -w file.pcap 'tcp[tcpflags]&(tcp-rst) != 0'
#  Write with offset
tcpdump -w file.pcap 'tcp[13]&4 != 0'
5、 How to transfer after filtering ?
occasionally , We want to filter the desired message from the packet capture file , And transfer to another file . For example, I want to find it in a packet capture file TCP RST message , And put these RST Save the message to a new file . Then you can do it :
tcpdump -r file.pcap 'tcp[tcpflags] & (tcp-rst) != 0' -w rst.pcap
6、 How to make the capture time as long as possible ?
I mentioned that earlier -s This length parameter , Its usage scenarios actually include extending the packet capture time . We give tcpdump add -s Parameters , Specify the maximum length of each message captured , Save the size of the packet capture file , It also extends the time of capturing packets .
Generally speaking , The frame header is 14 byte ,IP The head is 20 byte ,TCP The head is 20~40 byte . If you know clearly that the focus of this packet capture is the transport layer , So theoretically , For each message , You just grab the header of the transport layer , Is the former 14+20+40 byte ( The former 74 byte ):
tcpdump -s 74 -w file.pcap
If it is the default crawl 1500 byte , Then the generated packet capturing file will be the above packet capturing file 20 times . On the other hand , Use the same disk space , This way up here , Its packet capturing time can be as long as the default 20 times !
7、 How to know which end of the packet capture file is captured ?
This is an interesting question . Although we are very clear about which end we did the packet capturing , But after passing the document to others , The other party may not know this , Even we were confused for a while : The last time I captured the package file, it was on the client , It's also captured on the server ?
It's also easy to figure this out , We can use IP Of TTL attribute . obviously , Either way , When its message is sent , Its TTL Is the original value , That is to say 64、128、255 One of them . And the end-to-end message TTL, Because it will go through several network hops , So it's usually better than 64、128、255 These values are smaller .
therefore , We just need to look at any client message in the packet capture file ( That is, the source port is a high port ) Of TTL, If it is 64、128 or 255, That shows that the packet capture file is done on the client . conversely , It's done on the server side .
8、 How to locate the request and returned message of the application layer ?
Find the application layer request and corresponding response message in many messages , It's tedious to do this task manually . not so bad , use Wireshark It's very convenient . stay Wireshark In the interface , We can easily find the requested and returned messages . Such as this :
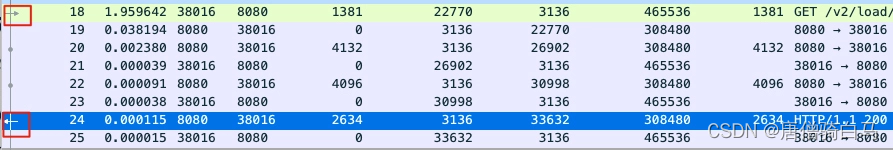
We just need to select the request message ,Wireshark It will automatically help us match the corresponding response message , And vice versa . See from the graph , Application layer requests ( Here is HTTP request ) It's a right arrow , Indicates that the data is the direction of entry ; The application layer response is a left arrow , Indicates that the data is going out .
9、 Is packet disorder bound to cause problems ?
Disorder (Out-of-Order), It's also that we can often be in Wireshark A kind of phenomenon seen in . that , Is disorder bound to cause problems ? There is a saying “ Talking about toxicity without dose is playing rogue ”. Actually , Is disorder a problem , It also depends on the severity of the disorder .
Then the second question comes : To what extent is the disorder package , It will really cause problems ?
This problem , It also has a lot to do with the specific situation of the actual scene , Different operating systems and TCP Implementation details , There may be a big difference . however , I still want to answer this question head-on . My experience is that , If the out of sequence message reaches 10% above , It's a serious transmission quality problem , It may even cause transmission failure , Or various catons in the application layer 、 Reporting errors and other symptoms . therefore , You can count the proportion of out of order packets , If it exceeds 10%, We must pay attention to .
边栏推荐
猜你喜欢
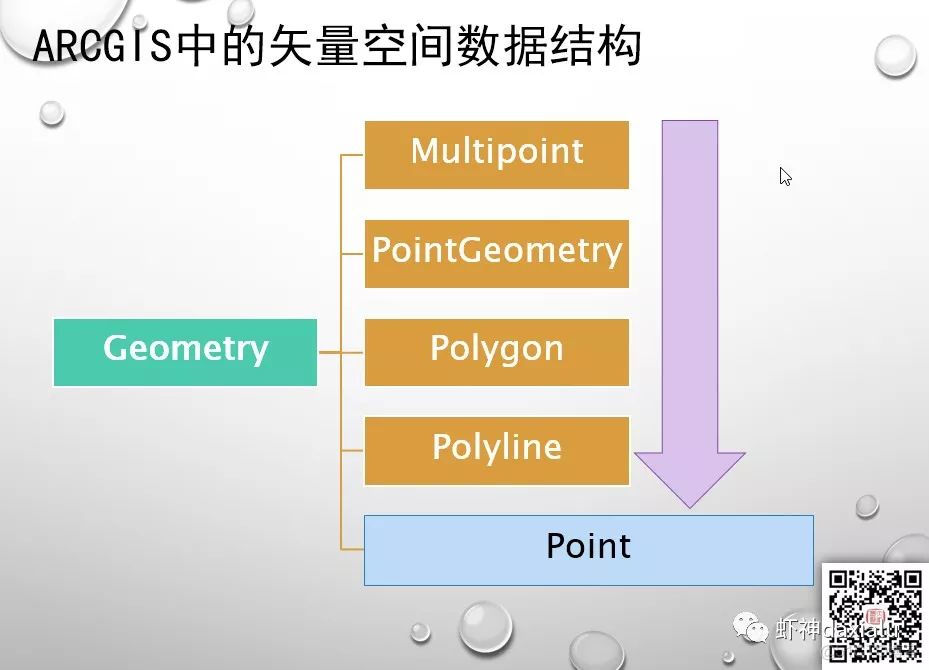
PySpark算子处理空间数据全解析(4): 先说说空间运算
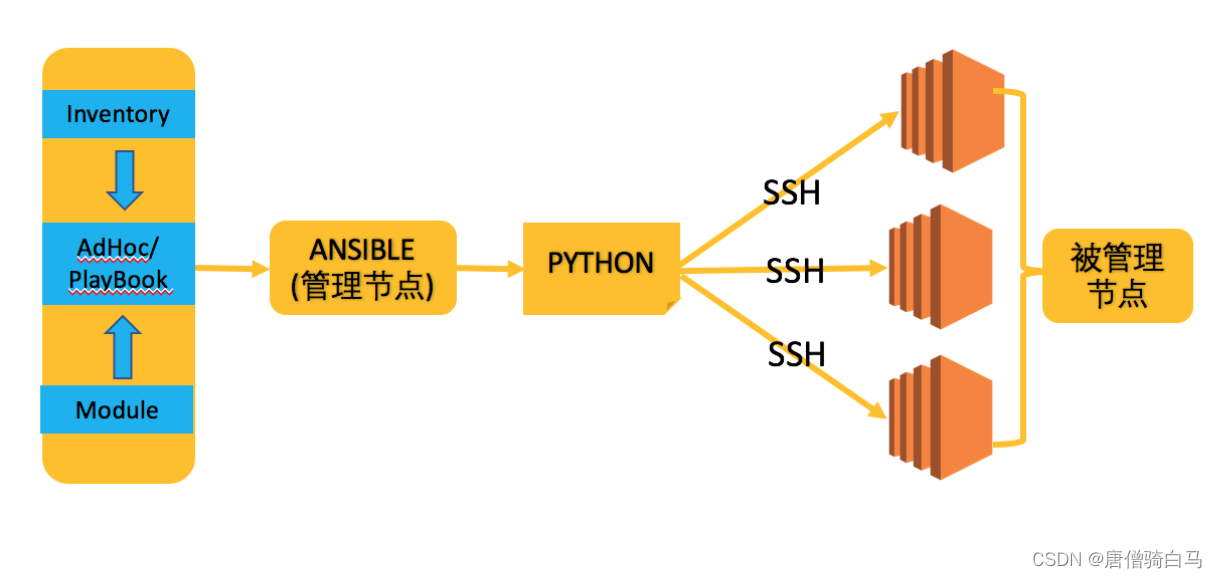
自动化运维利器ansible基础
基于LNMP部署flask项目
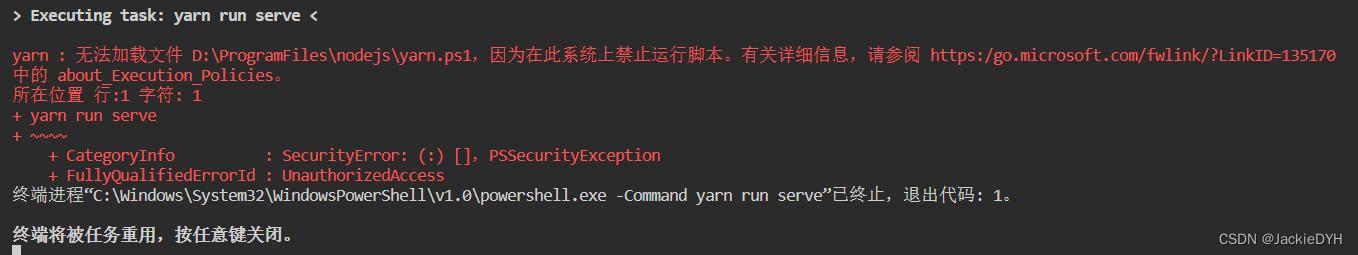
yarn : 无法加载文件 D:\ProgramFiles\nodejs\yarn.ps1,因为在此系统上禁止运行脚本
信息与网络安全期末复习(完整版)

Introduction to spring trick of ByteDance: senior students, senior students, senior students, and the author "brocade bag"
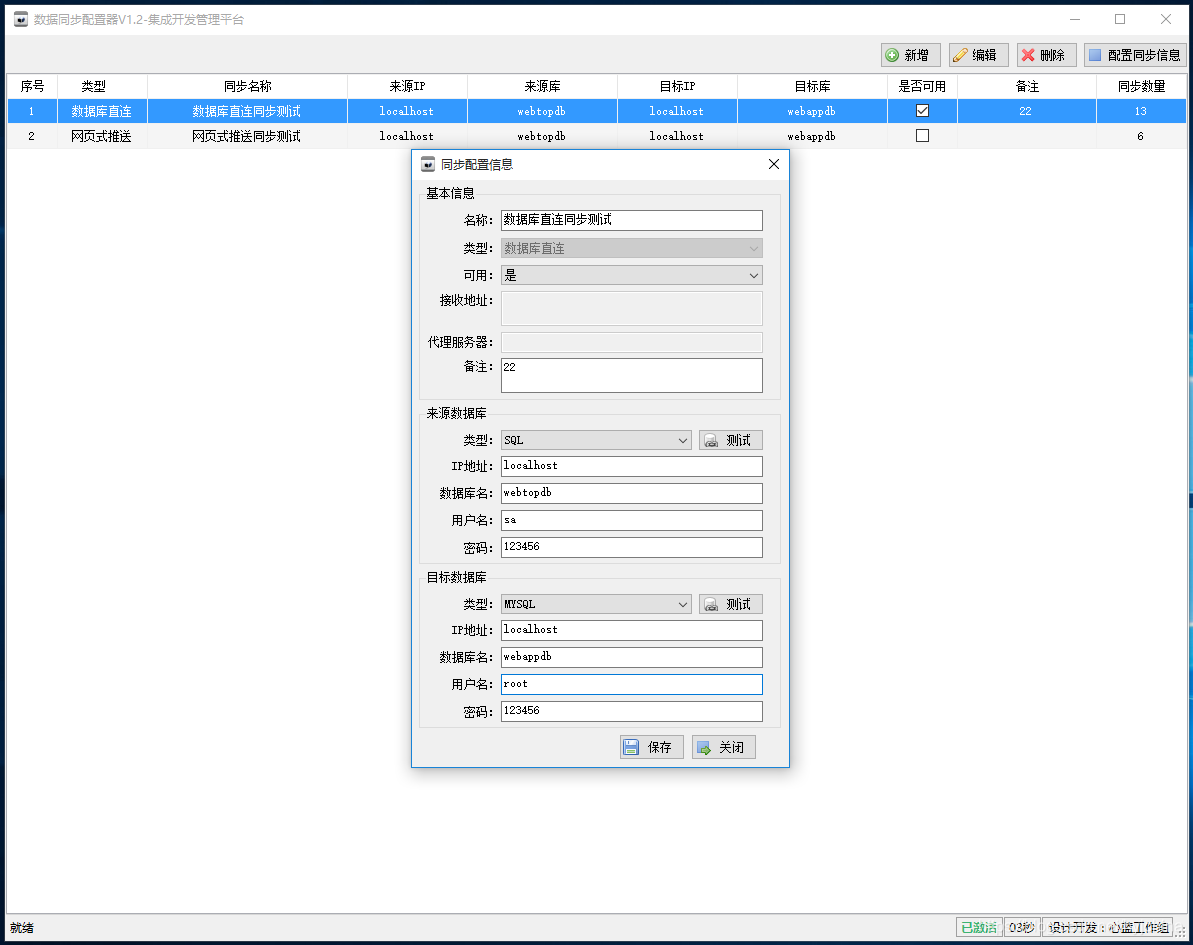
05个人研发的产品及推广-数据同步工具
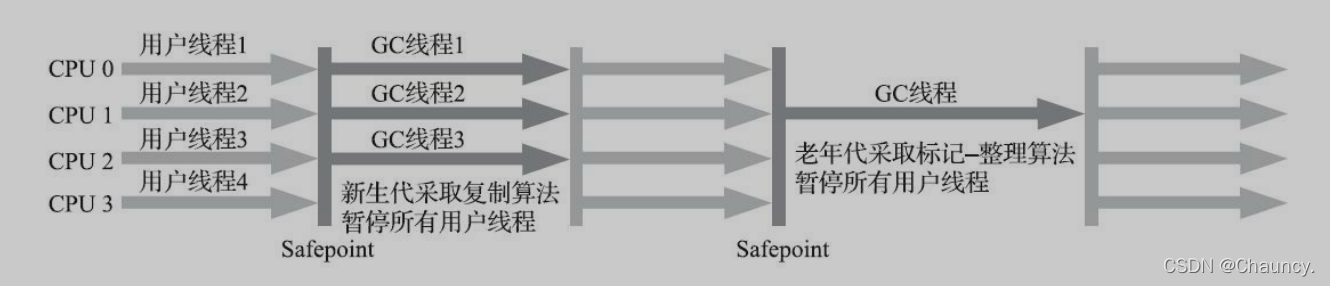
JVM 垃圾回收器之Serial SerialOld ParNew
JVM之垃圾回收器下篇
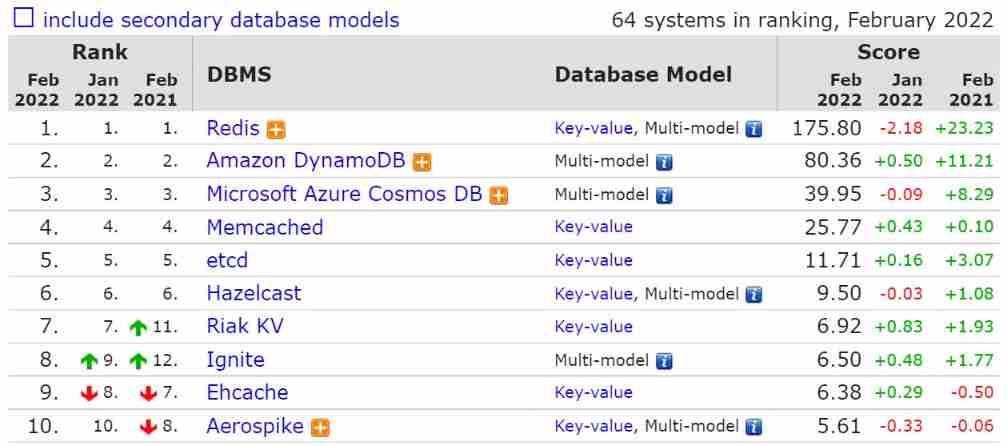
February database ranking: how long can Oracle remain the first?
随机推荐
vscode
02个人研发的产品及推广-短信平台
mysql高級(索引,視圖,存儲過程,函數,修改密碼)
Only learning C can live up to expectations Top1 environment configuration
SQL tuning notes
Application service configurator (regular, database backup, file backup, remote backup)
[mmdetection] solves the installation problem
Program counter of JVM runtime data area
MySQL basic addition, deletion, modification and query of SQL statements
复盘网鼎杯Re-Signal Writeup
Flink 解析(一):基础概念解析
Flink analysis (I): basic concept analysis
Idea breakpoint debugging skills, multiple dynamic diagram package teaching package meeting.
手把手带你做强化学习实验--敲级详细
Take you hand-in-hand to do intensive learning experiments -- knock the level in detail
Flink源码解读(二):JobGraph源码解读
Integrated development management platform
Programmer orientation problem solving methodology
Compile homework after class
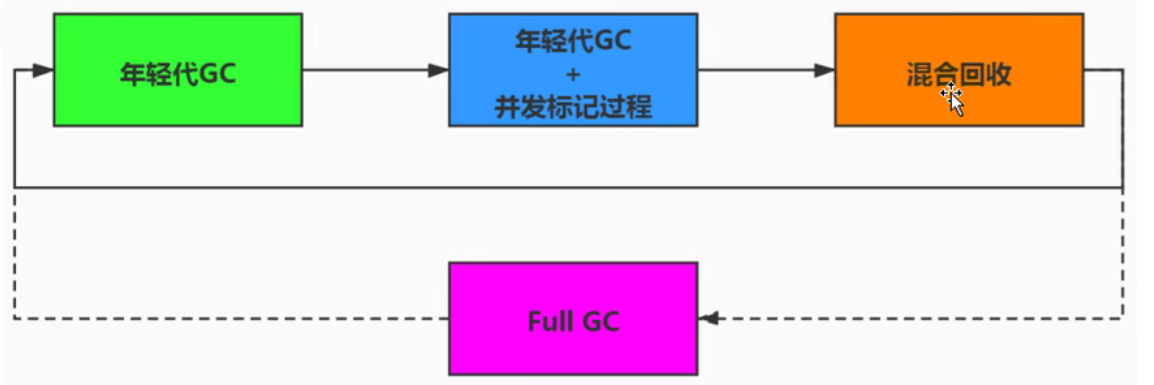
JVM 垃圾回收器之Garbage First