当前位置:网站首页>ELFK部署
ELFK部署
2022-07-05 13:36:00 【[email protected]】
环境准备
| 服务器类型 | 系统和IP地址 | 需要安装的组件 | 硬件方面 |
|---|---|---|---|
| node1节点 | 192.168.16.10 | JDK、elasticsearch-6.7.2 | 2核4G |
| node2节点 | 192.168.16.20 | JDK、elasticsearch-6.7.2 | 2核4G |
| apache节点 | 192.168.16.30 | JDK、apache、logstash-6.7.2、kabana-6.7.2、filebeat-6.7.2 | 2核4G |
所有节点关闭防火墙
systemctl stop firewalld.service
systemctl disable firewalld.service
setenforce 0
1 Elasticsearch 部署(在Node1、Node2节点上操作)
1.安装elasticsearch—rpm包
#上传elasticsearch-6.7.2.rpm到/opt目录下
cd /opt
rpm -ivh elasticsearch-6.7.2.rpm
2.修改elasticsearch主配置文件
cp /etc/elasticsearch/elasticsearch.yml /etc/elasticsearch/elasticsearch.yml.bak
vim /etc/elasticsearch/elasticsearch.yml
--17--取消注释,指定集群名字
cluster.name: my-elk-cluster
--23--取消注释,指定节点名字:Node1节点为node1,Node2节点为node2
node.name: node1
node.master: true		#是否master节点,false为否
node.data: true			#是否数据节点,false为否
--35--取消注释,指定数据存放路径
path.data: /var/lib/elasticsearch
--39--取消注释,指定日志存放路径
path.logs: /var/log/elasticsearch
--45--取消注释,避免es使用swap交换分区
bootstrap.memory_lock: true
--57--取消注释,设置监听地址,0.0.0.0代表所有地址
network.host: 0.0.0.0
--51--取消注释,ES 服务的默认监听端口为9200
http.port: 9200					#指定es集群提供外部访问的接口
transport.tcp.port: 9300		#指定es集群内部通信接口
--71--取消注释,集群发现通过单播实现,指定要发现的节点
discovery.zen.ping.unicast.hosts: ["192.168.16.10:9300", "192.168.2.11:9300"]

grep -v "^#" /etc/elasticsearch/elasticsearch.yml
es 性能调优参数
3.优化最大内存大小和最大文件描述符的数量
vim /etc/security/limits.conf
......

*  soft    nofile          65536
*  hard    nofile          131072
*  soft    memlock         unlimited
*  hard    memlock         unlimited
systemctl daemon-reexec

vim /etc/sysctl.conf
#一个进程可以拥有的最大内存映射区域数,参考数据(分配 2g/262144,4g/4194304,8g/8388608)
vm.max_map_count=262144

sysctl -p
sysctl -a | grep vm.max_map_count
4.启动elasticsearch是否成功开启
systemctl start elasticsearch
systemctl enable elasticsearch
netstat -antp | grep 9200
5.查看节点信息
浏览器访问 http://192.168.16.10:9200 、 http://192.168.16.20:9200 查看节点 Node1、Node2 的信息。

浏览器访问 http://192.168.16.10:9200/_cluster/state?prettyhttp://192.168.239.10:9200http://192.168.239.10:9200/_cluster/state?pretty 检查群集状态信息。
2 Logstash 部署(在 Apache 节点上操作)
1.安装Apahce服务(httpd)、安装Java环境、安装logstash、安装 Kiabana
#安装Apahce服务(httpd)
yum -y install httpd
systemctl start httpd

#安装Java环境
yum -y install java
java -version

#安装logstash
#上传软件包 logstash-6.7.2.rpm 到/opt目录下
cd /opt
rpm -ivh logstash-6.7.2.rpm
systemctl start logstash.service
systemctl enable logstash.service

ln -s /usr/share/logstash/bin/logstash /usr/local/bin/

#安装 Kiabana
#上传软件包 kibana-6.7.2-x86_64.rpm 到/opt目录
cd /opt
rpm -ivh kibana-6.7.2-x86_64.rpm
2.设置 Kibana 的主配置文件
vim /etc/kibana/kibana.yml

--2--取消注释,Kiabana 服务的默认监听端口为5601
server.port: 5601
--7--取消注释,设置 Kiabana 的监听地址,0.0.0.0代表所有地址
server.host: "0.0.0.0"
--28--取消注释,配置es服务器的ip,如果是集群则配置该集群中master节点的ip
elasticsearch.url:  ["http://192.168.16.10:9200","http://192.168.16.20:9200"]
--37--取消注释,设置在 elasticsearch 中添加.kibana索引
kibana.index: ".kibana"
--96--取消注释,配置kibana的日志文件路径(需手动创建),不然默认是messages里记录日志
logging.dest: /var/log/kibana.log
3.创建日志文件,启动 Kibana 服务
touch /var/log/kibana.log
chown kibana:kibana /var/log/kibana.log
systemctl start kibana
systemctl enable kibana
netstat -natp | grep 5601
4.创建索引
将 Apache 服务器的日志(访问的、错误的)添加到 Elasticsearch 并通过 Kibana 显示
vim /etc/logstash/conf.d/apache_log.conf

input {

    file{

        path => "/etc/httpd/logs/access_log"  #指定真确目录位置
        type => "access"
        start_position => "beginning"
    }
    file{

        path => "/etc/httpd/logs/error_log"   #指定错误日志目录
        type => "error"
        start_position => "beginning"
    }
}
output {

    if [type] == "access" {

        elasticsearch {

            hosts => ["192.168.16.10:9200","192.168.16.20:9200"]
            index => "apache_access-%{+YYYY.MM.dd}"
        }
    }
        if [type] == "error" {

        elasticsearch {

            hosts => ["192.168.16.10:9200","192.168.16.20:9200"]
            index => "apache_error-%{+YYYY.MM.dd}"
        }
    }
}
cd /etc/logstash/conf.d/
logstash -f apache_log.conf
此时浏览器访问http://192.168.16.30添加访问日志

浏览器访问 http://192.168.16.10:5601/登录 Kibana创建索引
3 Filebeat+ELK 部署
在 apache 节点上操作
1.安装 Filebeat
#上传软件包 filebeat-6.7.2-linux-x86_64.tar.gz 到/opt目录
tar zxvf filebeat-6.7.2-linux-x86_64.tar.gz
mv filebeat-6.7.2-linux-x86_64/ /usr/local/filebeat
2.设置 filebeat 的主配置文件
vim filebeat.yml

filebeat.prospectors:

- type: log         #指定 log 类型,从日志文件中读取消息
  enabled: true
  paths:
    - /var/log/messages       #指定监控的日志文件
    - /var/log/*.log
      tags: ["sys"]		#设置索引标签
      fields:           #可以使用 fields 配置选项设置一些参数字段添加到 output 中
        service_name: filebeat
        log_type: syslog
        from: 192.168.16.30

--------------Elasticsearch output-------------------
(全部注释掉)

----------------Logstash output---------------------
output.logstash:
  hosts: ["192.168.16.30:5044"]      #指定 logstash 的 IP 和端口

#启动 filebeat
nohup ./filebeat -e -c filebeat.yml > filebeat.out &
#-e:输出到标准输出,禁用syslog/文件输出
#-c:指定配置文件
#nohup:在系统后台不挂断地运行命令,退出终端不会影响程序的运行
3.在 Logstash 组件所在节点上新建一个 Logstash 配置文件
cd /etc/logstash/conf.d

vim filebeat.conf
input {

    beats {

        port => "5044"
    }
}
output {

    elasticsearch {

        hosts => ["192.168.16.10:9200","192.168.16.20:9200"]
        index => "%{[fields][service_name]}-%{+YYYY.MM.dd}"
    }
    stdout {

        codec => rubydebug
    }
}
#启动 logstash
logstash -f filebeat.conf
浏览器访问 http://192.168.16.30:5601 登录 Kibana,单击“Create Index Pattern”按钮添加索引“filebeat-*”,单击 “create” 按钮创建,单击 “Discover” 按钮可查看图表信息及日志信息。
此时再去添加索
4 Filter 插件
而对于 Logstash 的 Filter,这个才是 Logstash 最强大的地方。Filter 插件也非常多,我们常用到的 grok、date、mutate、mutiline 四个插件。
对于 filter 的各个插件执行流程,可以看下面这张图: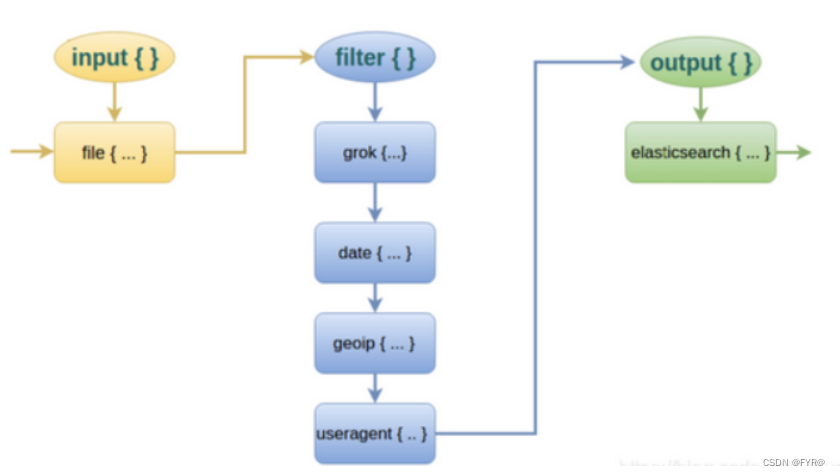
Filter常用插件的作用
grok :对若干个大文本字段进行再分割成一些小字段
date:对数据中的时间格式进行统一和格式化
mutate:对一些无用的字段进行剔除,或添加字段
mutiline :对多行数据进行统一编排,多行拆分
grok 插件
匹配格式:(?<字段名>正则表达式)
这里就要用到 logstash 的 filter 中的 grok 插件。filebeat 发送给 logstash 的日志内容会放到message 字段里面,logstash 匹配这个 message 字段就可以了。配置项如下所示:
示例1
(?<remote_addr>%{
    IPV6}|%{
    IPV4} )(?<other_info>.+)
#对数据进行分割ip字段名为remote_addr, 其他字段名为other_info

示例2
(?<remote_addr>%{
    IPV6}|%{
    IPV4} )[\s\-]+\[(?<log_time>.+)\](?<other_info>.+)
#添加匹配时间字段

示例3
#分割多个字段
(?<remote_addr>%{
    IPV6}|%{
    IPV4})[\s\-]+\[(?<log_time>.+)\]\s+\"(?<http_method>\S+)\s+(?<url-path>.+)\"\s+(?<rev_code>\d+)(?<other_info>.+)

将此正则写入配置文件对数据进行过滤
cd /etc/logstash/conf.d/
cp filebeat.conf filter.conf
vim filter.conf

input {

    beats {

        port => "5044"
    }
}
filter {

  grok {

     match =>["message","(?<remote_addr>%{IPV6}|%{IPV4} )[\s\-]+\[(?<log_time>.+)\]\s+\"(?<http_method>\S+)\s+(?<url-path>.+)\"\s+(?<rev_code>\d+)(?<other_info>.+)"]
  }
}
output {

    elasticsearch {

        hosts => ["192.168.16.10:9200","192.168.16.20:9200"]
        index => "{[filter][service_name]}-%{+YYYY.MM.dd}"
    }
    stdout {

        codec => rubydebug
    }
}
 logstash -f filter.conf#启动
此时在进入kibana查看并添加索引
版权声明
本文为[[email protected]]所创,转载请带上原文链接,感谢
https://blog.csdn.net/FYR1018/article/details/125326746
边栏推荐
- [deep learning paper notes] hnf-netv2 for segmentation of brain tumors using multimodal MR imaging
- redis6数据类型及操作总结
- 【 script secret pour l'utilisation de MySQL 】 un jeu en ligne sur l'heure et le type de date de MySQL et les fonctions d'exploitation connexes (3)
- Notion 类笔记软件如何选择?Notion 、FlowUs 、Wolai 对比评测
- Personal component - message prompt
- 多人合作项目查看每个人写了多少行代码
- 华为推送服务内容,阅读笔记
- CAN和CAN FD
- 通讯录(链表实现)
- 爱可生SQLe审核工具顺利完成信通院‘SQL质量管理平台分级能力’评测
猜你喜欢
FPGA learning notes: vivado 2019.1 add IP MicroBlaze

Summit review | baowanda - an integrated data security protection system driven by compliance and security

Asemi rectifier bridge hd06 parameters, hd06 pictures, hd06 applications
When using Tencent cloud for the first time, you can only use webshell connection instead of SSH connection.
Can and can FD

What happened to the communication industry in the first half of this year?
Idea设置方法注释和类注释
Android本地Sqlite数据库的备份和还原
华为推送服务内容,阅读笔记

一网打尽异步神器CompletableFuture
随机推荐
Shuttle INKWELL & ink components
通讯录(链表实现)
C object storage
49. 字母异位词分组:给你一个字符串数组,请你将 字母异位词 组合在一起。可以按任意顺序返回结果列表。 字母异位词 是由重新排列源单词的字母得到的一个新单词,所有源单词中的字母通常恰好只用一次。
Interviewer soul torture: why does the code specification require SQL statements not to have too many joins?
go 数组与切片
Go pointer
面试官灵魂拷问:为什么代码规范要求 SQL 语句不要过多的 join?
Asemi rectifier bridge hd06 parameters, hd06 pictures, hd06 applications
【Hot100】33. 搜索旋转排序数组
How to apply the updated fluent 3.0 to applet development
百度杯”CTF比赛 2017 二月场,Web:爆破-2
Android本地Sqlite数据库的备份和还原
DataPipeline双料入选中国信通院2022数智化图谱、数据库发展报告
[deep learning paper notes] hnf-netv2 for segmentation of brain tumors using multimodal MR imaging
Notion 类笔记软件如何选择?Notion 、FlowUs 、Wolai 对比评测
Huawei push service content, read notes
"Baidu Cup" CTF competition in September, web:upload
leetcode 10. Regular Expression Matching 正则表达式匹配 (困难)
时钟周期