当前位置:网站首页>疫情数据分析平台工作报告【6.5】疫情地图
疫情数据分析平台工作报告【6.5】疫情地图
2022-06-12 04:09:00 【m0_55675803】
数据结构如下。
我们用第一个csv文件。列信息如下。

导入依赖。
import numpy as np
import pandas as pd
import plotly.graph_objs as go
import plotly.io as pio
pio.renderers.default = "browser"
# Read Data
df = pd.read_csv("dataset/covid_19_data.csv")
# Rename columns
df = df.rename(columns={
    'Country/Region': 'Country'})
df = df.rename(columns={
    'ObservationDate': 'Date'})
# Manipulate Dataframe
df_countries = df.groupby(['Country', 'Date']).sum().reset_index().sort_values('Date', ascending=False)
print(df_countries)
df_countries = df_countries.drop_duplicates(subset=['Country'])
df_countries = df_countries[df_countries['Confirmed'] > 0]
# Create the Choropleth

fig = go.Figure(data=go.Choropleth(
    locations=df_countries['Country'],
    locationmode='country names',
    z=df_countries['Confirmed'],
    colorscale='reds',
    marker_line_color='black',
    marker_line_width=0.5,
))
fig.update_layout(
    title_text='Confirmed Cases as of 2021/5/3',
    title_x=0.5,
    geo=dict(
        showframe=False,
        showcoastlines=False,
        projection_type='equirectangular'
    )
)
fig.show()
第一部分先读取数据
# Read Data
df = pd.read_csv("dataset/covid_19_data.csv")
为列改名,便于操作
df = df.rename(columns={
    'Country/Region': 'Country'})
df = df.rename(columns={
    'ObservationDate': 'Date'})
重排数据并清洗
df_countries = df.groupby(['Country', 'Date']).sum().reset_index().sort_values('Date', ascending=False)
print(df_countries)
df_countries = df_countries.drop_duplicates(subset=['Country'])
df_countries = df_countries[df_countries['Confirmed'] > 0]
# Create the Choropleth
画图
fig = go.Figure(data=go.Choropleth(
    locations=df_countries['Country'],
    locationmode='country names',
    z=df_countries['Confirmed'],
    colorscale='reds',
    marker_line_color='black',
    marker_line_width=0.5,
))
fig.update_layout(
    title_text='Confirmed Cases as of 2021/5/3',
    title_x=0.5,
    geo=dict(
        showframe=False,
        showcoastlines=False,
        projection_type='equirectangular'
    )
)
fig.show()
上面的是静态图,没有交互动能。但是相对的,渲染、画图的速度都会变快,同时保存下来的数据占用也小了。
导入依赖
import numpy as np
import plotly.express as px
import pandas as pd
import plotly.graph_objs as go
import plotly.io as pio
读数据、改列名
pio.renderers.default = "browser"
df = pd.read_csv("dataset/covid_19_data.csv")
df = df.rename(columns={
    'Country/Region': 'Country'})
df = df.rename(columns={
    'ObservationDate': 'Date'})
清洗
# Manipulating the original dataframe
df_countrydate = df[df['Confirmed'] > 0]
df_countrydate['Date'] = pd.to_datetime(df_countrydate['Date']).apply(lambda x: x.strftime('%Y-%m-%d'))

df_countrydate = df_countrydate.groupby(['Country', 'Date']).sum().reset_index().sort_values('Date', ascending=True)
print(df_countrydate)
画图
fig = px.choropleth(df_countrydate,
                    locations="Country",
                    locationmode="country names",
                    color="Confirmed",
                    hover_name="Country",
                    animation_frame="Date",
                    )
fig.update_layout(
    title_text='Global Spread of Coronavirus',
    title_x=0.5,
    geo=dict(
        showframe=False,
        showcoastlines=False,
    ))

fig.show()
上述是使用python生成展示为html形式的图。
此外,还可以使用前端绘图,例如Echarts。
1 <!DOCTYPE html>
  2 <html lang="en">
  3 <head>
  4   <meta charset="UTF-8">
  5   <meta name="viewport" content="width=device-width, initial-scale=1.0">
  6   <title>疫情地图展示</title>
  7   <style>
  8     .container {

  9       width: 1200px;
 10       margin: 0 auto;
 11     }
 12
 13     #myEcharts {

 14       width: 800px;
 15       height: 500px;
 16       border: solid 1px red;
 17       margin: 0 auto;
 18     }
 19   </style>
 20   <script src="https://www.echartsjs.com/examples/vendors/jquery/jquery.js"></script>
 21   <!-- 引入 echarts.js -->
 22   <script src="https://www.echartsjs.com/examples/vendors/echarts/echarts.min.js?_v_=1578305236132"></script>
 23   <!--引入中国的地图数据js文件,引入后会自动注册地图名字和数据-->
 24   <script src="https://www.echartsjs.com/examples/vendors/echarts/map/js/china.js?_v_=1578305236132"></script>
 25
 26 </head>
 27
 28 <body>
 29   <div class="container">
 30     <h3>累计确诊人数如下:</h3>
 31     <!--为echarts准备一个dom容器-->
 32     <div id="myEcharts"></div>
 33   </div>
 34
 35
 36   <script>
 37     //初始化echarts实例
 38     var myChart = echarts.init(document.getElementById('myEcharts'));
 39     // 指定图表的配置项和数据
 40     option = {

 41       title: {

 42         text: '中国疫情图',
 43         left: 'center'
 44       },
 45       tooltip: {

 46         trigger: 'item'
 47       },
 48       legend: {

 49         orient: 'vertical',
 50         left: 'left',
 51         data: ['中国疫情图']
 52       },
 53       visualMap: {

 54         type: 'piecewise',
 55         pieces: [
 56           {
     min: 1000, max: 1000000, label: '大于等于1000人', color: '#372a28' },
 57           {
     min: 500, max: 999, label: '确诊500-999人', color: '#4e160f' },
 58           {
     min: 100, max: 499, label: '确诊100-499人', color: '#974236' },
 59           {
     min: 10, max: 99, label: '确诊10-99人', color: '#ee7263' },
 60           {
     min: 1, max: 9, label: '确诊1-9人', color: '#f5bba7' },
 61         ],
 62         color: ['#E0022B', '#E09107', '#A3E00B']
 63       },
 64       toolbox: {

 65         show: true,
 66         orient: 'vertical',
 67         left: 'right',
 68         top: 'center',
 69         feature: {

 70           mark: {
     show: true },
 71           dataView: {
     show: true, readOnly: false },
 72           restore: {
     show: true },
 73           saveAsImage: {
     show: true }
 74         }
 75       },
 76       roamController: {

 77         show: true,
 78         left: 'right',
 79         mapTypeControl: {

 80           'china': true
 81         }
 82       },
 83       series: [
 84         {

 85           name: '确诊数',
 86           type: 'map',
 87           mapType: 'china',
 88           roam: false,
 89           label: {

 90             show: true,
 91             color: 'rgb(249, 249, 249)'
 92           },
 93           data: []
 94         }
 95       ]
 96     };
 97
 98     //使用指定的配置项和数据显示图表
 99     myChart.setOption(option);
100
101     //获取数据
102     function getData() {

103       $.ajax({

104         url: "https://view.inews.qq.com/g2/getOnsInfo?name=disease_h5",
105         dataType: "jsonp",
106         success: function (data) {

107           // console.log(data.data)
108           var res = data.data || "";
109           res = JSON.parse(res);
110           var newArr = [];
111           //newArr的数据格式为:
112           // [{

113           // name: '北京11',
114           // value: 212
115           // }, {

116           // name: '天津',
117           // value: 60
118           // }]
119           if (res) {

120             //获取到各个省份的数据
121             var province = res.areaTree[0].children;
122             for (var i = 0; i < province.length; i++) {

123               var json = {

124                 name: province[i].name,
125                 value: province[i].total.confirm
126               }
127               newArr.push(json)
128             }
129             console.log(newArr)
130             console.log(JSON.stringify(newArr))
131             //使用指定的配置项和数据显示图表
132             myChart.setOption({

133               series: [
134                 {

135                   name: '确诊数',
136                   type: 'map',
137                   mapType: 'china',
138                   roam: false,
139                   label: {

140                     show: true,
141                     color: 'rgb(249, 249, 249)'
142                   },
143                   data: newArr
144                 }
145               ]
146             });
147           }
148         }
149
150       })
151     }
152     getData();
153
154   </script>
155 </body>
156 </html>
边栏推荐
- Image mosaic based on transformation matrix
- [fpga+gps receiver] detailed design introduction of dual frequency GPS receiver based on FPGA
- KV storage separation principle and performance evaluation of nebula graph
- Is there a row limit for a single MySQL table
- 【clickhouse专栏】新建库角色用户初始化
- Zabbix6.0新功能Geomap 地图标记 你会用吗?
- Goodbye to excel and PPT, I found a better visual fool software
- Solution to missing in unity script
- Smart panel WiFi linkage technology, esp32 wireless chip module, Internet of things WiFi communication application
- 【mysql】mysql安装
猜你喜欢
![[C language] analysis of variable essence](/img/b4/13a5800f2c960ec590c9f7480b09d0.png)
[C language] analysis of variable essence

分布式计算的八大谬论

云原生概述
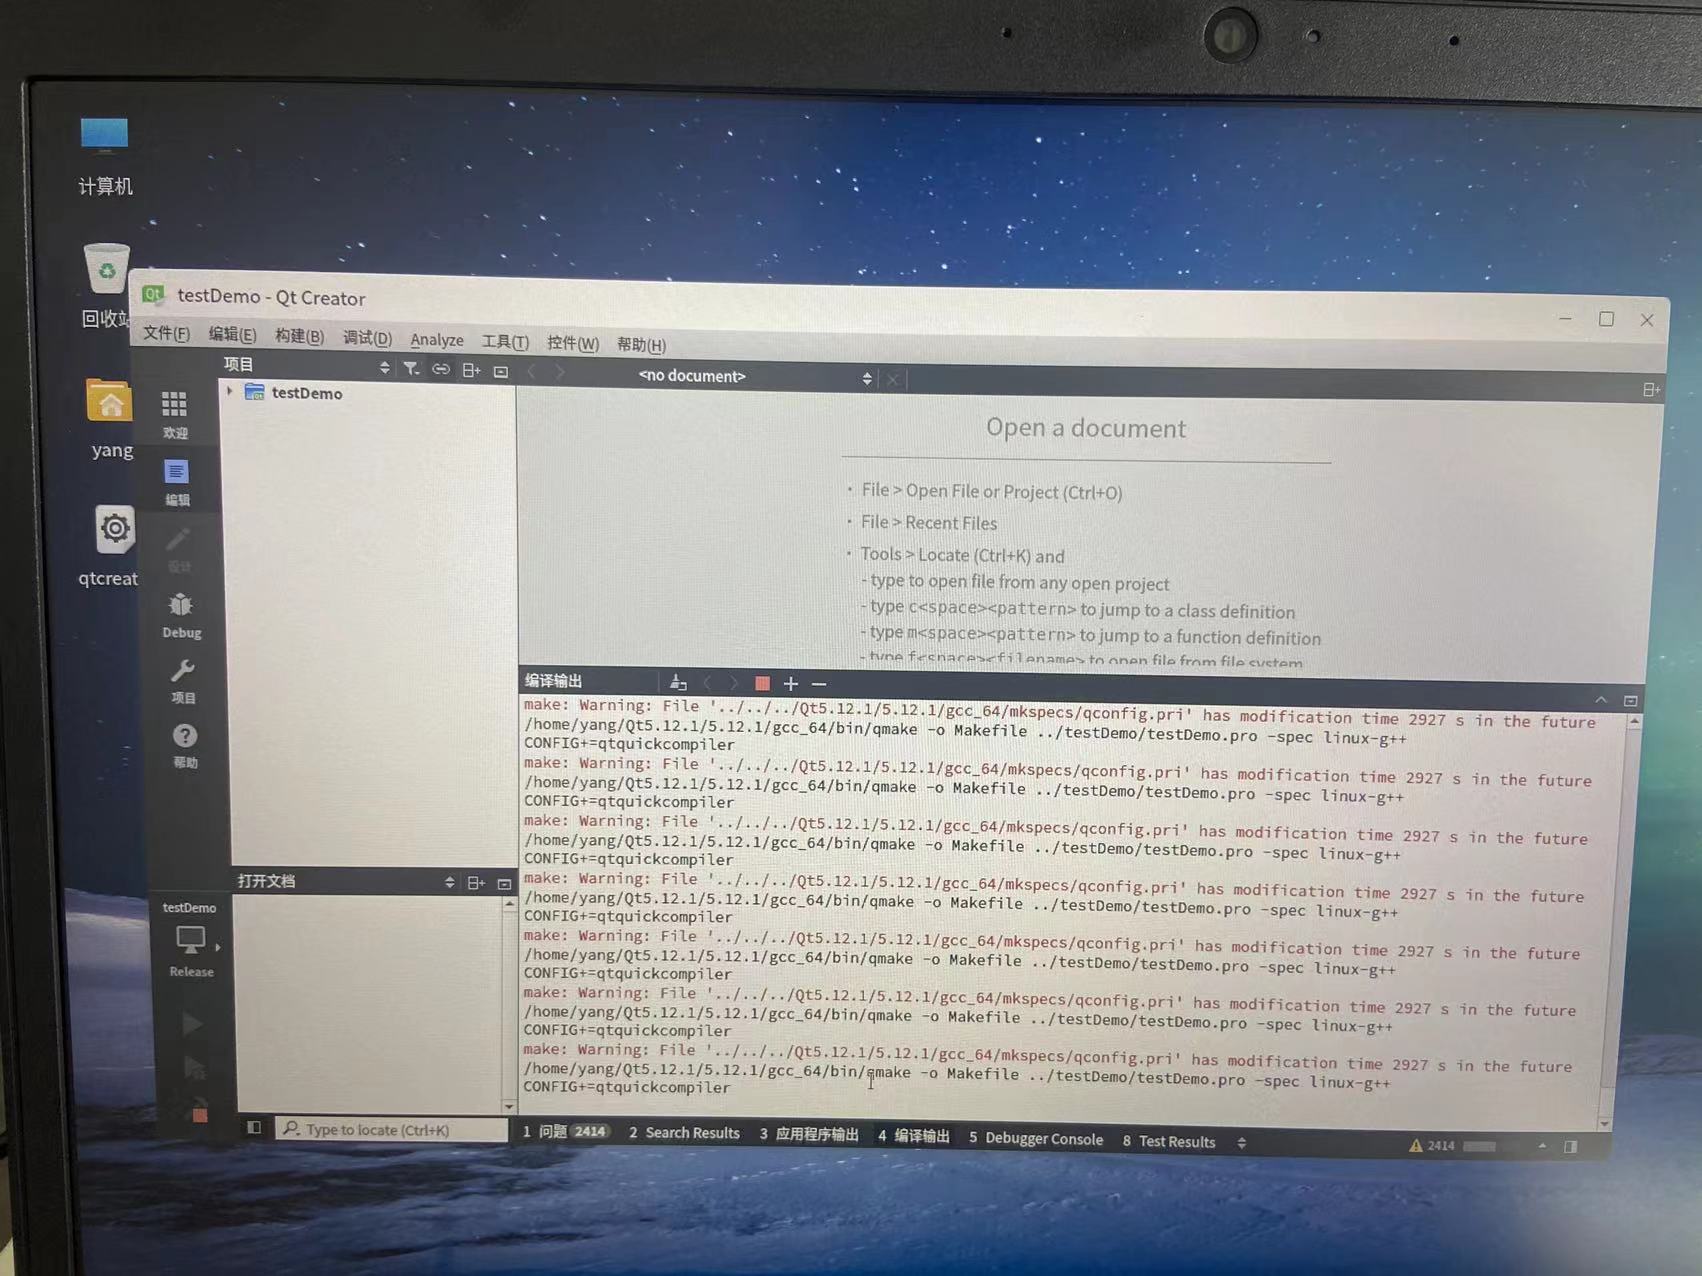
The solution to the error "xxx.pri has modification time XXXX s in the futrue" in the compilation of domestic Kirin QT

【mysql】mysql安装

DS18B20 digital thermometer (I) electrical characteristics, power supply and wiring mode
![[FPGA chaos] implementation of FPGA based chaotic system Verilog](/img/c0/cda4644168264b7531b67ef16e801a.png)
[FPGA chaos] implementation of FPGA based chaotic system Verilog

Evolution and practice of Unicom real-time computing platform

【FPGA+FFT】基于FPGA的FFT频率计设计与实现

根据变换矩阵进行图像拼接
随机推荐
Page crash handling method
【FPGA+GPS接收器】基于FPGA的双频GPS接收器详细设计介绍
sed命令
R language plot visualization: plot visualization of basic 2D histogram, custom setting of color of 2D histogram, and histogram visualization of binary distribution (basic 2D histogram)
Object detection model rfbnet -- a very useful model
数据库新建表,以前没问题的,今天
What does hard work mean to you?
Yyds dry inventory MySQL learning - how transactions are isolated
VIM command Encyclopedia
认真工作对自己到底意味着什么?
Detailed explanation of software testing process
[Yugong series] March 2022 asp Net core Middleware - cross domain
【C语言】变量本质分析
KV storage separation principle and performance evaluation of nebula graph
Function realization and application of trait
Mysql/oracle takes the unique time as the boundary, and the sum is less than or equal to this time, and greater than this time
WiFi module scheme of the wireless Internet of things, esp32-s3 chip technology, helps the equipment to be intelligent
Experience the good team collaborative development process brought by Huawei cloud code hosting from 0 [my Huawei cloud experience journey] [play with Huawei cloud]
Pat class B 1067 trial password (20 points)
Solution en cas de défaillance du script Unity