当前位置:网站首页>Google Earth engine - merra-2 m2t1nxaer: aerosol daily data set from 1980 to 2022
Google Earth engine - merra-2 m2t1nxaer: aerosol daily data set from 1980 to 2022
2022-07-26 15:59:00 【This star is bright】
M2T1NXAER( or tavg1_2d_aer_Nx) It is the review, analysis, research and application version of the modern era 2 (MERRA-2) Time averaged two-dimensional data collection per hour . This set includes assimilated aerosol diagnostics , For example, aerosol composition ( Black carbon 、 dust 、 Sea salt 、 Sulfate and organic carbon ) Column mass density of 、 Surface mass concentration and total extinction of aerosol components ( And scattering ) Aerosol optical thickness (AOT) stay 550 nm. total PM1.0、PM2.5 and PM10 have access to The formula described in the FAQ leads to
Data fields are used from 00:30 UTC Timestamp the central time of the first hour , for example :00:30、01:30、...、23:30 UTC.
MERRA-2 yes NASA Global modeling and assimilation Office (GMAO) Using the Goddard earth observation system model (GEOS) edition 5.12.4 The latest version of global atmospheric reanalysis in the satellite era . This data set covers 1980 Years to date , The follow-up update is delayed for about one month 3 Zhou .
Dataset availability
1980-01-01T00:00:00Z–2022-05-31T23:00:00
Data set provider
Earth engine fragment
ee.ImageCollection("NASA/GSFC/MERRA/aer/2")
Band information :
The resolution of the
69375 rice
Y The resolution of the
55000 rice
Band
| full name | Company | describe |
|---|---|---|
BCANGSTR | Black carbon angstrom parameter [470-870 nm] | |
BCCMASS | kg /( rice ^2) | Mass density of black carbon column |
BCEXTTAU | Black carbon extinction AOT [550 nm] | |
BCFLUXU | kg / rice / second | Black carbon pillar u Wind mass flux |
BCFLUXV | kg / rice / second | Black carbon pillar v- Wind mass flux |
BCSCATAU | Black carbon scattering AOT [550 nm] | |
BCSMASS | kg /( rice ^3) | Surface mass concentration of black carbon |
DMSCMASS | kg /( rice ^2) | Dms Column mass density |
DMSSMASS | kg /( rice ^3) | Dms Surface mass concentration |
DUANGSTR | Dust parameters [470-870 nm] | |
DUCMASS25 | kg /( rice ^2) | Mass density of dust column - PM2.5 |
DUCMASS | kg /( rice ^2) | Mass density of dust column |
DUEXTT25 | Remove dust AOT [550 nm] - PM2.5 | |
DUEXTTAU | Remove dust AOT [550 nm] | |
DUFLUXU | kg / rice / second | Dust column u Wind mass flux |
DUFLUXV | kg / rice / second | Dust column v- Wind mass flux |
DUSCAT25 | Dust scattering AOT [550 nm] - PM2.5 | |
DUSCATAU | Dust scattering AOT [550 nm] | |
DUSMASS25 | kg /( rice ^3) | Dust surface mass concentration - PM2.5 |
DUSMASS | kg /( rice ^3) | Dust surface mass concentration |
OCANGSTR | Organic carbon parameters [470-870 nm] | |
OCCMASS | kg /( rice ^2) | Mass density of organic carbon column |
OCEXTTAU | Organic carbon extinction AOT [550 nm] | |
OCFLUXU | kg / rice / second | Organic carbon column u- Wind mass flux |
OCFLUXV | kg / rice / second | Organic carbon column v- Wind mass flux |
OCSCATAU | Organic carbon scattering AOT [550 nm] | |
OCSMASS | kg /( rice ^3) | Surface mass concentration of organic carbon |
SO2CMASS | kg /( rice ^2) | So2 Column mass density |
SO2SMASS | kg /( rice ^3) | So2 Surface mass concentration |
SO4CMASS | kg /( rice ^2) | SO4 Column mass density |
SO4SMASS | kg /( rice ^3) | SO4 Surface mass concentration |
SSANGSTR | Sea salt angstrom parameter [470-870 nm] | |
SSCMASS25 | kg /( rice ^2) | Mass density of sea salt column - PM2.5 |
SSCMASS | kg /( rice ^2) | Mass density of sea salt column |
SSEXTT25 | Sea salt extinction AOT [550 nm] - PM2.5 | |
SSEXTTAU | Sea salt extinction AOT [550 nm] | |
SSFLUXU | kg / rice / second | Sea salt column u Wind mass flux |
SSFLUXV | kg / rice / second | Sea salt column v- Wind mass flux |
SSSCAT25 | Sea salt scattering AOT [550 nm] - PM2.5 | |
SSSCATAU | Sea salt scattering AOT [550 nm] | |
SSSMASS25 | kg /( rice ^3) | Surface mass concentration of sea salt - PM2.5 |
SSSMASS | kg /( rice ^3) | Surface mass concentration of sea salt |
SUANGSTR | SO4 Angstrom parameter [470-870 nm] | |
SUEXTTAU | SO4 extinction AOT [550 nm] | |
SUFLUXU | kg / rice / second | SO4 column u- Wind mass flux |
SUFLUXV | kg / rice / second | SO4 column v- Wind mass flux |
SUSCATAU | SO4 scattering AOT [550 nm] | |
TOTANGSTR | Total aerosol angstrom parameter [470-870 nm] | |
TOTEXTTAU | Total aerosol extinction AOT [550 nm] | |
TOTSCATAU | Total aerosol scattering AOT [550 nm] |
Code :
var dataset = ee.ImageCollection('NASA/GSFC/MERRA/aer/2')
                  .filter(ee.Filter.date('2022-02-01', '2022-02-02'));
var black_carbon_column_u_wind_mass_flux = dataset.select('BCFLUXU');
var bccVis = {
  min: -0.0000116,
  max: 0.0000165,
  palette: ['001137', '01abab', 'e7eb05', '620500']
};
Map.setCenter(-95.62, 39.91, 2);
Map.addLayer(black_carbon_column_u_wind_mass_flux, bccVis);
quote :
Terms of use
NASA Promote and research and application communities 、 private enterprise 、 Academia and the public share all data comprehensively and openly .
result :

The common calculation formula mentioned above pm:
MERRA-2 It provides two different units of soil moisture in the land surface diagnostic file set (M2T1NXLND、M2TMNXLND and M2TUNXLND).
The first set of variables is the relative saturation of different layer depths ( Dimensionless ) The unit of g round Wet value (GWET*)( See below for more details ). The value is 1 Indicates completely saturated soil , The value is 0 It means completely anhydrous soil
The second set of variables is based on m 3 /m 3 The volume unit of represents the soil moisture content ( * MC ) , That is, large pieces of soil ( Including all solid substances 、 Water and air ) Volume of water in volume .
Snow depth (SNODP) Only the depth of snow in the snow covered part is recorded . On the other hand , The amount of snow (SNOMAS) It is recorded relative to the whole grid cell area , Including snow and snow free parts .
The whole grid cell ( Including snow and snow free parts ) The average snow depth can be determined by SNODP And FRSNO Multiply to calculate .
single click “ Read more ” To see MERRA2( And the current version GEOS/GOCART) Aerosol size used in .
Use 2D aer_Nx Fields in the collection , The following formula can be used to calculate the particle concentration :
PM2.5 = DUSMASS25 + OCSMASS+ BCSMASS + SSSMASS25 + SO4SMASS* (132.14/96.06)
Sulfate requires a multiplication factor , because MERRA-2 The species tracer in is sulfate ion . about GEOS FP Users of , Please note that this formula does not apply to FP, because MERRA-2 Nitrate aerosols are not included .
And PM2.5 Different ,PM2.5 The contribution of dust and sea salt is contained in 2D aer_Nx Collection ,MERRA-2 There's no ready-made PM1/PM10 The diagnosis . however , According to aer_Nv Calculation of aerosol mass mixing ratio in the set P1/PM10 concentration . From the lowest model layer 72 The aerosol mass mixing ratio in starts ( memories :MERRA-2 The vertical layers are arranged from top to bottom ) And calculate the particle concentration according to the following formula :
PM1 = (1.375*SO4 + BCphobic + BCphilic + OCphobic + OCphilic + 0.7 * DU001 + SS01 + SS002) * Edens
PM10 = (1.375*SO4 + BCphobic + BCphilic + OCphobic + OCphilic + DU001 + DU002 + DU003 + 0.74 * DU004 + SS01 + SS002 + SS003 + SS004) * Edens
among g Is the gravitational constant ,delp Is the pressure thickness of the lowest model layer ( With Pa In units of ).
Create a monthly file at the end of the month , Conduct quality inspection all month . After approval , The data will be published to GES DISC. therefore , Each new moon is about next month 15 solstice 20 Available between days .
however , If there is any interruption in the input observation flow or computing service , There may be a delay .
MERRA -2 Document specification document Provides relevant variables 、 Extensive information about units and data file collections .
MERRA The parameterization of land is Randy Koster Of Catchment Model , But other surfaces , Such as inland waters 、 The ocean surface and glaciers are also considered as sub grid blocks . stay LND In the variable set , All data are from land models , It is not weighted according to the land proportion of the grid point . These data are provided to better calculate the land budget of soil water and land energy .
FLX、RAD Or the data in any other variable set represents the grid box average of all different tiles weighted by their scores . This is where you will use evaporation to calculate the atmospheric energy balance . The important difference here is LND Just land , All other sets represent the entire grid box .
GEOS and MERRA Some land cover in is discussed more here : https ://gmao.gsfc.nasa.gov/reanalysis/MERRA/land_fractions.php
Used to generate MERRA Of GEOS Data assimilation systems do not ( Or there is no ) Extrapolate the data to a pressure level higher than the surface pressure . These grid points are marked by undefined values . The result is , Compared with other datasets , The average area containing these points will not be representative without additional screening . Time average ( For example, monthly average ) There may also be significant differences at the edge of the terrain . Provide the lowest model level data and surface data , So that users can make their own inferences . Provides a page to discuss this issue . see MERRA
The choice for a more complete derivation and discussion is the micrometeorology textbook , for example Roland Stull Of 《 Boundary layer meteorology 》.
In short , Elements of the earth's surface 、 The grass 、 shrub 、 Crops 、 Trees and buildings will cause some friction and disturbance to the wind profile . Displacement height ( Or depth , Or zero plane displacement ) Their influence in calculating the wind profile of surface logging is explained . The displacement height is the height at which the logarithmic wind profile projects the wind to zero , Used to calculate the subsequent turbulent flux on the surface . At a height less than the displacement , Different physical processes and theories replace the logging profile method . For practical purposes ,MERRA 2m and 10m The output is intended for comparison with screen level weather stations .
From the land-based ground meteorological station , Only ground pressure is assimilated . Radiosonde stations may contribute to lower level analysis (T、Qv、U、V). Again , Commercial aircraft can provide lower levels of ascent and descent data (T、U、V). And wind profiler (U,V). On the ocean , Ships and buoys can provide PS、T、Qv、U and V. For more information , see also MERRA-2 Observation technical memorandum .
边栏推荐
猜你喜欢
原来卡布奇诺信息安全协会是干这个的呀,一起来看看吧。

TI C6000 TMS320C6678 DSP+ Zynq-7045的PS + PL异构多核案例开发手册(3)

Parker pump pv140r1k1t1pmmc

使用verdaccio搭建自己的npm私有库

反射、枚举以及lambda表达式

Desktop application layout
Reflection, enumeration, and lambda expressions
German EMG e-anji thruster ed301/6 HS

Change an ergonomic chair to relieve the old waist of sitting and writing code~
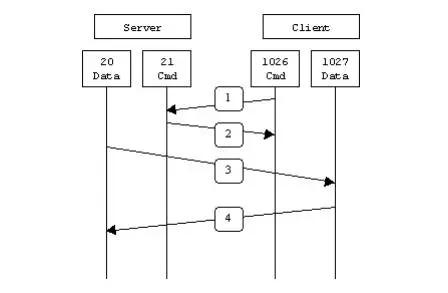
FTP协议

随机推荐
八叉树建立地图并实现路径规划导航
提问征集丨快来向NLLB作者提问啦!(智源Live第24期)
81. (cesium home) cesium modifies the gray background (default blue)
Yushenle's learning record: the first project of SOC FPGA -hello world
Google Earth Engine——MERRA-2 M2T1NXAER:1980-2022年气溶胶逐日数据集
hawe螺旋插装式单向阀RK4
If you want to be good at work, you must first use its tools -c language expansion -- embedded C language (11)
js 对数组操作的 API 总结
基于SSM实现个性化健康饮食推荐系统
Tool skill learning (I): pre skills -makfile, make,.Mk
什么是虚拟摄像头
一文搞懂│XSS攻击、SQL注入、CSRF攻击、DDOS攻击、DNS劫持
请问参数化视图可以根据传入参数的特点得到不同行数的SQL吗?比如这里我想根据传输参数@field中列
使用verdaccio搭建自己的npm私有库
数智转型,管理先行|JNPF全力打造“全生命周期管理”平台
SettingWithCopyWarning: A value is trying to be set on a copy of a slice from a DataFrame
全志A40i工业核心板,100%国产4核ARM Cortex-A7,支持“双屏异显”【显示接口能力,工业HMI首选方案】
ROS problems and Solutions - relying on package installation and unable to correct errors
理解卷积神经网络中的权值共享
Complete MySQL commands