当前位置:网站首页>Getting started with MATLAB 3D drawing command plot3
Getting started with MATLAB 3D drawing command plot3
2022-08-04 00:22:00 【Yang Laotou Soft Worker】
I. Introduction
Matlab software provides powerful visualization functions, which can draw both plane graphics and three-dimensional graphics.Drawing a three-dimensional curve graph or a scatter plot can be done using the command plot3.This article gives an introduction to using plot3 to draw three-dimensional curves (in fact, surfaces) or scatter plots.
2. Detailed description of the basic usage of plot3
Basic syntax: plot3(x, y, z, s )
where x, y and z are arrays of the same dimension, and (x, y) constitutes a three-dimensionalThe coordinate point of the surface graph on the definition domain, z is the vertical coordinate, it can be a function of (x, y), or it can only have a numerical relationship.
s are primitive attributes.
Its function is to draw the curve graph of the space surface according to the color given by the attribute s or the line element and the grid point (x, y, z) on the surface.
The primitive attributes s can be defaulted.When the default s is used, the three-dimensional curve graph is drawn with the color automatically specified by the system;
Example 1. The grid of the abscissa and the ordinate is known, and the spatial graph is drawn.
% Sample code (1) Drawing using the color given by the system
[x,y]=meshgrid(-2*pi:0.2:2*pi);z=(x.^2-2*x).*exp(-x.^2-y.^2-x.*y);;plot3( x, y, z );%Running results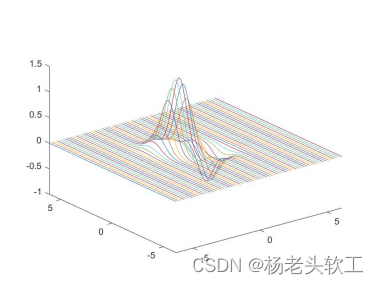
%Sample code (2): specify color
[x,y]=meshgrid(-2*pi:0.2:2*pi);z=(x.^2-2*x).*exp(-x.^2-y.^2-x.*y);plot3( x, y, z, 'r' )%Running results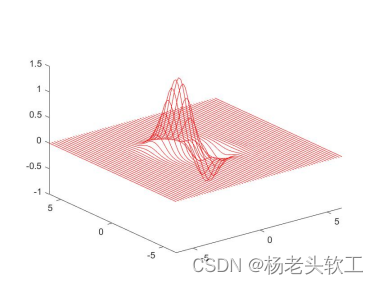
%Sample code (3): each line is assigned a color according to its own needs
[x,y]=meshgrid(-2*pi:0.2:2*pi);z=(x.^2-2*x).*exp(-x.^2-y.^2-x.*y);len = length( z );for i = 1 : lenplot3( x(:,i), y(:,i), z(:,i), 'color', [ i/(len), (i+len)/(3*len), (i+len))/(6*len) ])hold onend%run result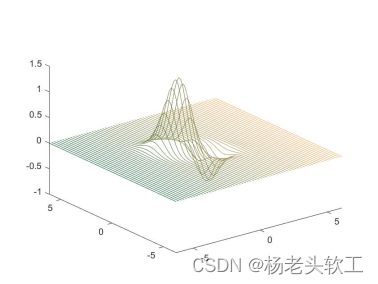
Example 2: Drawing a spiral diagram (dotted line)
Reference code:
clear allclct = [ 0 : 0.02 : 10 ] * pi;r = 2;x = r * cos(t);y = r * sin(t);z = 0.5 * t;plot3( x, y, z, 'b--' )%Running results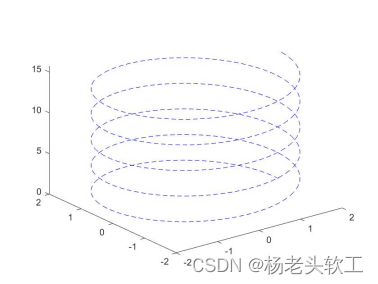
Example 3: Draw randomScatter Plot
Reference Code:
clear allclc[ x, y ] = meshgrid( 0 : 0.2 : 3 );z1 = randn( size(x) );plot3( x, y, z1, 'ro' )hold on[ x, y ] = meshgrid( 1 : 0.2 : 4 );z2 = randn( size(x) ) + 2;plot3( x, y, z2, '.', 'markersize', 20 )xlabel('x');ylabel('y');zlabel('z');grid on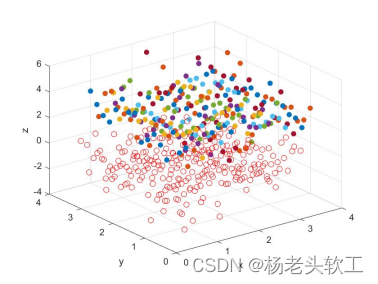
Example 4: Draw the upper half-cone truncated unit sphereScatter plot of the resulting surface.
Reference code: (borrowed spherical coordinates)
clear allclcr=1;for phi = 0:pi/80:pi/4for theta = 0:pi/20:2*pix = r*sin(phi)*cos(theta);y = r*sin(phi)*sin(theta);z = r*cos(phi);% vertical coordinates on the spherezz = r*sin(phi);% vertical coordinates on the conical surfacecol1 = abs(x);col2 = abs(y);col3 = abs(z);plot3(x,y,z,'.','color',[col1,col2,col3]);% sphericalhold onplot3(x,y,zz,'r.')% conical surfaceendendaxis equalxlabel('x');ylabel('y');zlabel('z');Run result: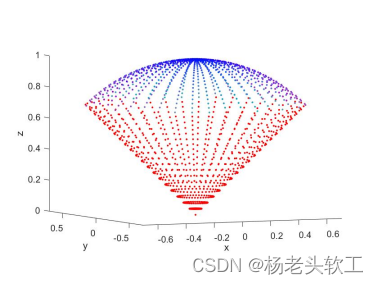
边栏推荐
- Internship: Upload method for writing excel sheet (import)
- Nanoprobes 棕榈酰纳米金相关说明书
- Unity intercepts 3D images and the implementation of picture-in-picture PIP
- 机器学习——库
- 越来越火的图数据库到底能做什么?
- 全面讲解 Handler机制原理解析 (小白必看)
- The world's first mass production, with the most fixed points!How does this AVP Tier1 lead?
- ping数据包中的进程号
- 并查集详解
- HNUCM 您好中国
猜你喜欢
MATLAB三维绘图命令plot3入门
Eight things to pay attention to in spot silver
Three.js入门详解
The Beijing E-sports Metaverse Forum was successfully held
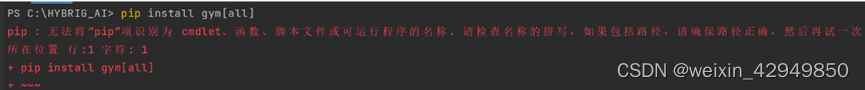
搭建好pytorch环境后,pip和conda指令不能用

Salesforce的中国区业务可能出现新变化,传言可能正在关闭
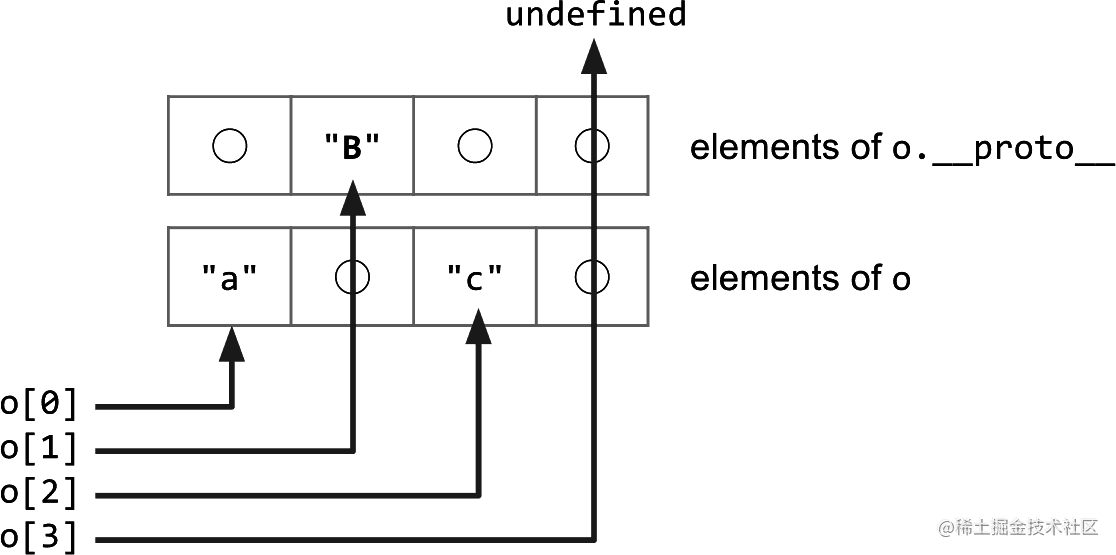
In V8 how arrays (with source code, picture and text easier to understand)
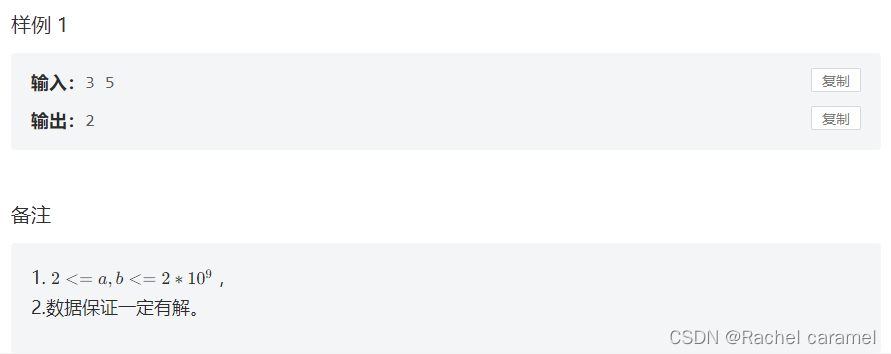
求解同余方程 数论 扩展欧几里得
Why Flutter Flutter of tutorials is the best choice for business?

FinClip, help smart TV more imagination
随机推荐
咱们500万条数据测试一下,如何合理使用索引加速?
20年将投资美国约2000亿美元,三星电子财大气粗的样子真好看
绕任意轴旋转矩阵推导
BPF 可移植性和 CO-RE(一次编译,到处运行)
Prometheus监控Harbor(二进制版)
【性能优化】MySQL性能优化之存储引擎调优
boot issue
详谈RDMA技术原理和三种实现方式
【链路聚合原理及配置】
免费的公共WiFi不要乱连,遭中间人攻击了吧?
fsdbDump用法
【性能优化】MySQL常用慢查询分析工具
Shell编程之循环语句(for、while)
现货白银需要注意八大事项
Using matlab to solve the linear optimization problem based on matlab dynamic model of learning notes _11 】 【
BioVendor人Clara细胞蛋白(CC16)Elisa试剂盒检测步骤
【OpenCV图像处理】 图像拼接技术
dynamic memory two
c语言分层理解(c语言指针(上))
孙宇晨受邀参加36氪元宇宙峰会并发表主题演讲