当前位置:网站首页>WPF implements column chart
WPF implements column chart
2022-08-03 17:38:00 【yanjinhua】
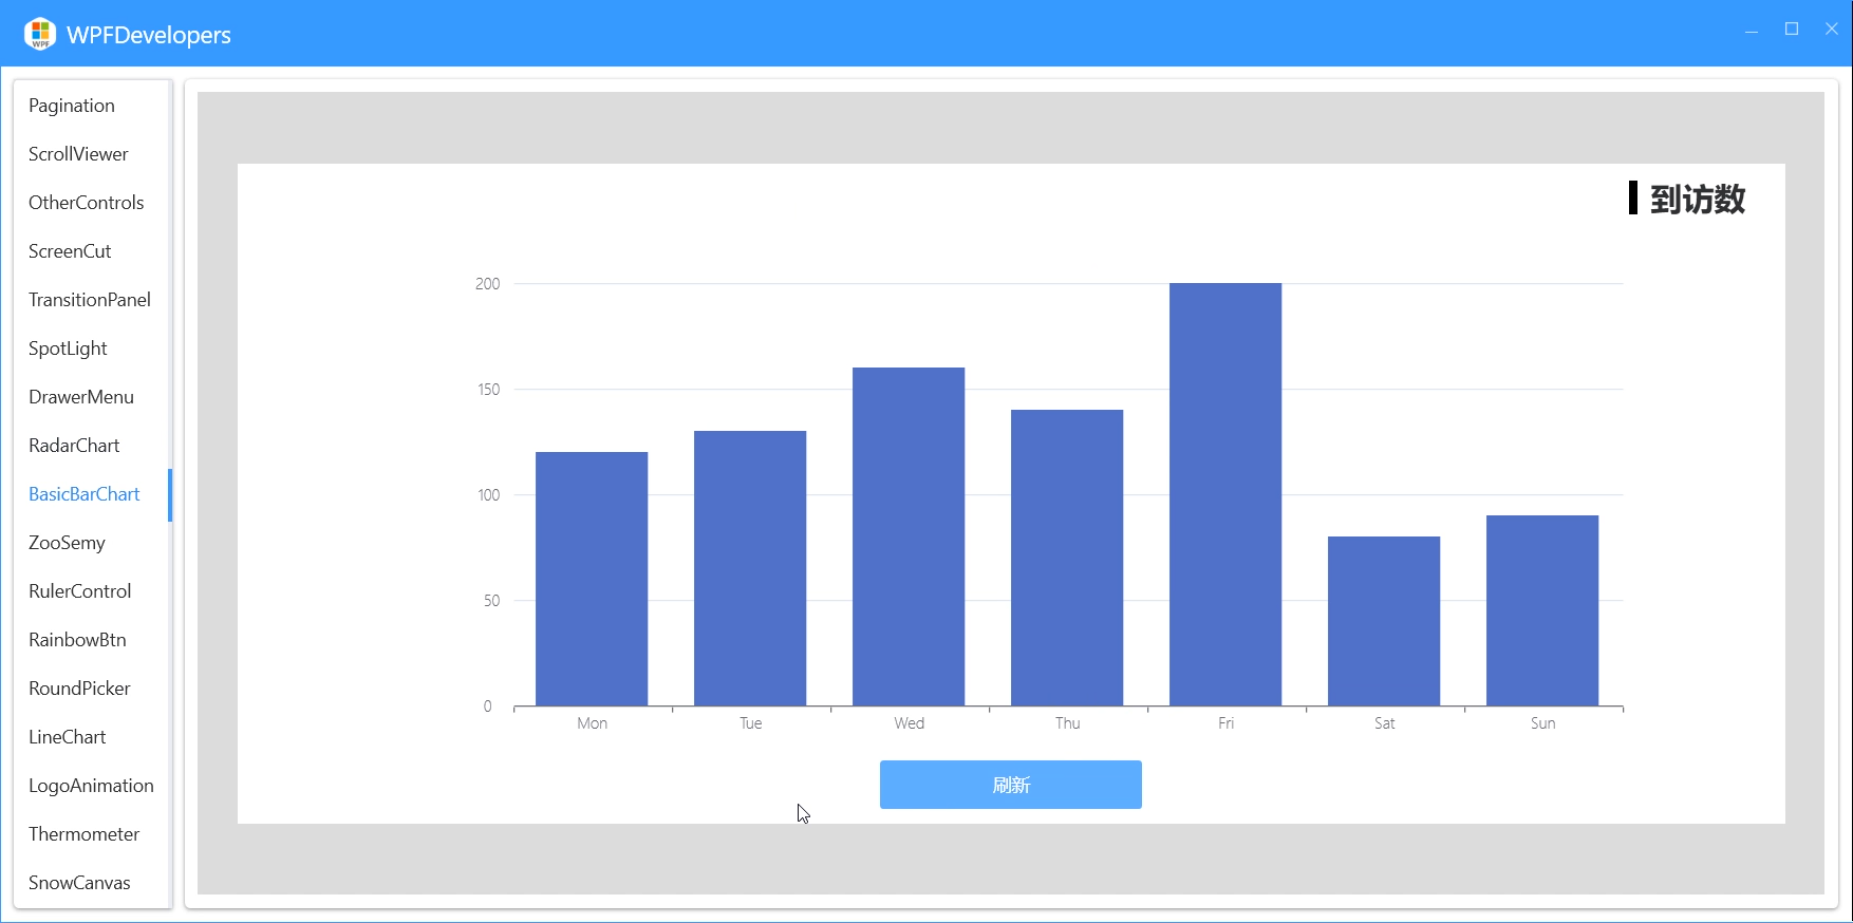
WPF Implement a column chart
WPF Implement a column chart
作者:WPFDevelopersOrg
原文链接: https://github.com/WPFDevelopersOrg/WPFDevelopers
框架使用大于等于
.NET40;Visual Studio 2022;项目使用 MIT 开源许可协议;
避免画线发虚DrawingContext绘制Line的时候会发虚,以下方法可以避免;
 var d = Pen.Thickness / 2;
 var guidelines = new GuidelineSet(new[] { d }, new[] { d });
 drawingContext.PushGuidelineSet(guidelines);
 或者调用
 SnapDrawingExtensions.DrawSnappedLinesBetweenPoints
1) BasicBarChart.cs 代码如下;
using System;
using System.Collections.Generic;
using System.Linq;
using System.Windows;
using System.Windows.Controls;
using System.Windows.Media;

namespace WPFDevelopers.Controls
{
    public class BasicBarChart : Control
    {
        public static readonly DependencyProperty SeriesArrayProperty =
            DependencyProperty.Register("SeriesArray", typeof(IEnumerable<KeyValuePair<string, double>>),
                typeof(BasicBarChart), new UIPropertyMetadata(SeriesArrayChanged));


        static BasicBarChart()
        {
            DefaultStyleKeyProperty.OverrideMetadata(typeof(BasicBarChart),
                new FrameworkPropertyMetadata(typeof(BasicBarChart)));
        }

        public IEnumerable<KeyValuePair<string, double>> SeriesArray
        {
            get => (IEnumerable<KeyValuePair<string, double>>)GetValue(SeriesArrayProperty);
            set => SetValue(SeriesArrayProperty, value);
        }

        private static void SeriesArrayChanged(DependencyObject d, DependencyPropertyChangedEventArgs e)
        {
            var radarChart = d as BasicBarChart;
            if (e.NewValue != null)
                radarChart.InvalidateVisual();
        }

        protected override void OnRender(DrawingContext drawingContext)
        {
            //base.OnRender(drawingContext);
            if (SeriesArray == null || SeriesArray.Count() == 0)
                return;
            SnapsToDevicePixels = true;
            UseLayoutRounding = true;
            var brushConverter = new BrushConverter();
            var myPen = new Pen
            {
                Thickness = 1,
                Brush = (Brush)brushConverter.ConvertFromString("#6E7079")
            };
            myPen.Freeze();

            //var d = myPen.Thickness / 2;
            //var guidelines = new GuidelineSet(new[] { d }, new[] { d });
            //drawingContext.PushGuidelineSet(guidelines);

            var h = ActualHeight / 2 + 160;
            var w = ActualWidth / 2;
            var startX = w / 3;
            var width = SeriesArray.Count() * 120 + startX;
            //drawingContext.DrawLine(myPen, new Point(startX, h), new Point(width, h));
            var stratNum = 0;

            drawingContext.DrawSnappedLinesBetweenPoints(myPen, myPen.Thickness, new Point(startX, h),
                new Point(width, h));
            var formattedText = DrawingContextHelper.GetFormattedText(stratNum.ToString(),
                (Brush)brushConverter.ConvertFromString("#6E7079"), FlowDirection.LeftToRight);
            drawingContext.DrawText(formattedText,
                new Point(startX - formattedText.Width * 2 - 10, h - formattedText.Height / 2));
            var x = startX;
            //var y = h + d;
            var y = h + myPen.Thickness;
            var points = new List<Point>();
            var rectBrush = new SolidColorBrush((Color)ColorConverter.ConvertFromString("#5470C6"));
            for (var i = 0; i < SeriesArray.Count() + 1; i++)
            {
                //drawingContext.DrawLine(myPen, new Point(x, y), new Point(x, y + 4));
                points.Add(new Point(x, y));
                points.Add(new Point(x, y + 4));
                x = x + 120;
            }

            drawingContext.DrawSnappedLinesBetweenPoints(myPen, myPen.Thickness, points.ToArray());

            var xAxisPen = new Pen
            {
                Thickness = 1,
                Brush = (Brush)brushConverter.ConvertFromString("#E0E6F1")
            };
            xAxisPen.Freeze();
            var xAxis = h - 80;
            var max = Convert.ToInt32(SeriesArray.Max(kvp => kvp.Value));
            max = (max / 50 + (max % 50 == 0 ? 0 : 1)) * 50 / 50;
            var min = Convert.ToInt32(SeriesArray.Min(kvp => kvp.Value));
            points.Clear();
            for (var i = 0; i < max; i++)
            {
                //drawingContext.DrawLine(xAxisPen, new Point(startX, xAxis), new Point(width, xAxis));
                points.Add(new Point(startX, xAxis));
                points.Add(new Point(width, xAxis));
                stratNum += 50;
                formattedText = DrawingContextHelper.GetFormattedText(stratNum.ToString(),
                    (Brush)brushConverter.ConvertFromString("#6E7079"), FlowDirection.LeftToRight);
                drawingContext.DrawText(formattedText,
                    new Point(startX - formattedText.Width - 10, xAxis - formattedText.Height / 2));
                xAxis = xAxis - 80;
            }

            drawingContext.DrawSnappedLinesBetweenPoints(xAxisPen, xAxisPen.Thickness, points.ToArray());

            x = startX;
            var rectWidth = 85;
            var rectHeight = 0D;
            for (var i = 0; i < SeriesArray.Count(); i++)
            {
                formattedText = DrawingContextHelper.GetFormattedText(SeriesArray.ToList()[i].Key,
                    (Brush)brushConverter.ConvertFromString("#6E7079"), FlowDirection.LeftToRight);
                drawingContext.DrawText(formattedText, new Point(x + 120 / 2 - formattedText.Width / 2, y + 4));
                var _value = SeriesArray.ToList()[i].Value;
                //rectHeight = _value * 200;
                rectHeight = (_value - 0) / (stratNum - 0) * (80 * max);
                //rectHeight = (stratNum - _value) / 100 * stratNum;
                drawingContext.DrawRectangle(rectBrush, null,
                    new Rect(x + (120 - 85) / 2, h - rectHeight, rectWidth, rectHeight));
                x = x + 120;
            }
        }
    }
}
2) **BasicBarChartExample.xaml ** 代码如下;
<UserControl x:Class="WPFDevelopers.Samples.ExampleViews.BasicBarChartExample"
             xmlns="http://schemas.microsoft.com/winfx/2006/xaml/presentation"
             xmlns:x="http://schemas.microsoft.com/winfx/2006/xaml"
             xmlns:mc="http://schemas.openxmlformats.org/markup-compatibility/2006"
             xmlns:d="http://schemas.microsoft.com/expression/blend/2008"
             xmlns:local="clr-namespace:WPFDevelopers.Samples.ExampleViews"
             xmlns:wpfdev="https://github.com/WPFDevelopersOrg/WPFDevelopers"
             mc:Ignorable="d"
             d:DesignHeight="450" d:DesignWidth="800">
    <Grid Background="Gainsboro">
        <Border
            Height="500"
            Background="White"
            Margin="30,0">
            <Grid Margin="20,10">

                <Grid.RowDefinitions>
                    <RowDefinition Height="40" />
                    <RowDefinition />
                    <RowDefinition Height="auto" />
                </Grid.RowDefinitions>
                <WrapPanel HorizontalAlignment="Right">
                    <Rectangle
                        Width="6"
                        Height="26"
                        Fill="Black" />
                    <TextBlock
                        Padding="10,0"
                        FontSize="24"
                        FontWeight="Black"
                        Text="{Binding KeyBarChart, RelativeSource={RelativeSource AncestorType=local:BasicBarChartExample}}" />
                </WrapPanel>
                <wpfdev:BasicBarChart
                     Grid.Row="1"
                    SeriesArray="{Binding SeriesModels, RelativeSource={RelativeSource AncestorType=local:BasicBarChartExample}}"/>
                <Button
                    Grid.Row="2"
                    Width="200"
                    VerticalAlignment="Bottom"
                    Click="Button_Click"
                    Content="刷新"
                    Style="{StaticResource PrimaryButton}" />
            </Grid>
        </Border>
    </Grid>
</UserControl>
2) BasicBarChartExample .xaml.cs 代码如下;
using System;
using System.Collections.Generic;
using System.Linq;
using System.Text;
using System.Windows;
using System.Windows.Controls;
using System.Windows.Data;
using System.Windows.Documents;
using System.Windows.Input;
using System.Windows.Media;
using System.Windows.Media.Imaging;
using System.Windows.Navigation;
using System.Windows.Shapes;

namespace WPFDevelopers.Samples.ExampleViews
{
    /// <summary>
    /// BasicBarChartExample.xaml 的交互逻辑
    /// </summary>
    public partial class BasicBarChartExample : UserControl
    {
        public IEnumerable<KeyValuePair<string, double>> SeriesModels
        {
            get { return (IEnumerable<KeyValuePair<string, double>>)GetValue(SeriesModelsProperty); }
            set { SetValue(SeriesModelsProperty, value); }
        }

        public static readonly DependencyProperty SeriesModelsProperty =
            DependencyProperty.Register("SeriesModels", typeof(IEnumerable<KeyValuePair<string, double>>), typeof(BasicBarChartExample), new PropertyMetadata(null));


        Dictionary<string, IEnumerable<KeyValuePair<string, double>>> keyValues = new Dictionary<string, IEnumerable<KeyValuePair<string, double>>>();
        public string KeyBarChart
        {
            get { return (string)GetValue(KeyBarChartProperty); }
            set { SetValue(KeyBarChartProperty, value); }
        }
        public static readonly DependencyProperty KeyBarChartProperty =
     DependencyProperty.Register("KeyBarChart", typeof(string), typeof(BasicBarChartExample), new PropertyMetadata(null));
        private int _index = 0;
        public BasicBarChartExample()
        {
            InitializeComponent();
            var Models1 = new[]
            {
                new KeyValuePair<string, double>("Mon", 120),
                new KeyValuePair<string, double>("Tue", 130),
                new KeyValuePair<string, double>("Wed", 160),
                new KeyValuePair<string, double>("Thu", 140),
                new KeyValuePair<string, double>("Fri", 200) ,
                new KeyValuePair<string, double>("Sat", 80) ,
                new KeyValuePair<string, double>("Sun", 90) ,
            };
            keyValues.Add("到访数", Models1);
            var Models2 = new[]
            {
                new KeyValuePair<string, double>("蛐蛐", 120),
                new KeyValuePair<string, double>("常威", 170),
                new KeyValuePair<string, double>("来福", 30),
                new KeyValuePair<string, double>("包龙星", 200),
                new KeyValuePair<string, double>("包有为", 100) ,
                new KeyValuePair<string, double>("雷豹", 180) ,
                new KeyValuePair<string, double>("方唐镜", 90) ,
            };
            keyValues.Add("能力值", Models2);

            SeriesModels = keyValues.ToList()[0].Value;
            KeyBarChart = keyValues.ToList()[0].Key;
        }

        private void Button_Click(object sender, RoutedEventArgs e)
        {
            _index++;
            if (_index >= keyValues.Count)
            {
                _index = 0;
            }
            SeriesModels = keyValues.ToList()[_index].Value;
            KeyBarChart = keyValues.ToList()[_index].Key;
        }
    }
}
边栏推荐
猜你喜欢
Description of the functional scenario of "collective storage and general governance" in the data center

工程仪器设备在线监测管理系统常见问题和注意事项
使用.NET简单实现一个Redis的高性能克隆版(一)
node connection mongoose database process
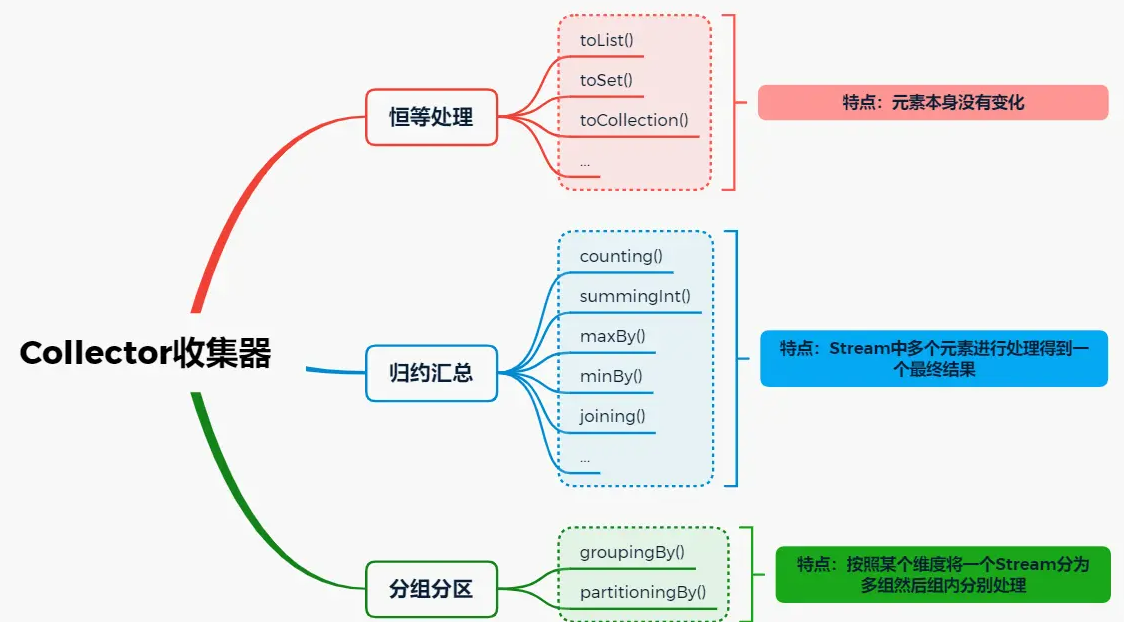
After using Stream for many years, does collect still have these "saucy operations"?
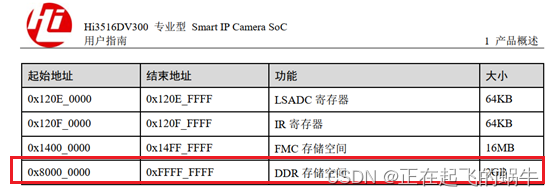
Detailed explanation of setting HiSilicon MMZ memory and OS memory
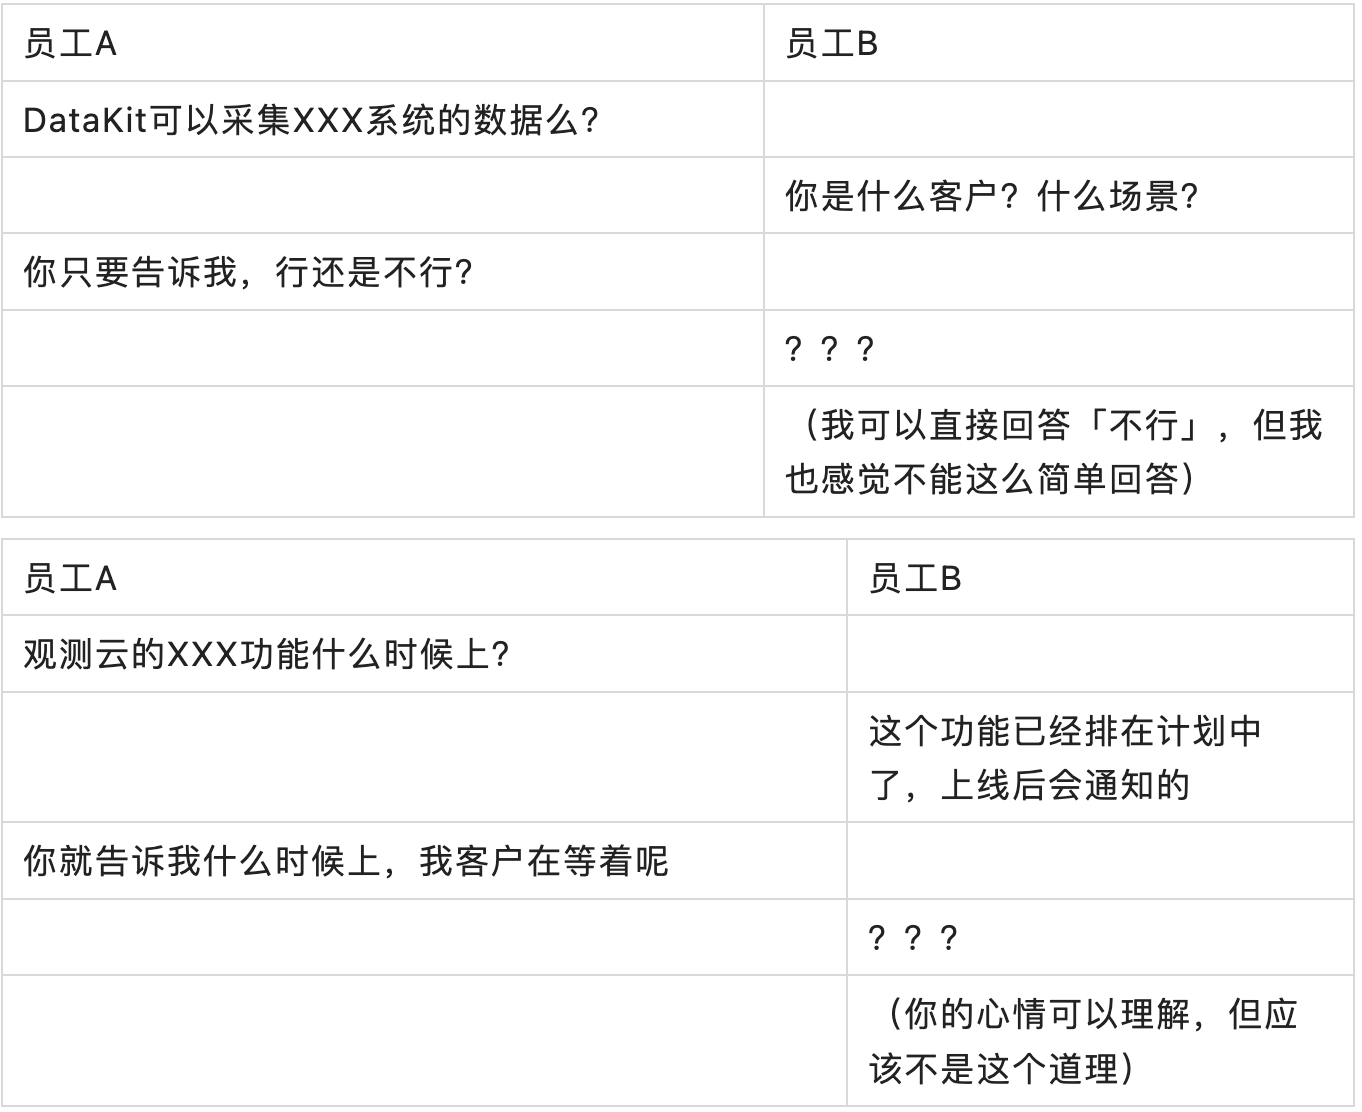
如何避免无效的沟通
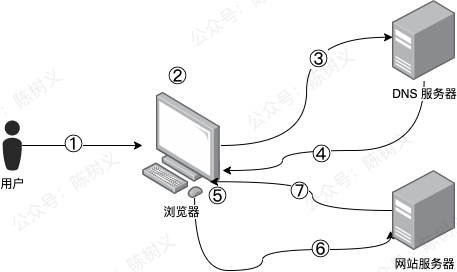
一文带你弄懂 CDN 技术的原理
【机器学习】机器学习的基本概念/术语2
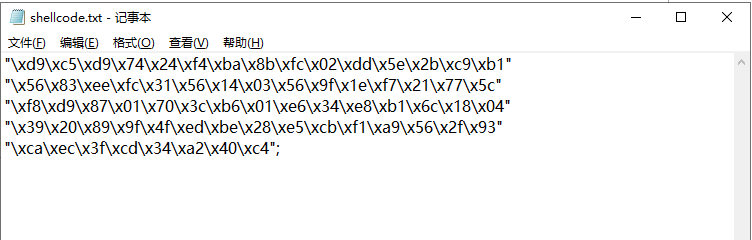
LyScript 从文本中读写ShellCode
随机推荐
C# 构造函数如人之影子
sphinx coreseek的安装和php下使用
云图说丨初识华为云微服务引擎CSE
303. Range Sum Query - Immutable
企业如何选择低代码开发平台
【机器学习】机器学习基本概念/术语3
精酿啤酒品牌,过把瘾就死?
并查集模板及思想
J9货币论:数字经济为全球经济复苏注入力量
leetcode-每日一题899. 有序队列(思维题)
After using Stream for many years, does collect still have these "saucy operations"?
Adobe是什么?
401. Binary Watch
一个域名对应多个IP地址
【数据库数据恢复】SqlServer数据库无法读取的数据恢复案例
分享一个开源的USB-CAN工具!
被误解的 MVC 和被神化的 MVVM(二)
ThreeJS简介
Web3的开源为何会如此受到人们喜爱?
Promise的 简单使用