当前位置:网站首页>这个地图绘制工具太赞了,推荐~~
这个地图绘制工具太赞了,推荐~~
2022-08-01 02:30:00 【Python数据之道】
来源:DataCharm
之前小编在公众号中介绍了多篇关于空间可视化图表绘制内容,受到了很多同学的喜欢,但也有很多同学说没有Python的版本,今天小编就推荐一个超赞的学术科研类地图可视化绘制工具-Python-pygmt库,顾名思义,pygmt是基于具有强大绘图功能的GMT软件,且使用pygmt前必须安装GMT(Generic Mapping Tools)软件。GMT具体安装步骤可参考:GMT中文手册[1]。需要注意的是,现阶段pygmt还不能完全支持GMT所能绘制的全部图表类型,后续更新会持续完善。本期推文主要是对Python-pygmt的一个介绍,主要内容如下:
Python-pygmt安装
Python-pygmt 示例绘制
Python-pygmt安装
之所以这里专门介绍pygmt库安装,是因为该库最好使用Anaconda进行安装,且需单独的进行pygmt运行环境的搭建。pygmt官网推荐安装脚本语句如下(默认GMT已安装):
conda create --name pygmt --channel conda-forge pygmt在使用如下语句激活刚构建的pygmt虚拟环境:
conda activate pygmt「注意」:这里小编建议在使用Python进行空间图表绘制时,最好是单独构建虚拟环境,避免依赖库版本冲突问题。
Python-pygmt 示例绘制
这一个部分小编主要介绍pygmt现阶段所能绘制的主要图表类型,主要内容如下:
Shorelines(海岸线)
fig = pygmt.Figure()
fig.basemap(region="g", projection="W15c", frame=True)
fig.coast(shorelines=True)
fig.show()
data points(气泡图)
fig = pygmt.Figure()
fig.basemap(region=region, projection="M15c", frame=True)
fig.coast(land="black", water="skyblue")
pygmt.makecpt(cmap="viridis", series=[data.depth_km.min(), data.depth_km.max()])
fig.plot(
    x=data.longitude,
    y=data.latitude,
    size=0.02 * 2**data.magnitude,
    color=data.depth_km,
    cmap=True,
    style="cc",
    pen="black",
)
fig.colorbar(frame='af+l"Depth (km)"')
fig.show()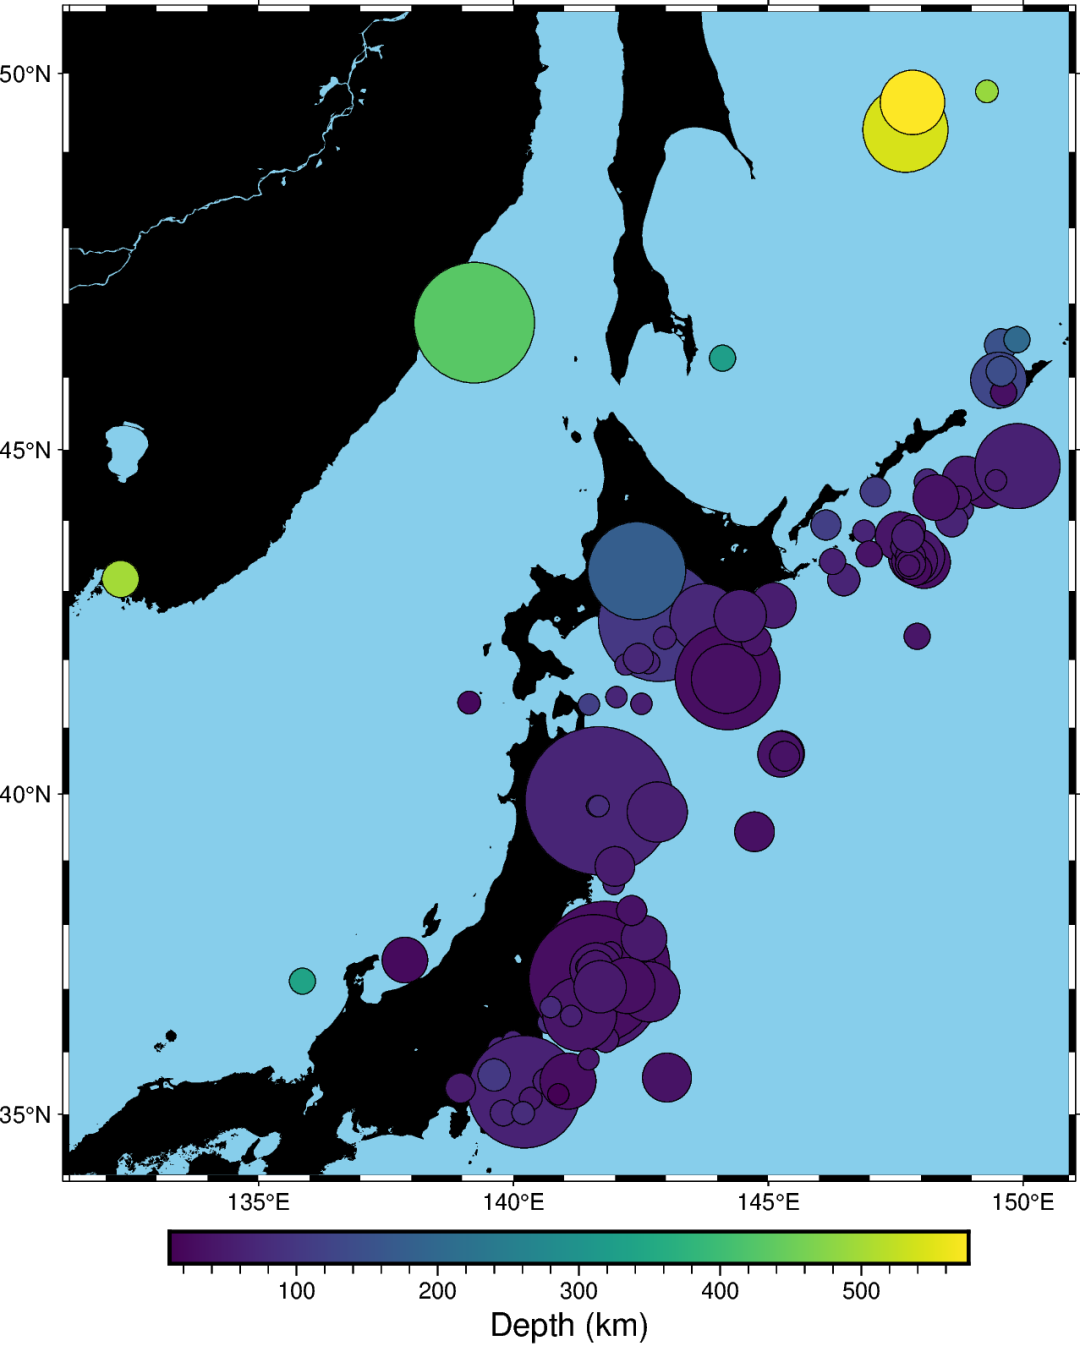
map with contour lines
fig = pygmt.Figure()
fig.grdimage(
    grid=grid,
    cmap="haxby",
    projection="M10c",
    frame=True,
)
fig.grdcontour(
    annotation=1000,
    interval=250,
    grid=grid,
    limit=[-4000, -2000],
)
fig.show()
Roads
import geopandas as gpd
import pygmt

# Read shapefile data using geopandas
gdf = gpd.read_file(
    "http://www2.census.gov/geo/tiger/TIGER2015/PRISECROADS/tl_2015_15_prisecroads.zip"
)
# The dataset contains different road types listed in the RTTYP column,
# here we select the following ones to plot:
roads_common = gdf[gdf.RTTYP == "M"]  # Common name roads
roads_state = gdf[gdf.RTTYP == "S"]  # State recognized roads
roads_interstate = gdf[gdf.RTTYP == "I"]  # Interstate roads

fig = pygmt.Figure()

# Define target region around O'ahu (Hawai'i)
region = [-158.3, -157.6, 21.2, 21.75]  # xmin, xmax, ymin, ymax

title = r"Main roads of O\047ahu (Hawai\047i)"  # \047 is octal code for '
fig.basemap(region=region, projection="M12c", frame=["af", f'WSne+t"{title}"'])
fig.coast(land="gray", water="dodgerblue4", shorelines="1p,black")

# Plot the individual road types with different pen settings and assign labels
# which are displayed in the legend
fig.plot(data=roads_common, pen="5p,dodgerblue", label="CommonName")
fig.plot(data=roads_state, pen="2p,gold", label="StateRecognized")
fig.plot(data=roads_interstate, pen="2p,red", label="Interstate")

# Add legend
fig.legend()

fig.show()
Blockmean
import pygmt

# Load sample data
data = pygmt.datasets.load_sample_data(name="japan_quakes")
# Select only needed columns
data = data[["longitude", "latitude", "depth_km"]]

# Set the region for the plot
region = [130, 152.5, 32.5, 52.5]
# Define spacing in x and y direction (150 by 150 minute blocks)
spacing = "150m"

fig = pygmt.Figure()

# Calculate mean depth in km from all events within 150x150 minute
# bins using blockmean
df = pygmt.blockmean(data=data, region=region, spacing=spacing)
# convert to grid
grd = pygmt.xyz2grd(data=df, region=region, spacing=spacing)

fig.grdimage(
    grid=grd,
    region=region,
    frame=["af", '+t"Mean earthquake depth inside each block"'],
    cmap="batlow",
)
# plot slightly transparent landmasses on top
fig.coast(land="darkgray", transparency=40)
# plot original data points
fig.plot(
    x=data.longitude, y=data.latitude, style="c0.3c", color="white", pen="1p,black"
)
fig.colorbar(frame=["x+lkm"])

fig.shift_origin(xshift="w+5c")

# Calculate number of total locations within 150x150 minute bins via
# blockmean's summary parameter
df = pygmt.blockmean(data=data, region=region, spacing=spacing, summary="n")
grd = pygmt.xyz2grd(data=df, region=region, spacing=spacing)

fig.grdimage(
    grid=grd,
    region=region,
    frame=["af", '+t"Number of points inside each block"'],
    cmap="batlow",
)
fig.coast(land="darkgray", transparency=40)
fig.plot(
    x=data.longitude, y=data.latitude, style="c0.3c", color="white", pen="1p,black"
)
fig.colorbar(frame=["x+lcount"])

fig.show()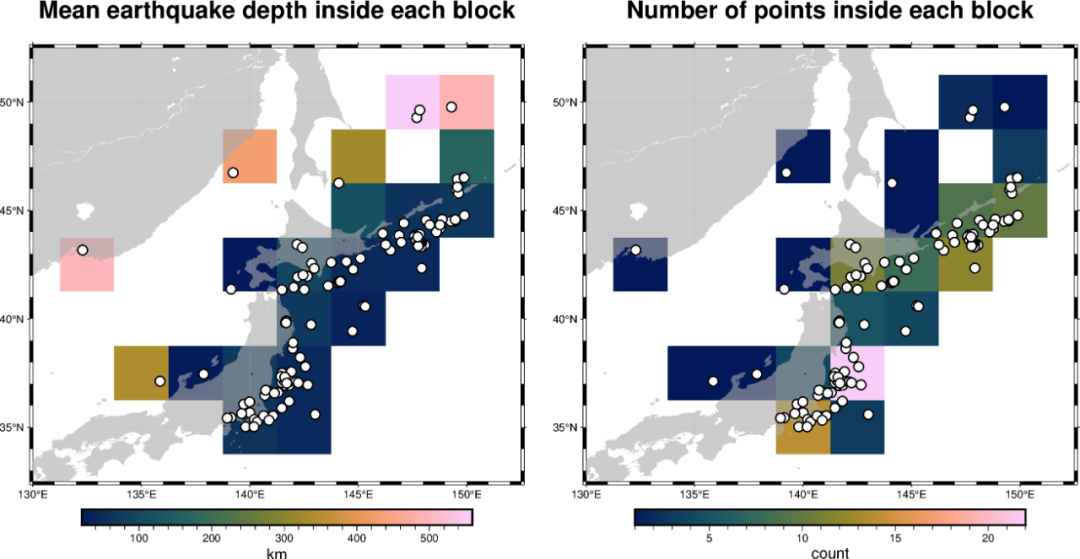
以上就是小编简单介绍的关于Python-pygmt库常用科研地图绘制类型,更多其他图表类型,大家可参考:Python-pygmt官网例子[2]
总结
今天的这篇推文,小编介绍了Python语言中一个强大的地图绘制工具-pygmt,该库基于绘图功能强大的GMT工具,与之相比,绘图脚本更加简单和易理解,感兴趣的小伙伴可以好好学习下哈,小编也会收录该库绘制带地图类型哈~~
参考资料
[1]
GMT中文手册: https://docs.gmt-china.org/latest/。
[2]Python-pygmt官网例子: https://www.pygmt.org/latest/gallery/index.html。
-------- End --------

精选内容


边栏推荐
- gateway gateway cross domain
- Raspberry pie arm version of GCC installed configuration and environment variables
- Summary of MVCC
- HIRO: Hierarchical Reinforcement Learning 】 【 Data - Efficient Hierarchical Reinforcement Learning
- 被 CSDN,伤透了心
- 785. Quick Sort
- ECCV2022 Workshop | Multi-Object Tracking and Segmentation in Complex Environments
- Google engineer fired for claiming AI awareness: breach of nondisclosure agreement
- 手写二叉查找树及测试
- Talking about hardware device computing storage and data interaction
猜你喜欢
Summary of JVM interview questions (continuously updated)
你需要知道的 TCP 四次挥手
RTL8762DK PWM(七)
RTL8762DK PWM (seven)

By CSDN, torn

Raspberry pie arm version of GCC installed configuration and environment variables

Beijing suddenly announced that yuan universe big news
Basic implementation of vector
机器学习应该如何入门?

Detailed explanation of TCP protocol
随机推荐
Blueprint: Yang Hui's Triangular Arrangement
更换树莓派内核
彻底关闭Chrome浏览器更新及右上角的更新提示
元宇宙改变人类工作模式的四种方式
【密码学/密码分析】基于TMTO的密码分析方法
如何下载Keil包
ROS2 series of knowledge (4): understand the concept of [service]
RTL8762DK RTC (5)
leetcode:1562. 查找大小为 M 的最新分组【模拟 + 端点记录 + 范围合并】
2022 CSP-J1 CSP-S1 Round 1 Preliminary Competition Registration Guide
[Data analysis] Based on matlab GUI student achievement management system [including Matlab source code 1981]
MYSQL two-phase commit
解决安装MySQL后,Excel打开很慢的问题
初出茅庐的小李第112篇博客项目笔记之机智云智能浇花器实战(1)-基础Demo实现
SC7A20 (Silan Micro-Accelerometer) Example
RTL8762DK WDG (six)
设备树的树形结构到底是怎样体现的?
Key Points Estimation and Point Instance
普通用户无法访问hgfs目录
Compiled on unbutu with wiringPi library and run on Raspberry Pi