Preface
logistic Return to , Is a classification algorithm , Can handle binary classification , Multivariate classification . We use sklearn Medium logistic Practice handwritten digit recognition .
Data sets
MNIST The data set is from the National Institute of standards and technology , Training set by 250 Handwritten digits from different people ,50% High school students ,50% From the Census Bureau .
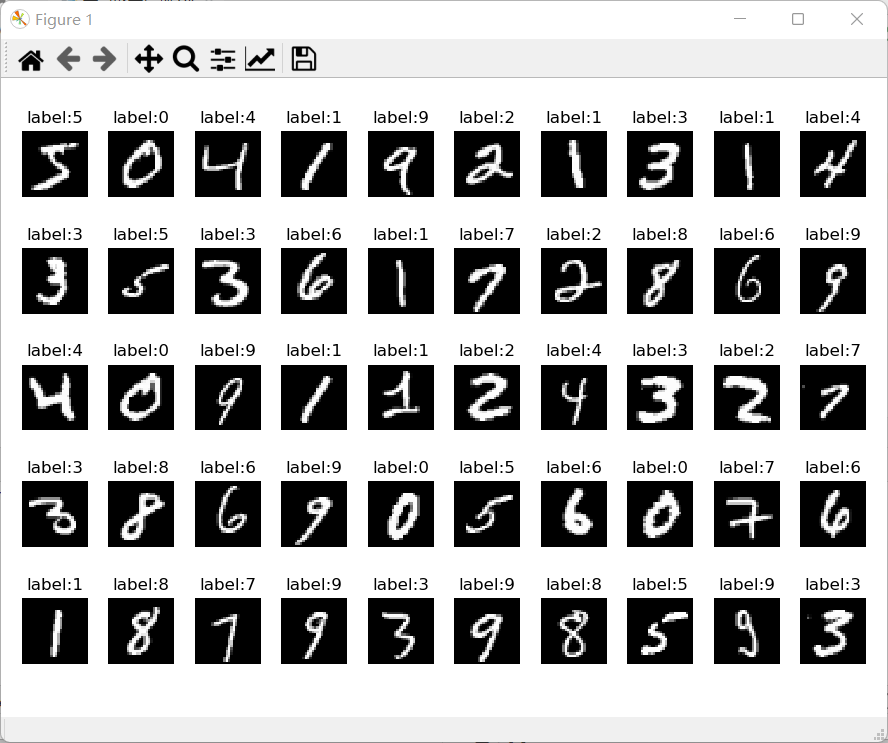
Data set presentation
Dataset Download
Baidu cloud disk :
link :https://pan.baidu.com/s/1ZBU8XBsx7lp7gdN4ySSIWg
Extraction code :5mrf
About use pycharm Picture not shown
pycharm By default, the drawing will be carried out on the right , For some reason, the picture cannot be displayed , It can only be the solution of white map .
We can first adjust the picture display to the independent picture frame display .file->settings->Tools->Python Scientific Uncheck the show plots in tool window.
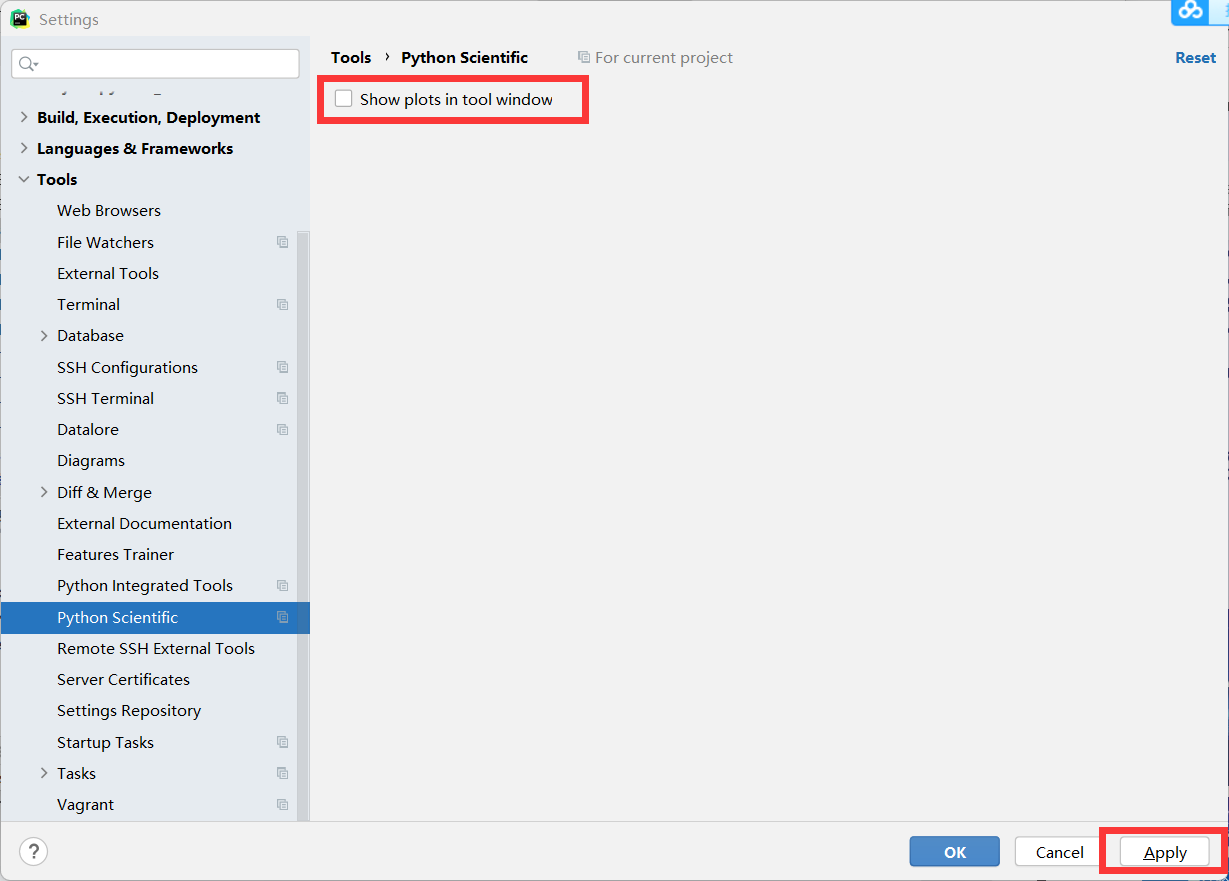
After the above operations, the picture box will pop up independently for drawing , If it still cannot be displayed, you can do the following .
find Configure subplots
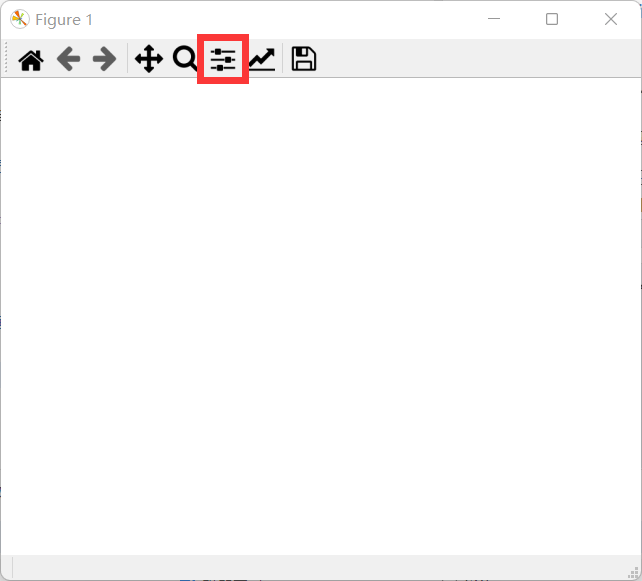
Click compact layout , Can show , It may not be displayed before because the figure is too large , As a result, we didn't see .
- Of course, you can also adjust the layout by yourself , Row spacing, column spacing and so on .
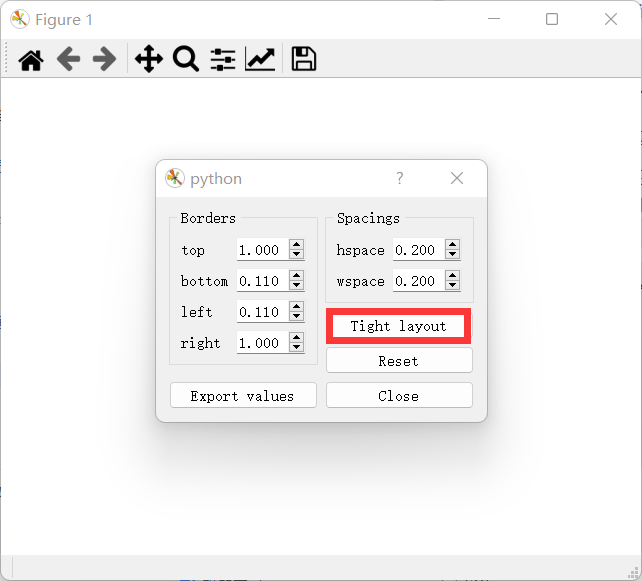
- Of course, you can also adjust the layout by yourself , Row spacing, column spacing and so on .
Logical regression handwritten numeral recognition
## logistis Return to , Is a classification algorithm , Can handle binary classification , Multivariate classification .
##  First of all, the logical regression constructs the prefixed linear regression function , And then use sigmoid Function maps regression values to hash categories


## sklearn  Classification algorithm and handwritten numeral recognition

##  Data is introduced
## MNIST The data set is from the National Institute of standards and technology , Training set by 250 Handwritten digits from different people ,50% High school students ,50% From the Census Bureau


##  Guide pack

import struct,os
import numpy as np
from array import array as pyarray
from numpy import append,array,int8,uint8,zeros

import matplotlib.pyplot as plt

from sklearn.metrics import accuracy_score, classification_report
from sklearn.linear_model import LogisticRegression

##  Load data set
def load_mnist(image_file,label_file,path="mnist"):
    digits=np.arange(10)

    fname_image = os.path.join(path,image_file)
    fname_label = os.path.join(path, label_file)

    flbl = open(fname_label,'rb')
    magic_nr, size = struct.unpack(">II", flbl.read(8))
    lbl = pyarray("b",flbl.read())
    flbl.close()

    fimg = open(fname_image,'rb')
    magic_nr, size, rows, cols = struct.unpack(">IIII", fimg.read(16))
    img = pyarray("B",fimg.read())
    fimg.close()

    ind = [ k for k in range(size) if lbl[k] in digits ]
    N = len(ind)

    images = zeros((N, rows*cols),dtype = uint8)
    labels = zeros((N,1), dtype = int8)
    for i in range(len(ind)):
        images[i] = array(img[ind[i]*rows*cols : (ind[i]+1)*rows*cols]).reshape((1,rows*cols))
        labels[i] = lbl[ind[i]]

    return images,labels


train_image, train_label = load_mnist('train-images.idx3-ubyte', 'train-labels.idx1-ubyte')
test_image, test_label = load_mnist('t10k-images.idx3-ubyte','t10k-labels.idx1-ubyte')


##  Data presentation
## 28*28

def show_image(imgdata, imgtarget, show_column, show_row,titlename):
    for index, (im, it) in enumerate(list(zip(imgdata, imgtarget))):
        xx = im.reshape(28,28)
        plt.subplots_adjust(left=1, bottom=None, right=3,top=2, wspace=None, hspace=None)
        plt.subplot(show_row,show_column,index+1)

        plt.axis('off')
        plt.imshow(xx, cmap='gray', interpolation='nearest')
        plt.title(titlename+':%i' % it)

    # plt.savefig(titlename+'.png')
    #  There may be a warning in this place , Maybe the picture is too big , But that's okay , The code works
    plt.show()


show_image(train_image[:50], train_label[:50],10,5,'label')

## sklearn  Classification model
##  Data normalization

train_image = [im/255.0 for im in train_image]
test_image = [im/255.0 for im in test_image]

print(len(train_image))
print(len(test_image))
print(len(train_label))
print(len(test_label))


##  Model classification
##  Model instantiation
lr = LogisticRegression(max_iter=1000)
##  model training
lr.fit(train_image,train_label.ravel())

##  Model validation
predict = lr.predict(test_image)

print("accuracy score: %.4lf"% accuracy_score(predict,test_label))
print("classfication report for %s:\n%s\n"%(lr, classification_report(test_label, predict)))


show_image(test_image[:100],predict,10,10,'predict')
Result display
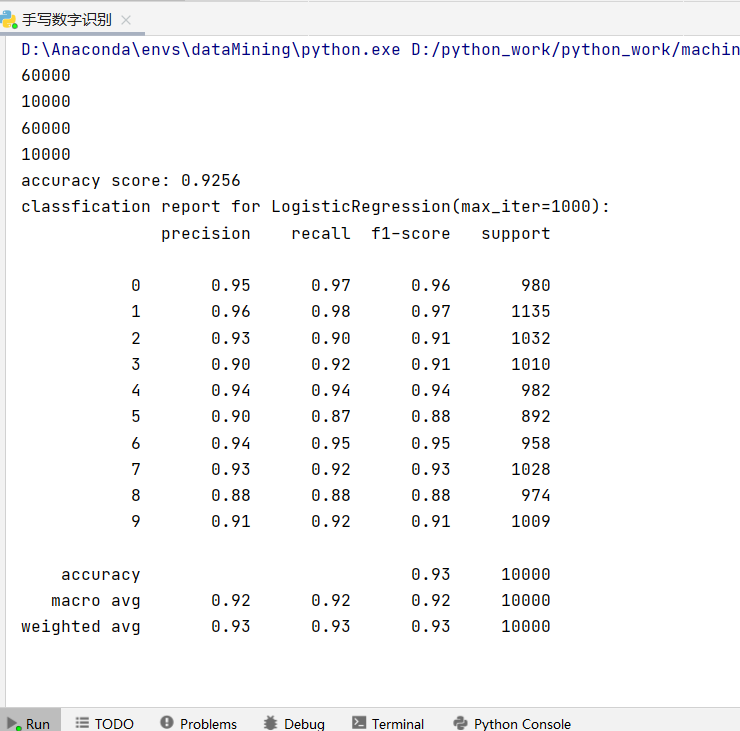
- Model training information
- You can see
- Accuracy :0.9256
- Maximum training times 1000 Time
- precision 、 Average 、 Weighted average, etc
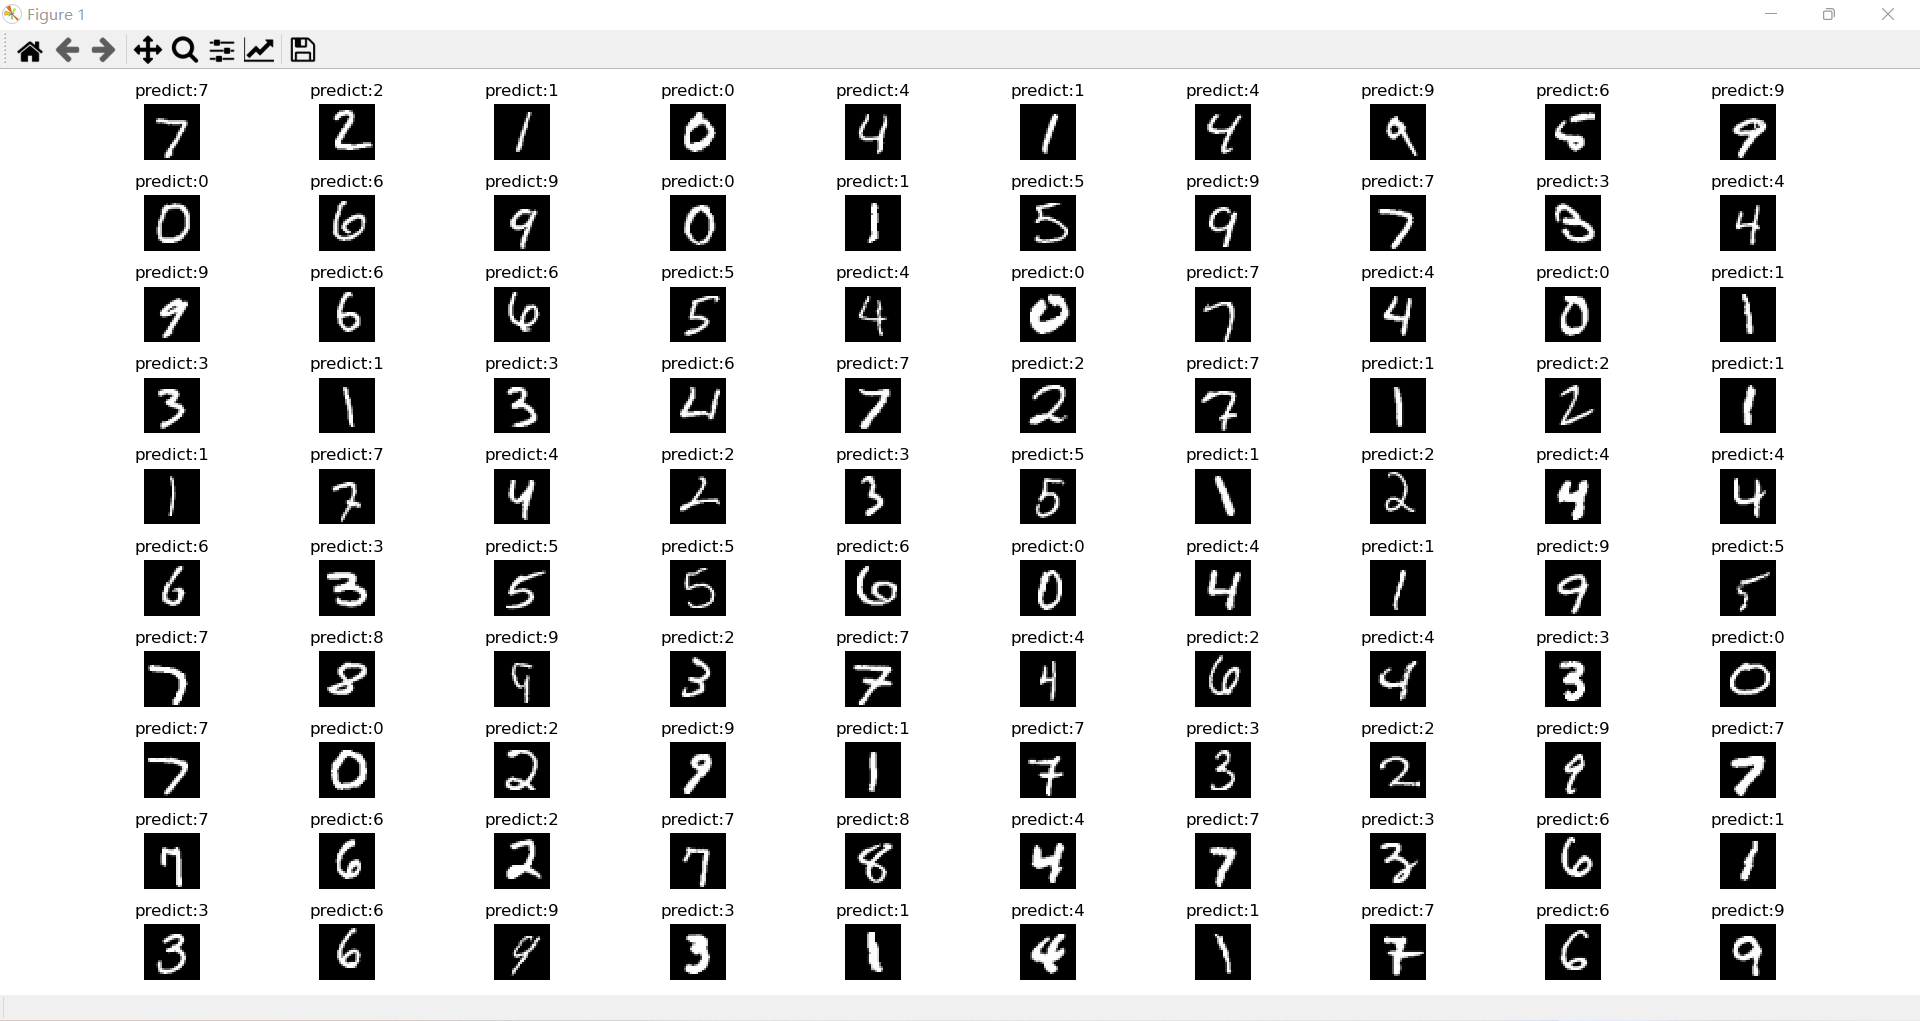
- Recognition effect display
analysis
We showed 100 The recognition effect of pictures , Can find 3 Zhang's obvious recognition error , Similar to the evaluation results of the model .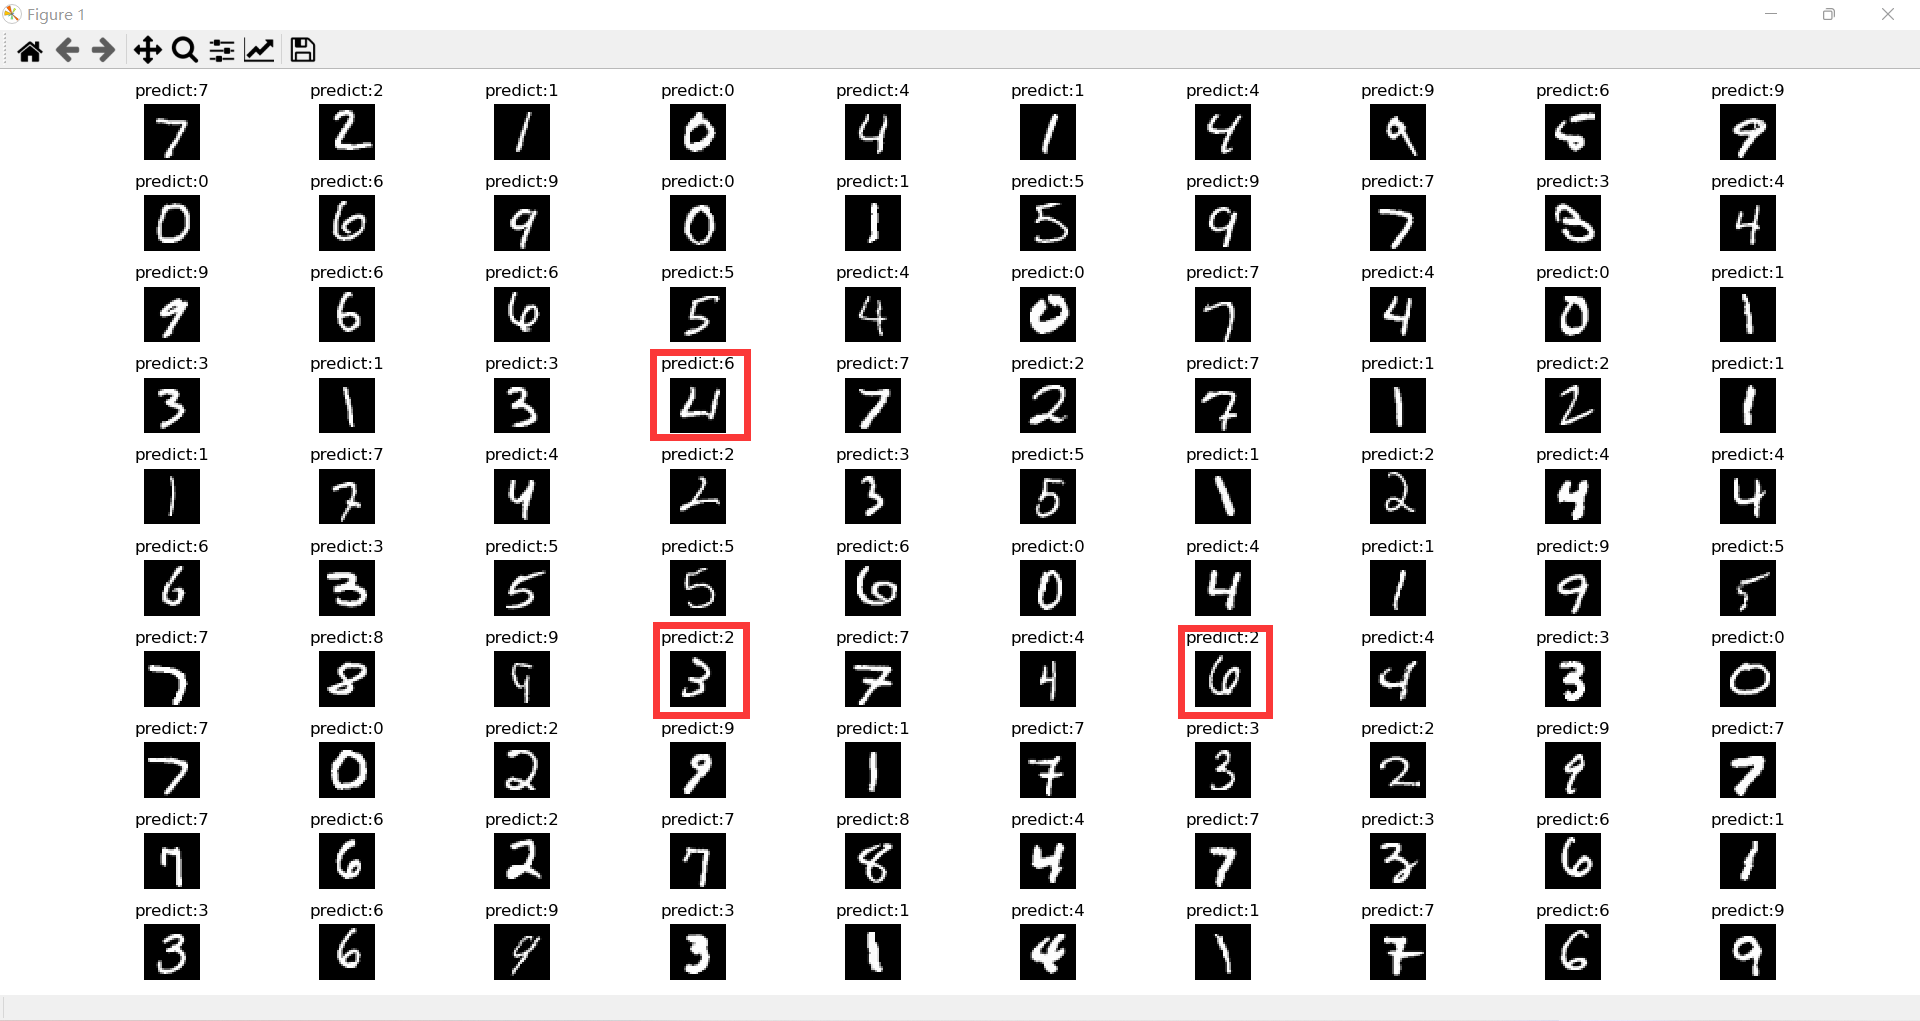
summary
We can run it several times and find that the result has not changed , That's probably the same thing logistic The shortcomings of return , We can also use neural network to recognize handwritten digits , But that is the content of deep learning , We will implement it later .