当前位置:网站首页>HOW TO CREATE A BEAUTIFUL INTERACTIVE HEATMAP IN R
HOW TO CREATE A BEAUTIFUL INTERACTIVE HEATMAP IN R
2022-07-02 11:50:00 【Xiaoyu 2022】
install.packages("heatmaply")
library("heatmaply")
df <- normalize(mtcars)
heatmaply(df)
install.packages("heatmaply")
library("heatmaply")
df <- normalize(mtcars)
ggheatmap(df)
gplots::heatmap.2(
  as.matrix(df),
  trace = "none",
  col = viridis(100),
  key = FALSE
)
install.packages("heatmaply")
library("heatmaply")
df <- normalize(mtcars)
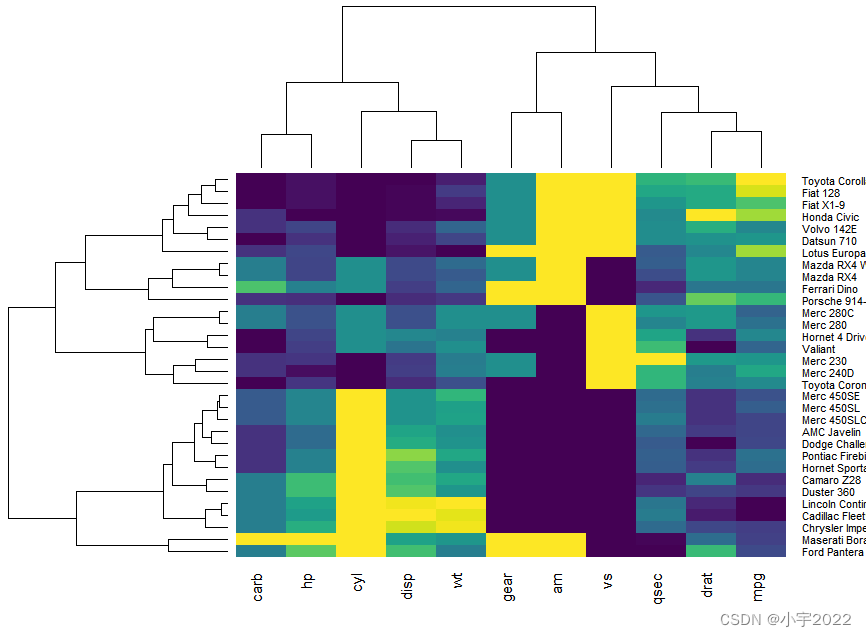
heatmaply(
as.matrix(df),
seriate = "mean",
row_dend_left = TRUE,
plot_method = "plotly"
)

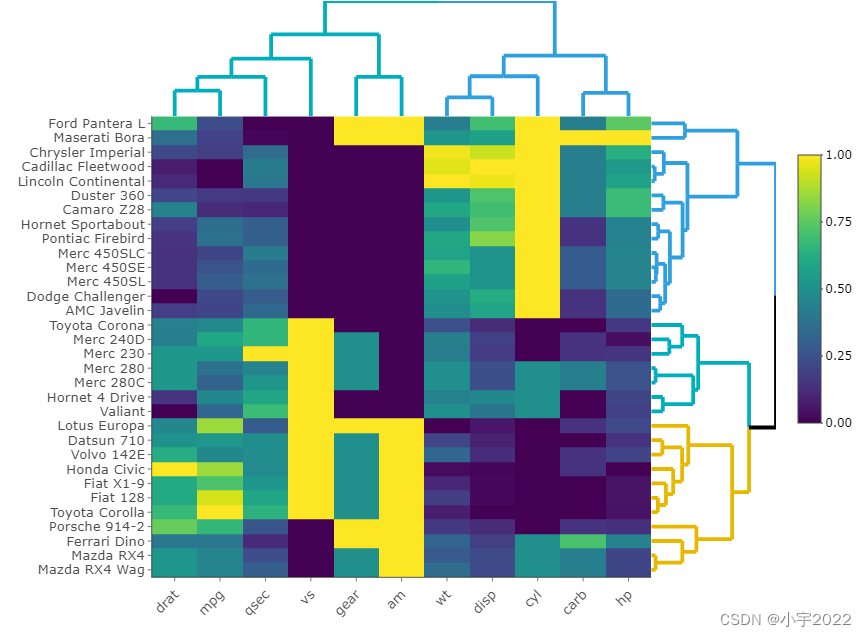
install.packages("heatmaply")
library("heatmaply")
df <- normalize(mtcars)
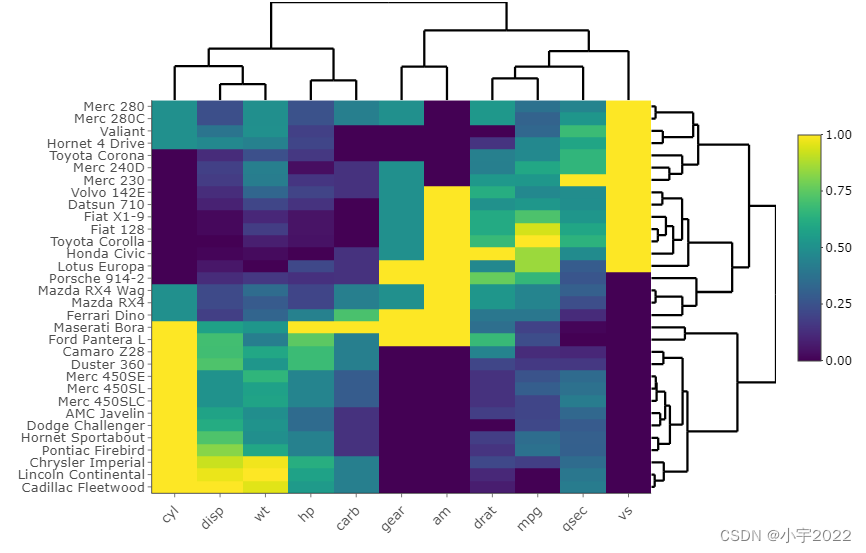
heatmaply(
df,
k_col = 2,
k_row = 2
)
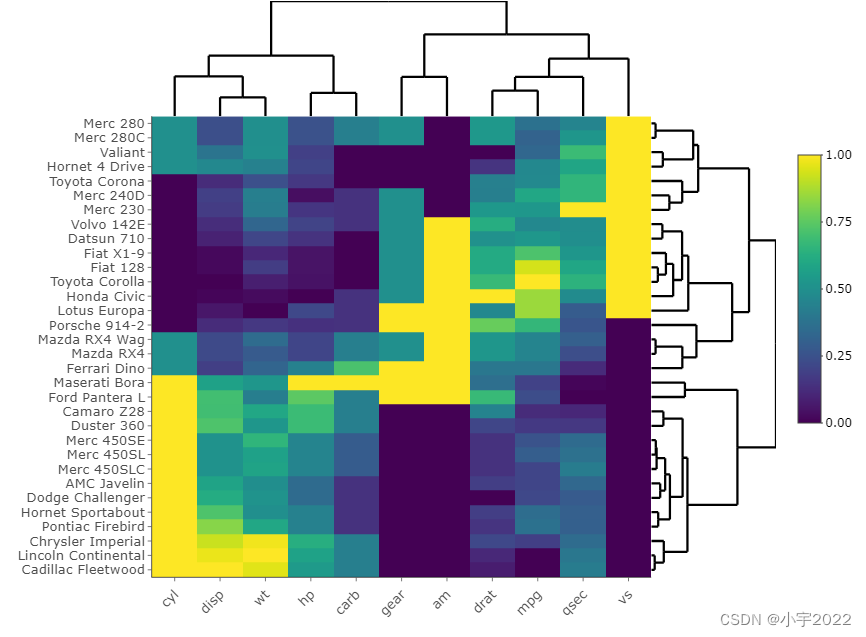
install.packages("heatmaply")
library("heatmaply")
df <- normalize(mtcars)
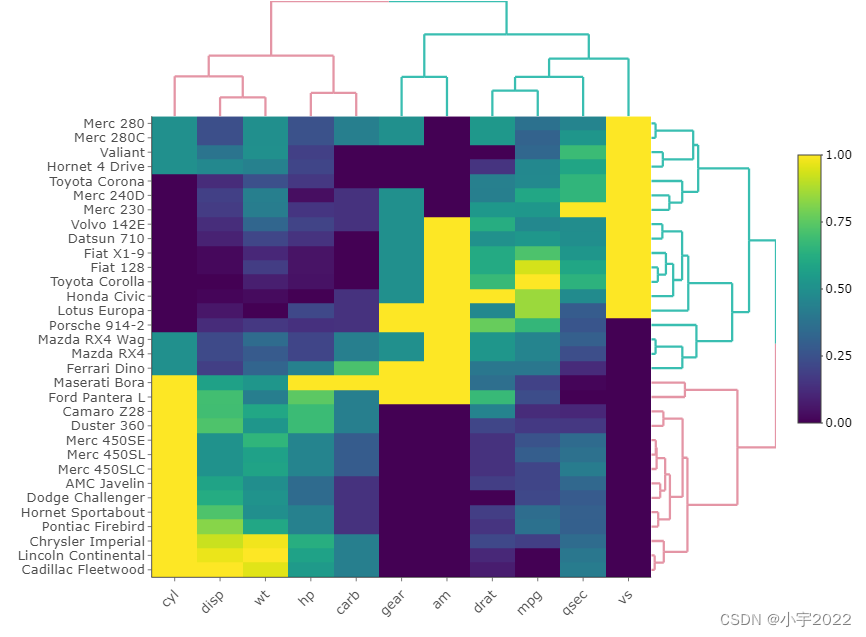
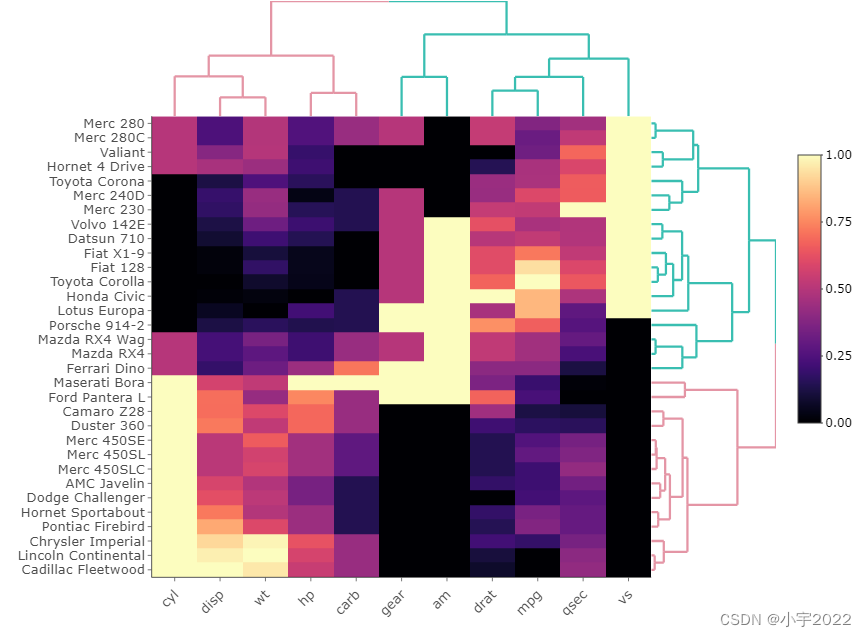
heatmaply(
df,
colors = viridis(n = 256, option = "magma"),
k_col = 2,
k_row = 2
)
install.packages("heatmaply")
library("heatmaply")
df <- normalize(mtcars)
library(RColorBrewer)
heatmaply(
  df,
  colors = colorRampPalette(brewer.pal(3, "RdBu"))(256),
  k_col = 2,
  k_row = 2
)

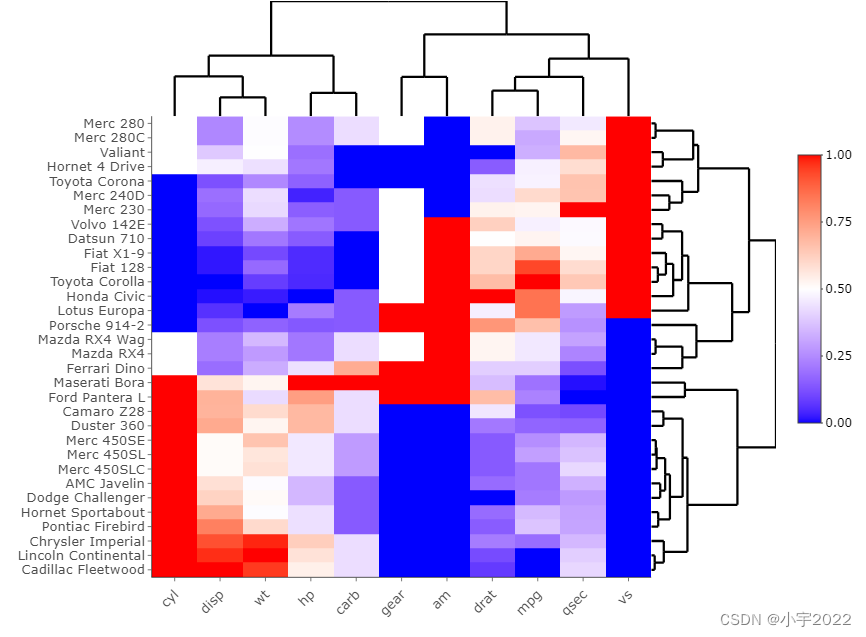
install.packages("heatmaply")
library("heatmaply")
df <- normalize(mtcars)
gradient_col <- ggplot2::scale_fill_gradient2(
  low = "blue", high = "red",
  midpoint = 0.5, limits = c(0, 1)
)
heatmaply(
  df,
  scale_fill_gradient_fun = gradient_col
)
library(dendextend)
# Create dendrogram for rows
mycols <- c("#2E9FDF", "#00AFBB", "#E7B800", "#FC4E07")
row_dend <-  df %>%
  dist() %>%
  hclust() %>%
  as.dendrogram() %>%
  set("branches_lwd", 1) %>%
  set("branches_k_color", mycols[1:3], k = 3)

# Create dendrogram for columns
col_dend <-  df %>%
  t() %>%
  dist() %>%
  hclust() %>%
  as.dendrogram() %>%
  set("branches_lwd", 1) %>%
  set("branches_k_color", mycols[1:2], k = 2)
heatmaply(
  df,
  Rowv = row_dend,
  Colv = col_dend
)
library(dendextend)
# Create dendrogram for rows
mycols <- c("#2E9FDF", "#00AFBB", "#E7B800", "#FC4E07")
row_dend <-  df %>%
  dist() %>%
  hclust() %>%
  as.dendrogram() %>%
  set("branches_lwd", 1) %>%
  set("branches_k_color", mycols[1:3], k = 3)

# Create dendrogram for columns
col_dend <-  df %>%
  t() %>%
  dist() %>%
  hclust() %>%
  as.dendrogram() %>%
  set("branches_lwd", 1) %>%
  set("branches_k_color", mycols[1:2], k = 2)
heatmaply(
  df[, -c(8, 9)],
  col_side_colors = c(rep(0, 5), rep(1, 4)),
  row_side_colors = df[, 8:9]
)

library(dendextend)
# Create dendrogram for rows
mycols <- c("#2E9FDF", "#00AFBB", "#E7B800", "#FC4E07")
row_dend <- df %>%
dist() %>%
hclust() %>%
as.dendrogram() %>%
set("branches_lwd", 1) %>%
set("branches_k_color", mycols[1:3], k = 3)
# Create dendrogram for columns
col_dend <- df %>%
t() %>%
dist() %>%
hclust() %>%
as.dendrogram() %>%
set("branches_lwd", 1) %>%
set("branches_k_color", mycols[1:2], k = 2)
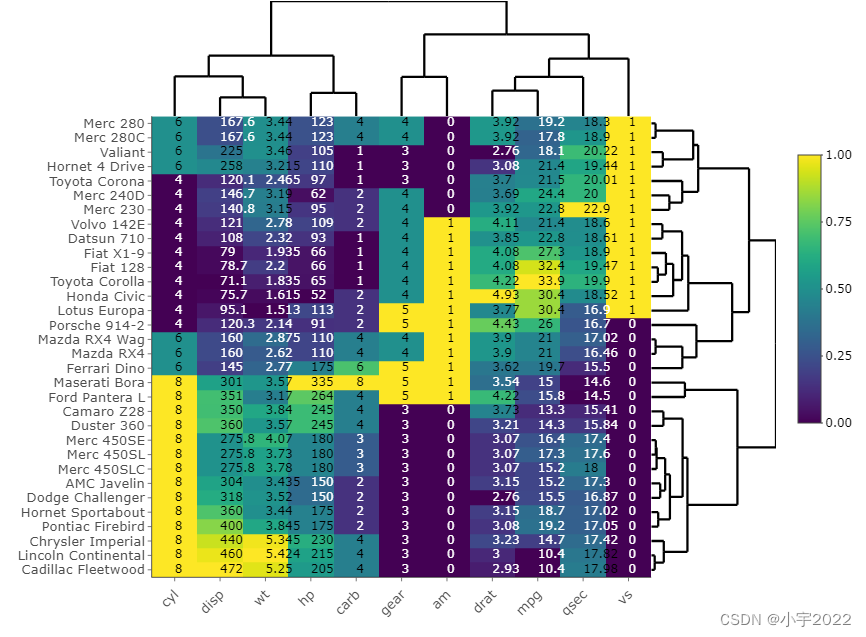
heatmaply(df, cellnote = mtcars)
library(dendextend)
# Create dendrogram for rows
mycols <- c("#2E9FDF", "#00AFBB", "#E7B800", "#FC4E07")
mat <- df
mat[] <- paste("This cell is", rownames(mat))
mat[] <- lapply(colnames(mat), function(colname) {

  paste0(mat[, colname], ", ", colname)
})
heatmaply(
  df,
  custom_hovertext = mat
)
边栏推荐
- QT获取某个日期是第几周
- Some problems encountered in introducing lvgl into esp32 Arduino
- 通讯录的实现(文件版本)
- Astparser parsing class files with enum enumeration methods
- Webauthn - official development document
- Is it safe to open a stock account online? I'm a novice, please guide me
- YYGH-BUG-04
- Develop scalable contracts based on hardhat and openzeppelin (I)
- Digital transformation takes the lead to resume production and work, and online and offline full integration rebuilds business logic
- GGPlot Examples Best Reference
猜你喜欢
Map set assignment to database

在连接mysql数据库的时候一直报错

Seriation in R: How to Optimally Order Objects in a Data Matrice

Amazon cloud technology community builder application window opens
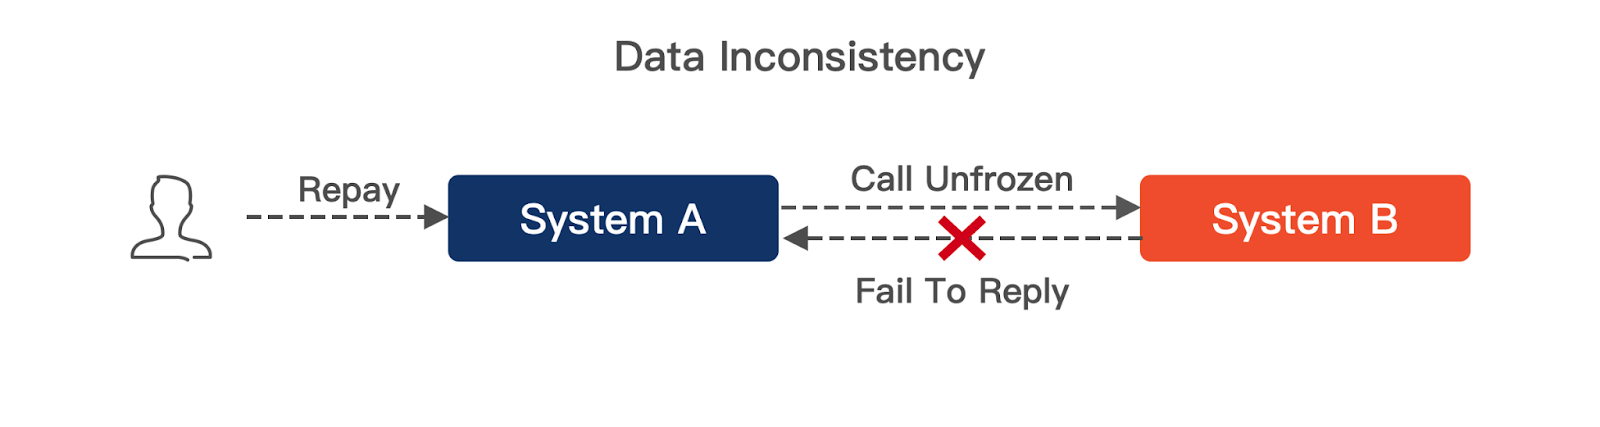
A sharp tool for exposing data inconsistencies -- a real-time verification system

ESP32存储配网信息+LED显示配网状态+按键清除配网信息(附源码)
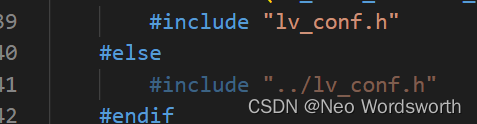
ESP32 Arduino 引入LVGL 碰到的一些问题

GGPUBR: HOW TO ADD ADJUSTED P-VALUES TO A MULTI-PANEL GGPLOT

TDSQL|就业难?腾讯云数据库微认证来帮你

可昇級合約的原理-DelegateCall
随机推荐
R HISTOGRAM EXAMPLE QUICK REFERENCE
The position of the first underline selected by the vant tabs component is abnormal
Astparser parsing class files with enum enumeration methods
Summary of data export methods in powerbi
php 根据经纬度查询距离
GGPUBR: HOW TO ADD ADJUSTED P-VALUES TO A MULTI-PANEL GGPLOT
Pyqt5+opencv project practice: microcirculator pictures, video recording and manual comparison software (with source code)
Always report errors when connecting to MySQL database
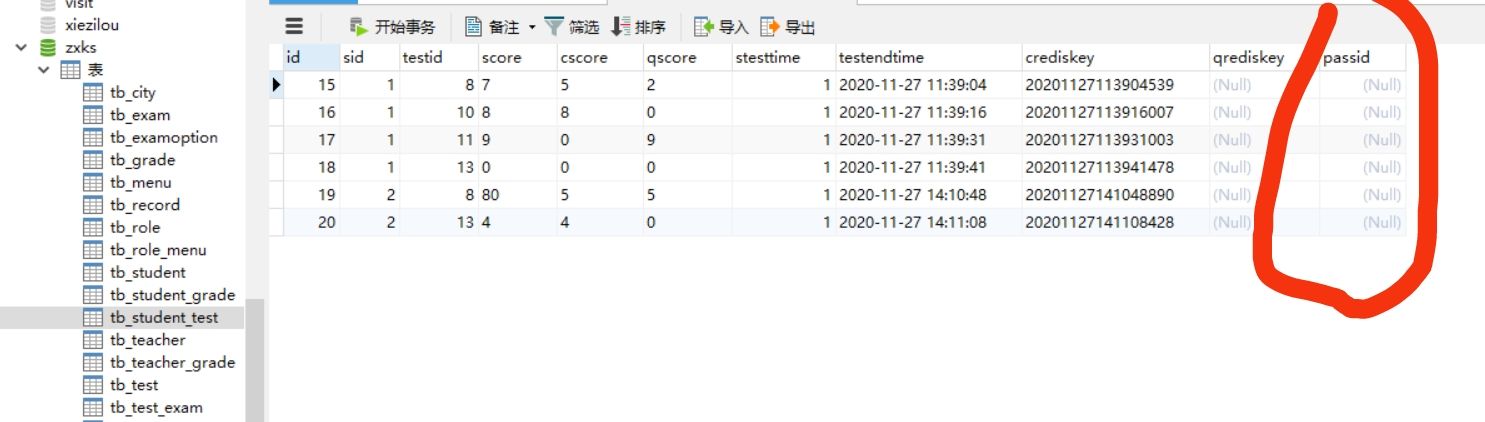
mysql链表数据存储查询排序问题
R HISTOGRAM EXAMPLE QUICK REFERENCE
CTF record
揭露数据不一致的利器 —— 实时核对系统
动态内存(进阶四)
Wechat applet uses Baidu API to achieve plant recognition
YYGH-BUG-04
Develop scalable contracts based on hardhat and openzeppelin (II)
Mmrotate rotation target detection framework usage record
行業的分析
ROS lacks catkin_ pkg
Cluster Analysis in R Simplified and Enhanced