当前位置:网站首页>2020 Bioinformatics | GraphDTA: predicting drug target binding affinity with graph neural networks
2020 Bioinformatics | GraphDTA: predicting drug target binding affinity with graph neural networks
2022-07-06 22:02:00 【Stunned flounder (】
2020 Bioinformatics | GraphDTA: predicting drug target binding affinity with graph neural networks
Paper: https://academic.oup.com/bioinformatics/article/37/8/1140/5942970?login=false
Code:https://github.com/thinng/GraphDTA
Abstract
High development cost of new drugs 、 Time consuming , And often accompanied by security issues . Drug reuse can avoid expensive and lengthy drug development processes by finding new uses for approved drugs . In order to effectively reuse drugs , It is useful to know which proteins are targeted by which drugs . Estimate new drugs - The calculation model of target pair interaction intensity may speed up drug reuse . Several models have been proposed for this task . However , These models represent drugs as strings , This is not the natural way to express molecules . We put forward a proposal called GraphDTA It represents drugs as graphs , Graphical neural network is used to predict the affinity between drugs and targets . We show that , Figure neural network not only predicts drugs better than non deep learning model - Target affinity , And it is better than the competitive deep learning method . Our results confirm , The deep learning model is applicable to drugs - Prediction of target binding affinity , And representing drugs as graphs can lead to further improvements .
Introduce
medicine - Target affinity (DTA) There are several methods of prediction and calculation :
- molecular docking , It predicts drugs by scoring function - Stability of the target complex 3D structure .
- Using collaborative filtering . for example ,SimBoost The model uses affinity similarity between drugs and targets to construct new features .
- Use neural networks trained on one-dimensional representations of drug and protein sequences . for example ,DeepDTA The model uses one-dimensional representation and one-dimensional convolution ( With pooling ) To capture prediction patterns in the data
Drug characterization
SMILES It can be done by rdkit Open source software generation graph In the form of , Then, the drug eigenvector is obtained by graph convolution network representation learning . Each node is a multidimensional 01 Eigenvector , Expressed five messages : Atomic symbols 、 Number of adjacent atoms 、 Number of adjacent hydrogen atoms 、 The implied value of the atom 、 Whether the atom is in the aromatic structure .
Protein characterization
Because it is difficult to represent the structure of protein diagram , Protein results are characterized by one-hot Coding means . The gene name of the target is from UniProt Get the protein sequence from the database . The sequence is a string representing amino acids ASCII character . Each amino acid type is encoded with an integer according to its associated alphabetic symbol [ for example , Alanine (A) by 1, Cystine by 3, Aspartic acid (D) by 4, And so on ], So that the protein can be expressed as an integer sequence .
Molecular graph model structure
The author proposes a new graph based neural network and traditional CNN Of DTA prediction model . As shown in the figure below . First, classify and code the protein sequence , Then add the embedded layer to the sequence , Each of them ( code ) The characters are 128 The dimension vector represents . Next , Use three 1D Convolution layer learns different levels of abstract features from input . Last , The expression vector of the input protein sequence is obtained by using the maximum pooling layer . This method is similar to the existing baseline model . For drugs , We used molecular graphs and tested four graph neural network variants , Include GCN ( Kipf and Welling, 2017 )、GAT ( Veličković et al., 2018 ))、GIN ( Xu et al., 2019 ) And combined GAT-GCN framework .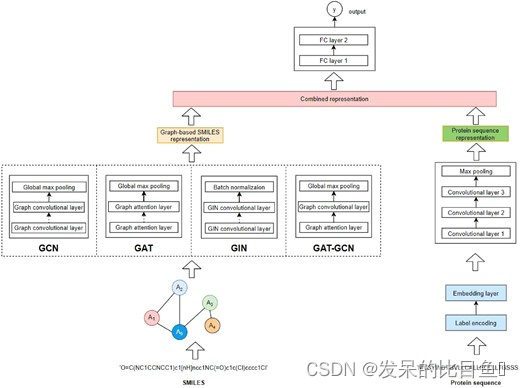
Experiments and results
Researchers mainly compare the non deep learning model with the more popular deep learning model , The consistency index is calculated by measurement CI( Indicates the consistency between predicted and actual values ) And mean square error MSE These two indicators represent the quality of the model . In order to make the experimental results more comparative , Respectively in Davis And Kiba Data sets measure the model .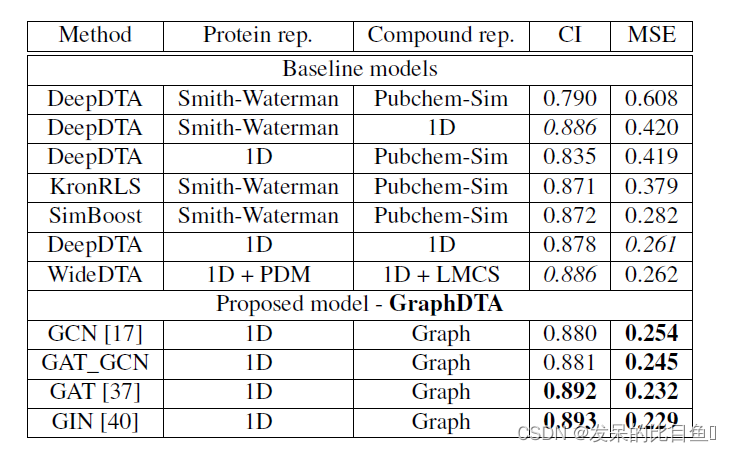
Davis Data set model measurement results 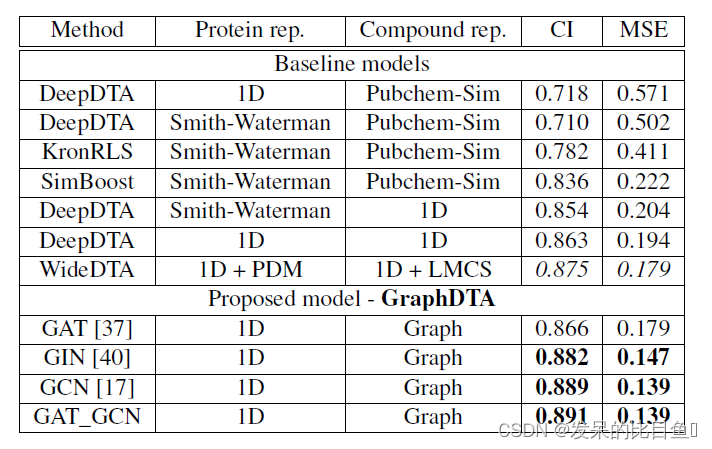
The measurement results in both data sets are based on GAT-GCN The combined graph representation model has the best prediction performance .
Conclusion
In this work , Researchers have come up with a computational drug - A new method of target binding affinity , be called GraphDTA; To make drug development less difficult , Reduce the time and cost of finding new drug target interactions , Shorten the drug development cycle . The model is used by SMILES Two dimensional graph structure data from data reconstruction , It can express more complete information of drugs , So this method can get better prediction performance .
Reference resources
边栏推荐
- Guava: three ways to create immutablexxx objects
- hdu 4912 Paths on the tree(lca+馋)
- [Chongqing Guangdong education] Tianjin urban construction university concrete structure design principle a reference
- PostgreSQL 安装gis插件 CREATE EXTENSION postgis_topology
- C how to set two columns comboboxcolumn in DataGridView to bind a secondary linkage effect of cascading events
- MPLS experiment
- Unity3d Learning Notes 6 - GPU instantiation (1)
- Xiaoman network model & http1-http2 & browser cache
- High precision face recognition based on insightface, which can directly benchmark hongruan
- GPS从入门到放弃(十二)、 多普勒定速
猜你喜欢

The golden age of the U.S. technology industry has ended, and there have been constant lamentations about chip sales and 30000 layoffs

Sequoia China, just raised $9billion

Digital transformation takes the lead to resume production and work, and online and offline full integration rebuilds business logic

爬虫实战(五):爬豆瓣top250
![[asp.net core] set the format of Web API response data -- formatfilter feature](/img/95/b7e7b5e9e9ac1d9295c17640beccb3.jpg)
[asp.net core] set the format of Web API response data -- formatfilter feature

数字化转型挂帅复产复工,线上线下全融合重建商业逻辑
ViT论文详解
小满网络模型&http1-http2 &浏览器缓存
![Happy sound 2[sing.2]](/img/ca/1581e561c427cb5b9bd5ae2604b993.jpg)
Happy sound 2[sing.2]
Write a rotation verification code annotation gadget with aardio
随机推荐
The golden age of the U.S. technology industry has ended, and there have been constant lamentations about chip sales and 30000 layoffs
[Chongqing Guangdong education] Tianjin urban construction university concrete structure design principle a reference
20 large visual screens that are highly praised by the boss, with source code templates!
Set status bar style demo
guava: Multiset的使用
Kohana database
1292_ Implementation analysis of vtask resume() and xtask resume fromisr() in freeros
Leetcode learning records (starting from the novice village, you can't kill out of the novice Village) ---1
bat脚本学习(一)
Powerful domestic API management tool
MongoDB(三)——CRUD
HDU 4912 paths on the tree (lca+)
Sequoia China, just raised $9billion
搜素专题(DFS )
在Pi和Jetson nano上运行深度网络,程序被Killed
一行代码可以做些什么?
NPM run dev start project error document is not defined
hdu 4912 Paths on the tree(lca+馋)
Mysql相关术语
Checkpoint of RDD in spark