当前位置:网站首页>Oracle Performance Analysis 3: introduction to tkprof
Oracle Performance Analysis 3: introduction to tkprof
2022-07-06 21:57:00 【Full stack programmer webmaster】
Hello everyone , I meet you again , I'm the king of the whole stack .
tkprof It is Oracle It comes with a command in line tool , Its main function is to trace the original file to the type of text file , for example , The easiest way , Use the following :
tkprof ly_ora_128636.trc ly_ora_128636.txttkprof With many parameters , In most cases , Using these parameters will be very helpful for your analysis .
tkprof Parameters
Suppose it is executed without any parameters tkprof, It will print out the complete parameter list , With a simple description . The following is a description of the parameters :
explain For every one SQL Statement provides a run plan .
This parameter needs to specify the user 、 password . You can also specify the database connection string , Such as :explain=user/[email protected]_string perhaps explain=user/password.
table Carton explain Parameters , Used to specify the table used to generate the run plan , It is usually not necessary to specify , Only when users cannot create tables ( In the absence of create table jurisdiction ). print Used to restrict output file generation SQL Number of statements , such as :print=10. aggregate Specify whether to process the same content separately SQL sentence . By default, it is not handled separately . Designated as aggregate=no, Look at each one alone SQL sentence .
insert Generate SQL Script ,SQL Scripts can be used to store information into databases ,SQL The name of the script is specified by the parameter , Such as :insert=load.sql. sys Appoint sys User executed SQL Whether the statement is also written to the output file , Default yes.
record Generate SQL Script . Included in trace All non recursive statements found in the file , The script name is specified by the parameter itself . such as :record=replay.sql.
waits Whether to add information about waiting events , Default join . sort Specify the SQL Order of statements . The default is trace Found in the document SQL The order .
Here's an example :
tkprof {input trace file} {output file} sys=no sort=prsela,exeela,fchelaprsela: The first cursor parsing takes time exeela: Time spent running against cursor fchela: The time it takes the cursor to get the data row
tkprof Output
The output file has a header , There are descriptions of parameters . For example, the following :
**********************************************************************
count    = number of times OCI procedure was executed
cpu      = cpu time in seconds executing
elapsed  = elapsed time in seconds executing
disk     = number of physical reads of buffers from disk
query    = number of buffers gotten for consistent read
current  = number of buffers gotten in current mode (usually for update)
rows     = number of rows processed by the fetch or execute call
**********************************************************************count: Number of database calls run cpu: Processing data calls takes CPU Time , In seconds elapsed: Total time spent processing database calls , In seconds disk: Number of data blocks physically read , Suppose it is greater than the number of logical reads (disk>query+current), Indicates that a temporary table space is used .
query: The number of fast reads from the cache logic in consistent mode . Used as a query . current: The number of blocks read from the cache logic in the current mode , be used for insert、delete、merge as well as update Wait for the operation . rows: Number of data rows processed . The query represents the number of rows obtained . and insert、delete、merge as well as update Etc. indicates the number of rows affected .
Here is a detailed example :
call     count       cpu    elapsed       disk      query    current        rows
------- ------  -------- ---------- ---------- ---------- ----------  ----------
Parse        1      0.00       0.00          0          0          0           0
Execute      1      0.00       0.00          0          0          0           0
Fetch      501      0.03       0.15          0       1465          0       50001
------- ------  -------- ---------- ---------- ---------- ----------  ----------
total 503 0.03 0.15 0 1465 0 50001The above corresponds to parse、execute and fetch this 3 Stages . stay fetch Phase is running 501 Time fetch, Got 50001 Row data , Every time fetch obtain 100 Row data . Next is :
Misses in library cache during parse: 1
Misses in library cache during execute: 1
Optimizer mode: ALL_ROWS
Parsing user id: 5 The first two lines indicate the number of hard parsing that occurs in the parsing and running call phases . Suppose there is no hard parsing . There is no . “Optimizer mode” Represents the optimizer pattern .
“Parsing user id” It's parsing SQL The user of the statement . After that, you can see the operation plan , Here is just a simple explanation :
Rows     Row Source Operation
-------  ---------------------------------------------------
  50001  COUNT STOPKEY (cr=1465 pr=0 pw=0 time=300125 us)
  50001   VIEW  (cr=1465 pr=0 pw=0 time=200088 us)
50001 INDEX FULL SCAN IDX_HISTORYALARM$CLEAR (cr=1465 pr=0 pw=0 time=100049 us)(object id 53743)cr: Number of data blocks read out logically in consistency mode pr: The number of data blocks physically read from the disk pw: Number of data blocks physically written to disk time: The total time-consuming in subtle terms , Note that the data is inaccurate cost: The evaluation cost of the operation ( only 11g To provide ) size: The predicted amount of data returned by the operation ( Number of bytes )( only 11g To provide ) card: The expected number of rows returned by the operation ( only 11g To provide )
Next is waiting for the event :
  Event waited on                             Times Waited   Max. Wait  Total Waited
  ----------------------------------------------------------------------------------
  SQL*Net message to client                        502           0.00          0.00
  SQL*Net message from client                      502           0.08         15.42
SQL*Net more data to client 500 0.00 0.01Times Waited: Waiting time takes up time Max. Wait: Maximum waiting time for a single waiting event , The unit is in seconds Total Waited: Total waiting seconds for a waiting event . Imprecise
Here you can see the waiting events encountered during the operation , Through the analysis of these waiting events . It helps you understand what resources you are waiting for , The bottleneck of query , Targeted optimization .
In the Oracle Database Reference In a short narrative, the manual in the appendix describes the most common waiting events .
Copyright notice : This article is the original article of the blogger . Blog , Do not reprint without permission .
Publisher : Full stack programmer stack length , Reprint please indicate the source :https://javaforall.cn/117071.html Link to the original text :https://javaforall.cn
边栏推荐
- [Chongqing Guangdong education] Information Literacy of Sichuan Normal University: a new engine for efficiency improvement and lifelong learning reference materials
- Oracle性能分析3:TKPROF简介
- npm run dev启动项目报错 document is not defined
- Microsoft technology empowerment position - February course Preview
- 功能强大的国产Api管理工具
- 一行代码可以做些什么?
- MPLS experiment
- [asp.net core] set the format of Web API response data -- formatfilter feature
- 抖音將推獨立種草App“可頌”,字節忘不掉小紅書?
- guava:创建immutableXxx对象的3种方式
猜你喜欢

20 large visual screens that are highly praised by the boss, with source code templates!
guava:Collections. The collection created by unmodifiablexxx is not immutable
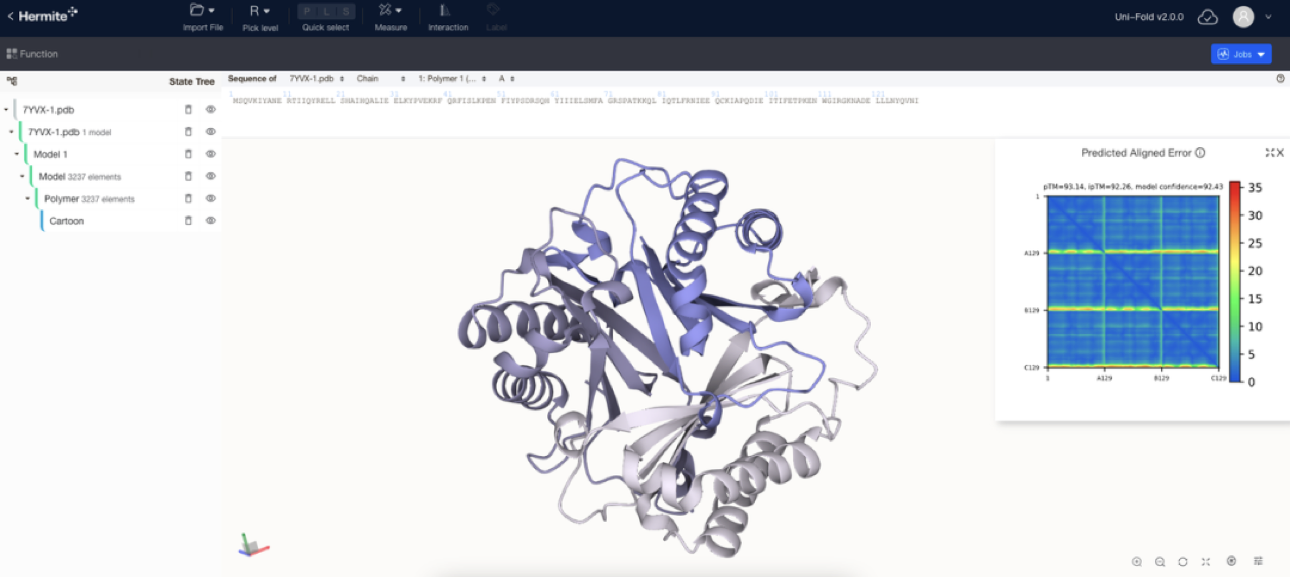
AI 企业多云存储架构实践 | 深势科技分享
![Leetcode topic [array] -118 Yang Hui triangle](/img/77/d8a7085968cc443260b4c0910bd04b.jpg)
Leetcode topic [array] -118 Yang Hui triangle

麦趣尔砸了小众奶招牌
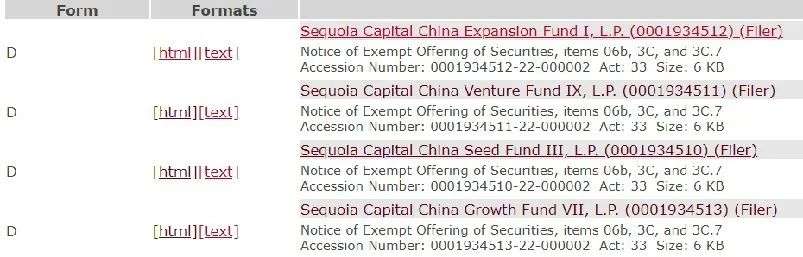
Sequoia China, just raised $9billion

What can one line of code do?
![[Digital IC manual tearing code] Verilog automatic beverage machine | topic | principle | design | simulation](/img/75/c0656c4890795bd65874b4f2b16462.jpg)
[Digital IC manual tearing code] Verilog automatic beverage machine | topic | principle | design | simulation
Michael smashed the minority milk sign
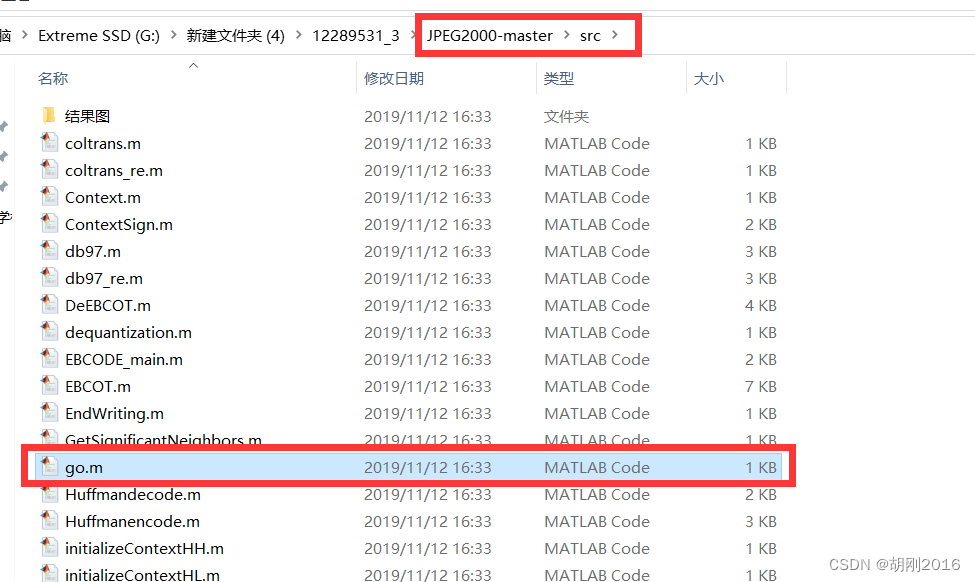
JPEG2000 matlab source code implementation
随机推荐
Caching strategies overview
Leetcode learning records (starting from the novice village, you can't kill out of the novice Village) ---1
uni-app App端半屏连续扫码
抖音将推独立种草App“可颂”,字节忘不掉小红书?
50个常用的Numpy函数解释,参数和使用示例
华为在多个行业同时出击,吓人的技术让欧美企业瑟瑟发抖
设置状态栏样式Demo
Comparison between multithreaded CAS and synchronized
[Yu Yue education] reference materials for surgical skills teaching in Tongji University
小满网络模型&http1-http2 &浏览器缓存
jvm:大对象在老年代的分配
MySQL - transaction details
功能强大的国产Api管理工具
Binary tree node at the longest distance
美国科技行业结束黄金时代,芯片求售、裁员3万等哀声不断
搜素专题(DFS )
Shell product written examination related
High precision face recognition based on insightface, which can directly benchmark hongruan
The relationship between root and coefficient of quadratic equation with one variable
Fzu 1686 dragon mystery repeated coverage