当前位置:网站首页>HOW TO ADD P-VALUES ONTO A GROUPED GGPLOT USING THE GGPUBR R PACKAGE
HOW TO ADD P-VALUES ONTO A GROUPED GGPLOT USING THE GGPUBR R PACKAGE
2022-07-02 11:50:00 【Xiaoyu 2022】
library(ggpubr)
library(rstatix)
# Transform `dose` into factor variable
df <- ToothGrowth
df$dose <- as.factor(df$dose)
head(df, 3)
stat.test <- df %>%
group_by(dose) %>%
t_test(len ~ supp) %>%
adjust_pvalue(method = "bonferroni") %>%
add_significance("p.adj")
stat.test
# Create a box plot
bxp <- ggboxplot(
df, x = "dose", y = "len",
color = "supp", palette = c("#00AFBB", "#E7B800")
)
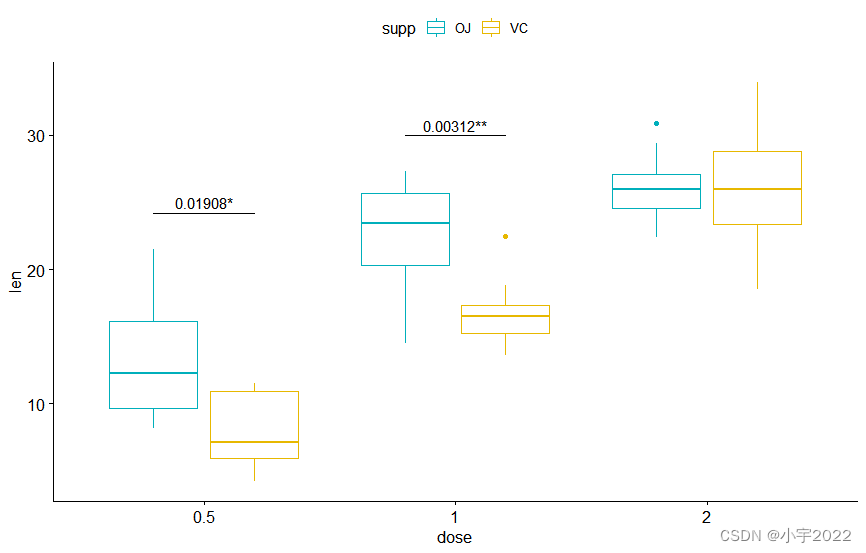
# Add p-values onto the box plots
stat.test <- stat.test %>%
add_xy_position(x = "dose", dodge = 0.8)
bxp + stat_pvalue_manual(
stat.test, label = "p", tip.length = 0
)
# Add 10% spaces between the p-value labels and the plot border
bxp + stat_pvalue_manual(
stat.test, label = "p", tip.length = 0
) +
scale_y_continuous(expand = expansion(mult = c(0, 0.1)))

library(ggpubr)
library(rstatix)
# Transform `dose` into factor variable
df <- ToothGrowth
df$dose <- as.factor(df$dose)
head(df, 3)
stat.test <- df %>%
  group_by(dose) %>%
  t_test(len ~ supp) %>%
  adjust_pvalue(method = "bonferroni") %>%
  add_significance("p.adj")
stat.test
# Create a box plot
bxp <- ggboxplot(
  df, x = "dose", y = "len",
  color = "supp", palette = c("#00AFBB", "#E7B800")
)

# Add p-values onto the box plots
stat.test <- stat.test %>%
  add_xy_position(x = "dose", dodge = 0.8)
# Use adjusted p-values as labels
# Remove brackets
bxp + stat_pvalue_manual(
  stat.test,  label = "p.adj", tip.length = 0,
  remove.bracket = TRUE
)

# Show adjusted p-values and significance levels
# Hide ns (non-significant)
bxp + stat_pvalue_manual(
  stat.test,  label = "{p.adj}{p.adj.signif}",
  tip.length = 0, hide.ns = TRUE
)
library(ggpubr)
library(rstatix)
# Transform `dose` into factor variable
df <- ToothGrowth
df$dose <- as.factor(df$dose)
head(df, 3)
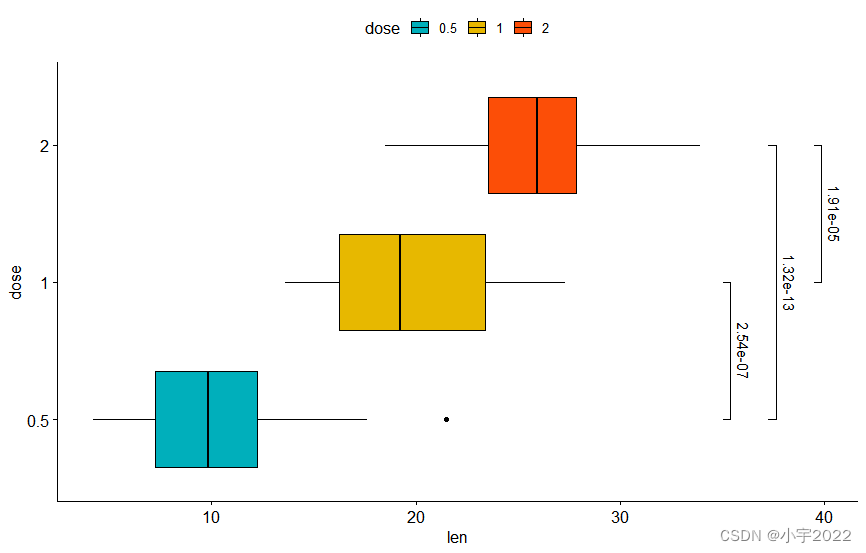
# Additional statistical test
stat.test2 <- df %>%
t_test(len ~ dose, p.adjust.method = "bonferroni")
stat.test2
# Add p-values of `stat.test` and `stat.test2`
# 1. Add stat.test
stat.test <- stat.test %>%
add_xy_position(x = "dose", dodge = 0.8)
bxp.complex <- bxp + stat_pvalue_manual(
stat.test, label = "p", tip.length = 0
)
# 2. Add stat.test2
# Add more space between brackets using `step.increase`
stat.test2 <- stat.test2 %>% add_xy_position(x = "dose")
bxp.complex <- bxp.complex +
stat_pvalue_manual(
stat.test2, label = "p", tip.length = 0.02,
step.increase = 0.05
) +
scale_y_continuous(expand = expansion(mult = c(0.05, 0.1)))
# 3. Display the plot
bxp.complex

library(ggpubr)
library(rstatix)
# Transform `dose` into factor variable
df <- ToothGrowth
df$dose <- as.factor(df$dose)
head(df, 3)
# Create a bar plot with error bars (mean +/- sd)
bp <- ggbarplot(
  df, x = "dose", y = "len", add = "mean_sd",
  color= "supp", palette = c("#00AFBB", "#E7B800"),
  position = position_dodge(0.8)
)
# Add p-values onto the bar plots
stat.test <- stat.test %>%
  add_xy_position(fun = "mean_sd", x = "dose", dodge = 0.8)
bp + stat_pvalue_manual(
  stat.test,  label = "p.adj.signif", tip.length = 0.01
)

# Move down the brackets using `bracket.nudge.y`
bp + stat_pvalue_manual(
  stat.test,  label = "p.adj.signif", tip.length = 0,
  bracket.nudge.y = -2
)

library(ggpubr)
library(rstatix)
# Transform `dose` into factor variable
df <- ToothGrowth
df$dose <- as.factor(df$dose)
head(df, 3)
# Create a bar plot with error bars (mean +/- sd)
bp2 <- ggbarplot(
df, x = "dose", y = "len", add = "mean_sd",
color = "supp", palette = c("#00AFBB", "#E7B800"),
position = position_stack()
)
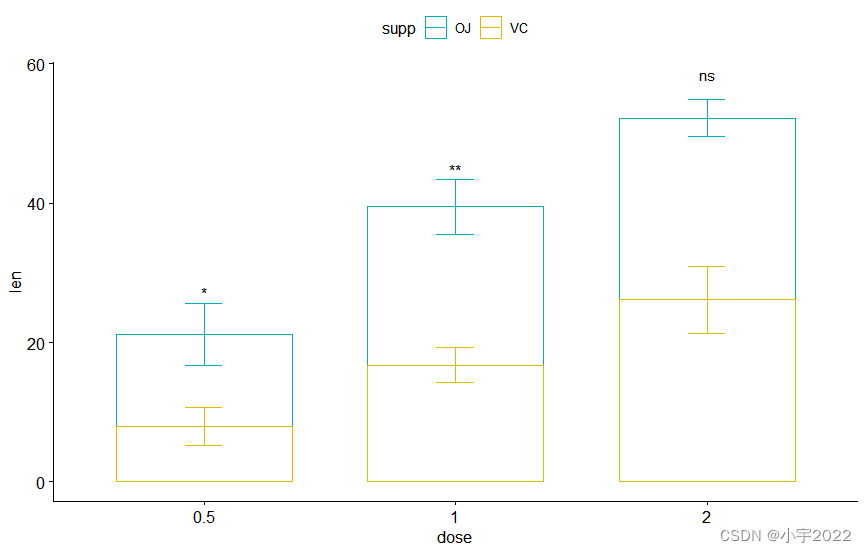
# Add p-values onto the bar plots
# Specify the p-value y position manually
bp2 + stat_pvalue_manual(
stat.test, label = "p.adj.signif", tip.length = 0.01,
x = "dose", y.position = c(30, 45, 60)
)
# Auto-compute the p-value y position
# Adjust vertically label positions using vjust
stat.test <- stat.test %>%
add_xy_position(fun = "mean_sd", x = "dose", stack = TRUE)
bp2 + stat_pvalue_manual(
stat.test, label = "p.adj.signif",
remove.bracket = TRUE, vjust = -0.2
)
library(ggpubr)
library(rstatix)
# Transform `dose` into factor variable
df <- ToothGrowth
df$dose <- as.factor(df$dose)
head(df, 3)
# Create a line plot with error bars (mean +/- sd)
lp <- ggline(
  df, x = "dose", y = "len", add = "mean_sd",
  color = "supp", palette = c("#00AFBB", "#E7B800")
)

# Add p-values onto the line plots
# Remove brackets using linetype = "blank"
stat.test <- stat.test %>%
  add_xy_position(fun = "mean_sd", x = "dose")
lp + stat_pvalue_manual(
  stat.test,  label = "p.adj.signif",
  tip.length = 0, linetype  = "blank"
)

# Move down the significance levels using vjust
lp + stat_pvalue_manual(
  stat.test,  label = "p.adj.signif",
  linetype  = "blank", vjust = 2
)

library(ggpubr)
library(rstatix)
# Transform `dose` into factor variable
df <- ToothGrowth
df$dose <- as.factor(df$dose)
head(df, 3)
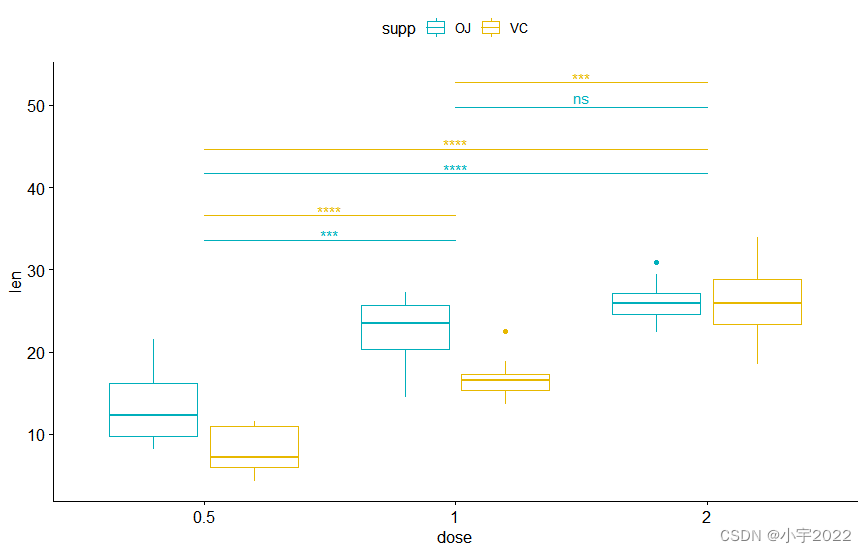
pwc <- df %>%
group_by(supp) %>%
t_test(len ~ dose, p.adjust.method = "bonferroni")
pwc
# Box plot
pwc <- pwc %>% add_xy_position(x = "dose")
bxp +
stat_pvalue_manual(
pwc, color = "supp", step.group.by = "supp",
tip.length = 0, step.increase = 0.1
)
library(ggpubr)
library(rstatix)
# Transform `dose` into factor variable
df <- ToothGrowth
df$dose <- as.factor(df$dose)
head(df, 3)
# Box plot
pwc <- pwc %>% add_xy_position(x = "dose")
bxp +
stat_pvalue_manual(
pwc, color = "supp", step.group.by = "supp",
tip.length = 0, step.increase = 0.1
)
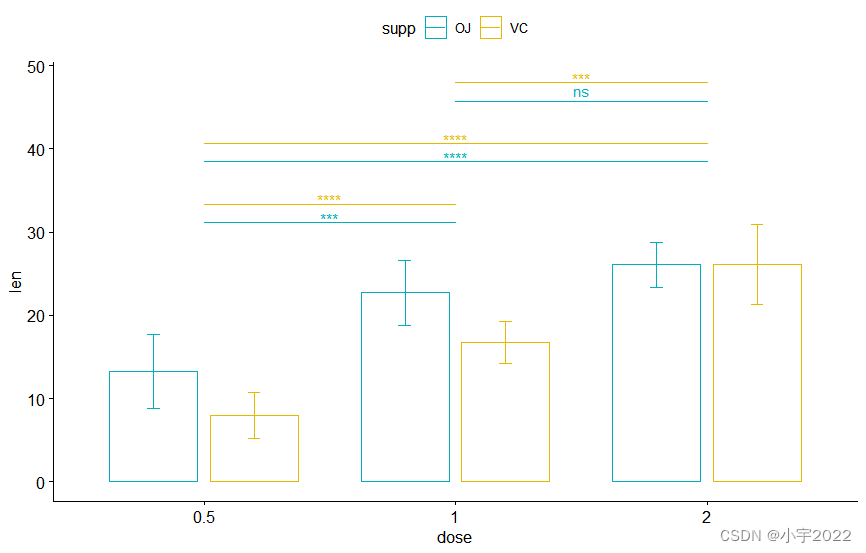
# Bar plots
pwc <- pwc %>% add_xy_position(x = "dose", fun = "mean_sd", dodge = 0.8)
bp + stat_pvalue_manual(
pwc, color = "supp", step.group.by = "supp",
tip.length = 0, step.increase = 0.1
)
library(ggpubr)
library(rstatix)
# Transform `dose` into factor variable
df <- ToothGrowth
df$dose <- as.factor(df$dose)
head(df, 3)
# Line plots
pwc <- pwc %>% add_xy_position(x = "dose", fun = "mean_sd")
lp + stat_pvalue_manual(
  pwc, color = "supp", step.group.by = "supp",
  tip.length = 0, step.increase = 0.1
)

library(ggpubr)
library(rstatix)
# Transform `dose` into factor variable
df <- ToothGrowth
df$dose <- as.factor(df$dose)
head(df, 3)
# Bar plots (dodged)
# Take a subset of the pairwise comparisons
pwc.filtered <- pwc %>%
  add_xy_position(x = "dose", fun = "mean_sd", dodge = 0.8) %>%
  filter(supp == "VC")
bp +
  stat_pvalue_manual(
    pwc.filtered, color = "supp", step.group.by = "supp",
    tip.length = 0, step.increase = 0
  )

library(ggpubr)
library(rstatix)
# Transform `dose` into factor variable
df <- ToothGrowth
df$dose <- as.factor(df$dose)
head(df, 3)
# Bar plots (stacked)
pwc.filtered <- pwc %>%
  add_xy_position(x = "dose", fun = "mean_sd", stack = TRUE) %>%
  filter(supp == "VC")
bp2 +
  stat_pvalue_manual(
    pwc.filtered, color = "supp", step.group.by = "supp",
    tip.length = 0, step.increase = 0.1
  )

library(ggpubr)
library(rstatix)
# Transform `dose` into factor variable
df <- ToothGrowth
df$dose <- as.factor(df$dose)
head(df, 3)
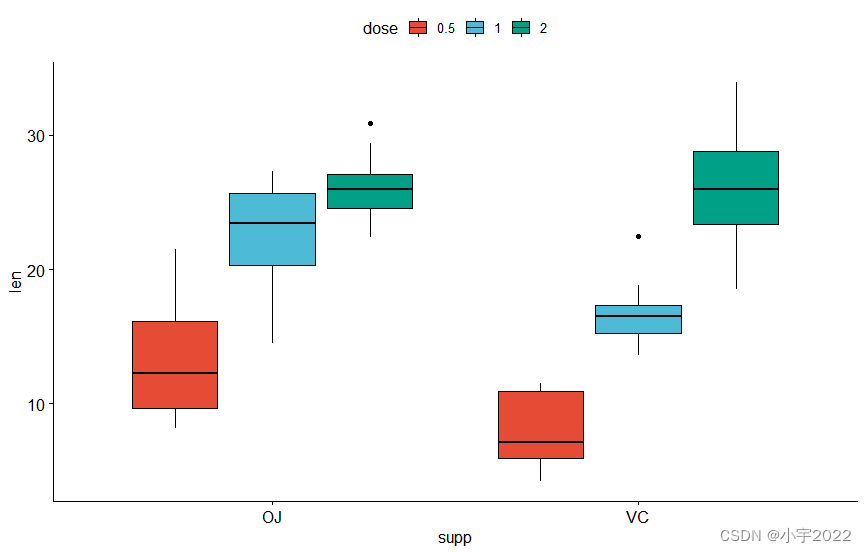
# Box plots
bxp <- ggboxplot(
df, x = "supp", y = "len", fill = "dose",
palette = "npg"
)
bxp
library(ggpubr)
library(rstatix)
# Transform `dose` into factor variable
df <- ToothGrowth
df$dose <- as.factor(df$dose)
head(df, 3)
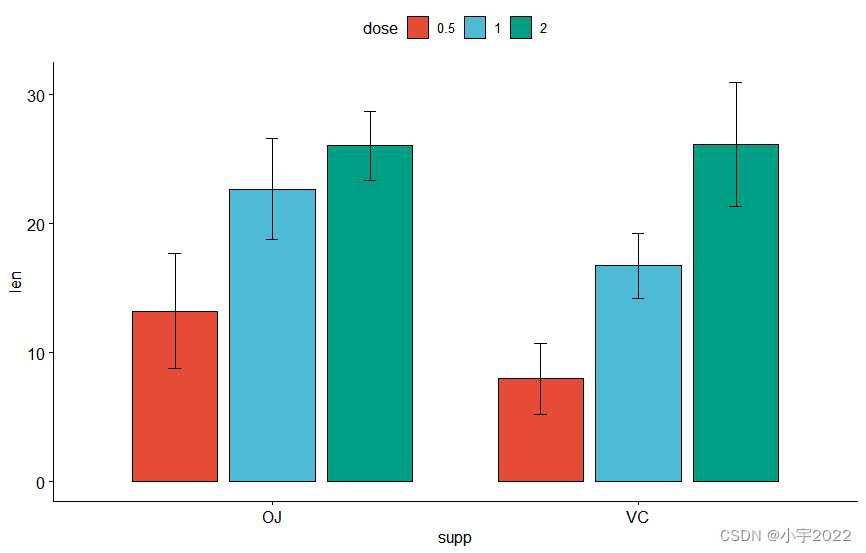
# Bar plots
bp <- ggbarplot(
df, x = "supp", y = "len", fill = "dose",
palette = "npg", add = "mean_sd",
position = position_dodge(0.8)
)
bp
library(ggpubr)
library(rstatix)
# Transform `dose` into factor variable
df <- ToothGrowth
df$dose <- as.factor(df$dose)
head(df, 3)
stat.test <- df %>%
  group_by(supp) %>%
  t_test(len ~ dose)
stat.test
# Box plots with p-values
stat.test <- stat.test %>%
  add_xy_position(x = "supp", dodge = 0.8)
bxp +
  stat_pvalue_manual(
    stat.test, label = "p.adj", tip.length = 0.01,
    bracket.nudge.y = -2
  ) +
  scale_y_continuous(expand = expansion(mult = c(0, 0.1)))

library(ggpubr)
library(rstatix)
# Transform `dose` into factor variable
df <- ToothGrowth
df$dose <- as.factor(df$dose)
head(df, 3)
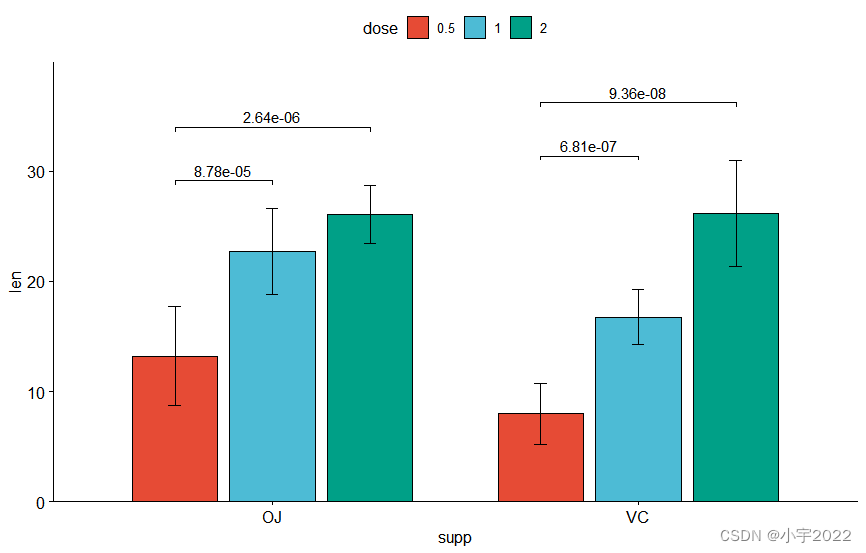
stat.test <- df %>%
group_by(supp) %>%
t_test(len ~ dose)
stat.test
# Bar plots with p-values
stat.test <- stat.test %>%
add_xy_position(x = "supp", fun = "mean_sd", dodge = 0.8)
bp +
stat_pvalue_manual(
stat.test, label = "p.adj", tip.length = 0.01,
bracket.nudge.y = -2
) +
scale_y_continuous(expand = expansion(mult = c(0, 0.1)))

library(ggpubr)
library(rstatix)
# Transform `dose` into factor variable
df <- ToothGrowth
df$dose <- as.factor(df$dose)
head(df, 3)
stat.test <- df %>%
  group_by(supp) %>%
  t_test(len ~ dose, ref.group = "0.5")
stat.test
# Box plots with p-values
stat.test <- stat.test %>%
  add_xy_position(x = "supp", dodge = 0.8)
bxp +
  stat_pvalue_manual(
    stat.test, label = "p.adj", tip.length = 0.01,
    bracket.nudge.y = -2
  ) +
  scale_y_continuous(expand = expansion(mult = c(0, 0.1)))

library(ggpubr)
library(rstatix)
# Transform `dose` into factor variable
df <- ToothGrowth
df$dose <- as.factor(df$dose)
head(df, 3)
stat.test <- df %>%
  group_by(supp) %>%
  t_test(len ~ dose, ref.group = "0.5")
stat.test
# Box plots with p-values
stat.test <- stat.test %>%
  add_xy_position(x = "supp", dodge = 0.8)
# Show only significance levels
# Move down significance symbols using vjust
bxp + stat_pvalue_manual(
  stat.test, x = "supp",  label = "p.adj.signif",
  tip.length = 0.01, vjust = 2
)

library(ggpubr)
library(rstatix)
# Transform `dose` into factor variable
df <- ToothGrowth
df$dose <- as.factor(df$dose)
head(df, 3)
# Bar plots with p-values
stat.test <- stat.test %>%
  add_xy_position(x = "supp", fun = "mean_sd", dodge = 0.8)
bp +
  stat_pvalue_manual(
    stat.test, label = "p.adj", tip.length = 0.01,
    bracket.nudge.y = -2
  ) +
  scale_y_continuous(expand = expansion(mult = c(0, 0.1)))
边栏推荐
- Amazon cloud technology community builder application window opens
- 程序员成长第六篇:如何选择公司?
- qt 仪表自定义控件
- 行业的分析
- ESP32 Arduino 引入LVGL 碰到的一些问题
- HOW TO CREATE AN INTERACTIVE CORRELATION MATRIX HEATMAP IN R
- excel表格中选中单元格出现十字带阴影的选中效果
- Pyqt5+opencv project practice: microcirculator pictures, video recording and manual comparison software (with source code)
- Some suggestions for young people who are about to enter the workplace in the graduation season
- BEAUTIFUL GGPLOT VENN DIAGRAM WITH R
猜你喜欢

2022年4月17日五心红娘团队收获双份喜报
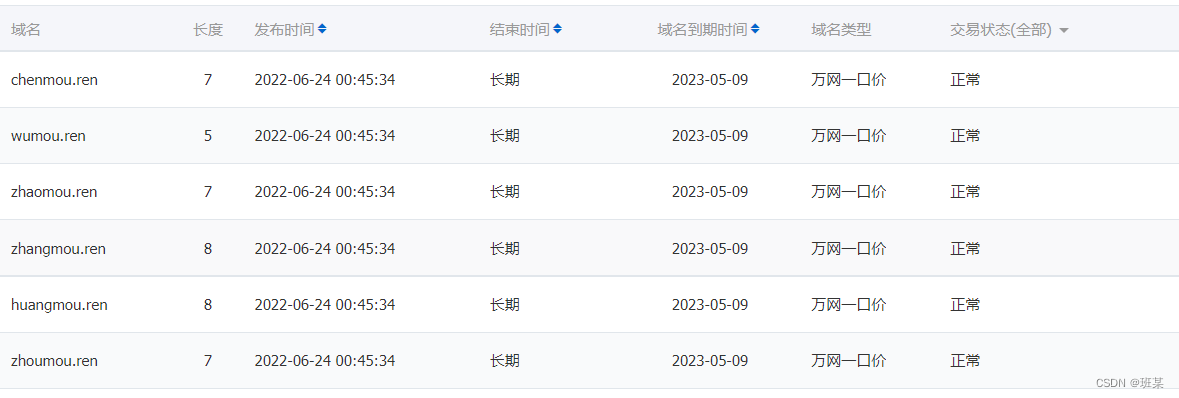
Is the Ren domain name valuable? Is it worth investing? What is the application scope of Ren domain name?

数据分析 - matplotlib示例代码
How to Add P-Values onto Horizontal GGPLOTS
Research on and off the Oracle chain
![[cloud native] 2.5 kubernetes core practice (Part 2)](/img/87/826894d758392a0c7a60dd5fa09eef.png)
[cloud native] 2.5 kubernetes core practice (Part 2)

MySQL comparison operator in problem solving

基于Hardhat和Openzeppelin开发可升级合约(一)

Never forget, there will be echoes | hanging mirror sincerely invites you to participate in the opensca user award research
HOW TO ADD P-VALUES ONTO A GROUPED GGPLOT USING THE GGPUBR R PACKAGE
随机推荐
Tidb DM alarm DM_ sync_ process_ exists_ with_ Error troubleshooting
liftOver进行基因组坐标转换
Principle of scalable contract delegatecall
Tiktok overseas tiktok: finalizing the final data security agreement with Biden government
由粒子加速器产生的反中子形成的白洞
MySQL comparison operator in problem solving
R HISTOGRAM EXAMPLE QUICK REFERENCE
Analyse de l'industrie
HOW TO ADD P-VALUES ONTO A GROUPED GGPLOT USING THE GGPUBR R PACKAGE
Always report errors when connecting to MySQL database
STM32 single chip microcomputer programming learning
A sharp tool for exposing data inconsistencies -- a real-time verification system
RPA advanced (II) uipath application practice
Three transparent LED displays that were "crowded" in 2022
Precautions for scalable contract solution based on openzeppelin
Some suggestions for young people who are about to enter the workplace in the graduation season
Dynamic memory (advanced 4)
How to Create a Nice Box and Whisker Plot in R
The computer screen is black for no reason, and the brightness cannot be adjusted.
多文件程序X32dbg动态调试