当前位置:网站首页>HOW TO ADD P-VALUES ONTO A GROUPED GGPLOT USING THE GGPUBR R PACKAGE
HOW TO ADD P-VALUES ONTO A GROUPED GGPLOT USING THE GGPUBR R PACKAGE
2022-07-02 09:38:00 【小宇2022】
library(ggpubr)
library(rstatix)
# Transform `dose` into factor variable
df <- ToothGrowth
df$dose <- as.factor(df$dose)
head(df, 3)
stat.test <- df %>%
group_by(dose) %>%
t_test(len ~ supp) %>%
adjust_pvalue(method = "bonferroni") %>%
add_significance("p.adj")
stat.test
# Create a box plot
bxp <- ggboxplot(
df, x = "dose", y = "len",
color = "supp", palette = c("#00AFBB", "#E7B800")
)
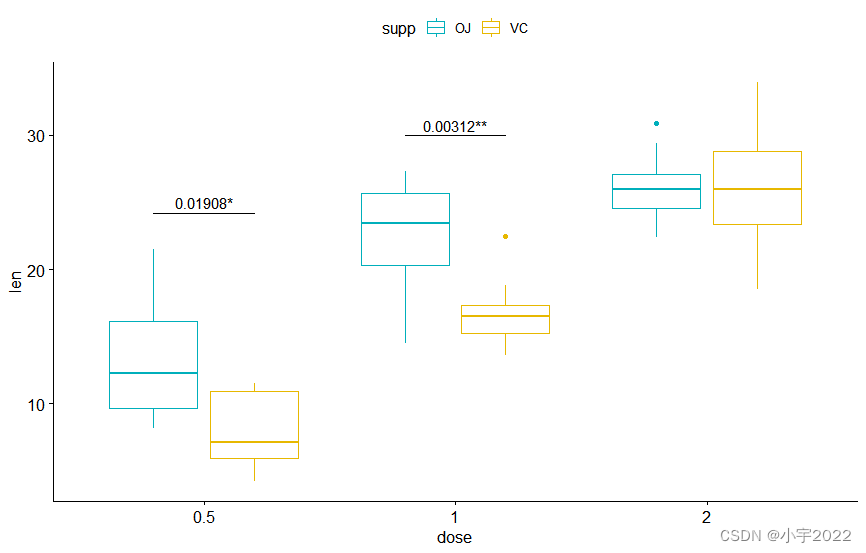
# Add p-values onto the box plots
stat.test <- stat.test %>%
add_xy_position(x = "dose", dodge = 0.8)
bxp + stat_pvalue_manual(
stat.test, label = "p", tip.length = 0
)
# Add 10% spaces between the p-value labels and the plot border
bxp + stat_pvalue_manual(
stat.test, label = "p", tip.length = 0
) +
scale_y_continuous(expand = expansion(mult = c(0, 0.1)))

library(ggpubr)
library(rstatix)
# Transform `dose` into factor variable
df <- ToothGrowth
df$dose <- as.factor(df$dose)
head(df, 3)
stat.test <- df %>%
  group_by(dose) %>%
  t_test(len ~ supp) %>%
  adjust_pvalue(method = "bonferroni") %>%
  add_significance("p.adj")
stat.test
# Create a box plot
bxp <- ggboxplot(
  df, x = "dose", y = "len",
  color = "supp", palette = c("#00AFBB", "#E7B800")
)

# Add p-values onto the box plots
stat.test <- stat.test %>%
  add_xy_position(x = "dose", dodge = 0.8)
# Use adjusted p-values as labels
# Remove brackets
bxp + stat_pvalue_manual(
  stat.test,  label = "p.adj", tip.length = 0,
  remove.bracket = TRUE
)

# Show adjusted p-values and significance levels
# Hide ns (non-significant)
bxp + stat_pvalue_manual(
  stat.test,  label = "{p.adj}{p.adj.signif}",
  tip.length = 0, hide.ns = TRUE
)
library(ggpubr)
library(rstatix)
# Transform `dose` into factor variable
df <- ToothGrowth
df$dose <- as.factor(df$dose)
head(df, 3)
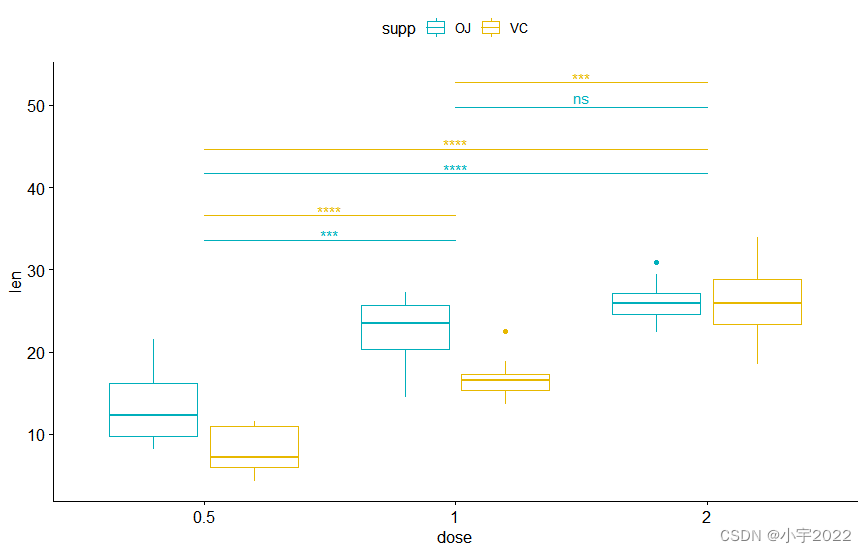
# Additional statistical test
stat.test2 <- df %>%
t_test(len ~ dose, p.adjust.method = "bonferroni")
stat.test2
# Add p-values of `stat.test` and `stat.test2`
# 1. Add stat.test
stat.test <- stat.test %>%
add_xy_position(x = "dose", dodge = 0.8)
bxp.complex <- bxp + stat_pvalue_manual(
stat.test, label = "p", tip.length = 0
)
# 2. Add stat.test2
# Add more space between brackets using `step.increase`
stat.test2 <- stat.test2 %>% add_xy_position(x = "dose")
bxp.complex <- bxp.complex +
stat_pvalue_manual(
stat.test2, label = "p", tip.length = 0.02,
step.increase = 0.05
) +
scale_y_continuous(expand = expansion(mult = c(0.05, 0.1)))
# 3. Display the plot
bxp.complex

library(ggpubr)
library(rstatix)
# Transform `dose` into factor variable
df <- ToothGrowth
df$dose <- as.factor(df$dose)
head(df, 3)
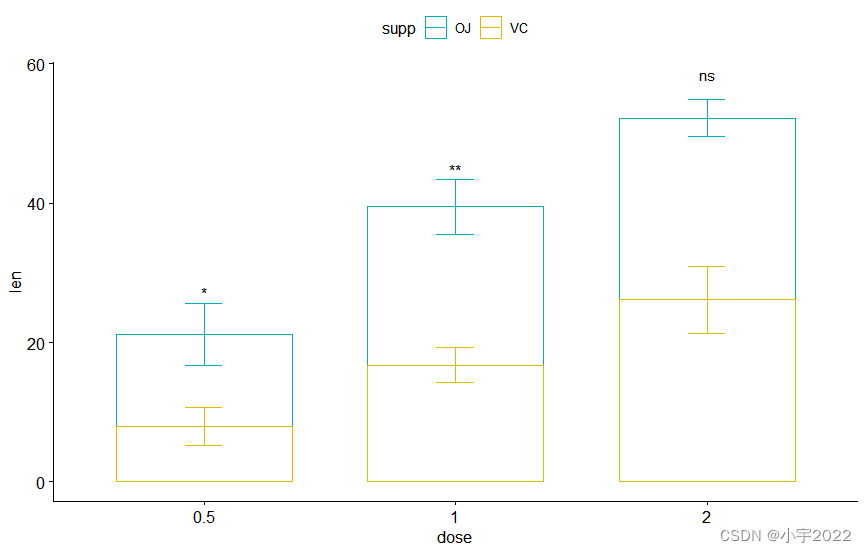
# Create a bar plot with error bars (mean +/- sd)
bp <- ggbarplot(
df, x = "dose", y = "len", add = "mean_sd",
color= "supp", palette = c("#00AFBB", "#E7B800"),
position = position_dodge(0.8)
)
# Add p-values onto the bar plots
stat.test <- stat.test %>%
add_xy_position(fun = "mean_sd", x = "dose", dodge = 0.8)
bp + stat_pvalue_manual(
stat.test, label = "p.adj.signif", tip.length = 0.01
)
# Move down the brackets using `bracket.nudge.y`
bp + stat_pvalue_manual(
stat.test, label = "p.adj.signif", tip.length = 0,
bracket.nudge.y = -2
)

library(ggpubr)
library(rstatix)
# Transform `dose` into factor variable
df <- ToothGrowth
df$dose <- as.factor(df$dose)
head(df, 3)
# Create a bar plot with error bars (mean +/- sd)
bp2 <- ggbarplot(
  df, x = "dose", y = "len", add = "mean_sd",
  color = "supp", palette = c("#00AFBB", "#E7B800"),
  position = position_stack()
)

# Add p-values onto the bar plots
# Specify the p-value y position manually
bp2 + stat_pvalue_manual(
  stat.test,  label = "p.adj.signif", tip.length = 0.01,
  x = "dose", y.position = c(30, 45, 60)
)

# Auto-compute the p-value y position
# Adjust vertically label positions using vjust
stat.test <- stat.test %>%
  add_xy_position(fun = "mean_sd", x = "dose", stack = TRUE)
bp2 + stat_pvalue_manual(
  stat.test,  label = "p.adj.signif",
  remove.bracket = TRUE, vjust = -0.2
)
library(ggpubr)
library(rstatix)
# Transform `dose` into factor variable
df <- ToothGrowth
df$dose <- as.factor(df$dose)
head(df, 3)
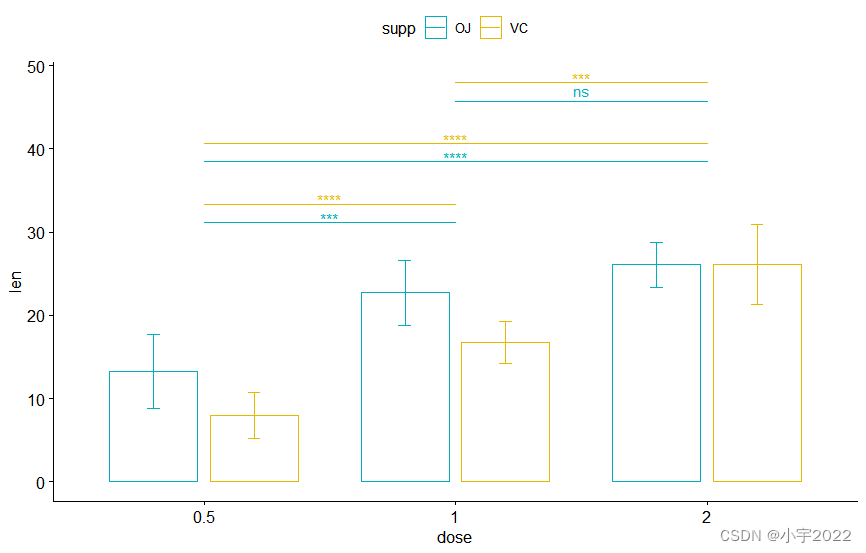
# Create a line plot with error bars (mean +/- sd)
lp <- ggline(
df, x = "dose", y = "len", add = "mean_sd",
color = "supp", palette = c("#00AFBB", "#E7B800")
)
# Add p-values onto the line plots
# Remove brackets using linetype = "blank"
stat.test <- stat.test %>%
add_xy_position(fun = "mean_sd", x = "dose")
lp + stat_pvalue_manual(
stat.test, label = "p.adj.signif",
tip.length = 0, linetype = "blank"
)
# Move down the significance levels using vjust
lp + stat_pvalue_manual(
stat.test, label = "p.adj.signif",
linetype = "blank", vjust = 2
)

library(ggpubr)
library(rstatix)
# Transform `dose` into factor variable
df <- ToothGrowth
df$dose <- as.factor(df$dose)
head(df, 3)
pwc <- df %>%
  group_by(supp) %>%
  t_test(len ~ dose, p.adjust.method = "bonferroni")
pwc
# Box plot
pwc <- pwc %>% add_xy_position(x = "dose")
bxp +
  stat_pvalue_manual(
    pwc, color = "supp", step.group.by = "supp",
    tip.length = 0, step.increase = 0.1
  )
library(ggpubr)
library(rstatix)
# Transform `dose` into factor variable
df <- ToothGrowth
df$dose <- as.factor(df$dose)
head(df, 3)
# Box plot
pwc <- pwc %>% add_xy_position(x = "dose")
bxp +
  stat_pvalue_manual(
    pwc, color = "supp", step.group.by = "supp",
    tip.length = 0, step.increase = 0.1
  )
# Bar plots
pwc <- pwc %>% add_xy_position(x = "dose", fun = "mean_sd", dodge = 0.8)
bp + stat_pvalue_manual(
  pwc, color = "supp", step.group.by = "supp",
  tip.length = 0, step.increase = 0.1
)
library(ggpubr)
library(rstatix)
# Transform `dose` into factor variable
df <- ToothGrowth
df$dose <- as.factor(df$dose)
head(df, 3)
# Line plots
pwc <- pwc %>% add_xy_position(x = "dose", fun = "mean_sd")
lp + stat_pvalue_manual(
  pwc, color = "supp", step.group.by = "supp",
  tip.length = 0, step.increase = 0.1
)

library(ggpubr)
library(rstatix)
# Transform `dose` into factor variable
df <- ToothGrowth
df$dose <- as.factor(df$dose)
head(df, 3)
# Bar plots (dodged)
# Take a subset of the pairwise comparisons
pwc.filtered <- pwc %>%
  add_xy_position(x = "dose", fun = "mean_sd", dodge = 0.8) %>%
  filter(supp == "VC")
bp +
  stat_pvalue_manual(
    pwc.filtered, color = "supp", step.group.by = "supp",
    tip.length = 0, step.increase = 0
  )

library(ggpubr)
library(rstatix)
# Transform `dose` into factor variable
df <- ToothGrowth
df$dose <- as.factor(df$dose)
head(df, 3)
# Bar plots (stacked)
pwc.filtered <- pwc %>%
  add_xy_position(x = "dose", fun = "mean_sd", stack = TRUE) %>%
  filter(supp == "VC")
bp2 +
  stat_pvalue_manual(
    pwc.filtered, color = "supp", step.group.by = "supp",
    tip.length = 0, step.increase = 0.1
  )

library(ggpubr)
library(rstatix)
# Transform `dose` into factor variable
df <- ToothGrowth
df$dose <- as.factor(df$dose)
head(df, 3)
# Box plots
bxp <- ggboxplot(
  df, x = "supp", y = "len", fill = "dose",
  palette = "npg"
)
bxp
library(ggpubr)
library(rstatix)
# Transform `dose` into factor variable
df <- ToothGrowth
df$dose <- as.factor(df$dose)
head(df, 3)

# Bar plots
bp <- ggbarplot(
  df, x = "supp", y = "len", fill = "dose",
  palette = "npg", add = "mean_sd",
  position = position_dodge(0.8)
)
bp
library(ggpubr)
library(rstatix)
# Transform `dose` into factor variable
df <- ToothGrowth
df$dose <- as.factor(df$dose)
head(df, 3)
stat.test <- df %>%
  group_by(supp) %>%
  t_test(len ~ dose)
stat.test
# Box plots with p-values
stat.test <- stat.test %>%
  add_xy_position(x = "supp", dodge = 0.8)
bxp +
  stat_pvalue_manual(
    stat.test, label = "p.adj", tip.length = 0.01,
    bracket.nudge.y = -2
  ) +
  scale_y_continuous(expand = expansion(mult = c(0, 0.1)))

library(ggpubr)
library(rstatix)
# Transform `dose` into factor variable
df <- ToothGrowth
df$dose <- as.factor(df$dose)
head(df, 3)
stat.test <- df %>%
  group_by(supp) %>%
  t_test(len ~ dose)
stat.test
# Bar plots with p-values
stat.test <- stat.test %>%
  add_xy_position(x = "supp", fun = "mean_sd", dodge = 0.8)
bp +
  stat_pvalue_manual(
    stat.test, label = "p.adj", tip.length = 0.01,
    bracket.nudge.y = -2
  ) +
  scale_y_continuous(expand = expansion(mult = c(0, 0.1)))

library(ggpubr)
library(rstatix)
# Transform `dose` into factor variable
df <- ToothGrowth
df$dose <- as.factor(df$dose)
head(df, 3)
stat.test <- df %>%
  group_by(supp) %>%
  t_test(len ~ dose, ref.group = "0.5")
stat.test
# Box plots with p-values
stat.test <- stat.test %>%
  add_xy_position(x = "supp", dodge = 0.8)
bxp +
  stat_pvalue_manual(
    stat.test, label = "p.adj", tip.length = 0.01,
    bracket.nudge.y = -2
  ) +
  scale_y_continuous(expand = expansion(mult = c(0, 0.1)))

library(ggpubr)
library(rstatix)
# Transform `dose` into factor variable
df <- ToothGrowth
df$dose <- as.factor(df$dose)
head(df, 3)
stat.test <- df %>%
  group_by(supp) %>%
  t_test(len ~ dose, ref.group = "0.5")
stat.test
# Box plots with p-values
stat.test <- stat.test %>%
  add_xy_position(x = "supp", dodge = 0.8)
# Show only significance levels
# Move down significance symbols using vjust
bxp + stat_pvalue_manual(
  stat.test, x = "supp",  label = "p.adj.signif",
  tip.length = 0.01, vjust = 2
)

library(ggpubr)
library(rstatix)
# Transform `dose` into factor variable
df <- ToothGrowth
df$dose <- as.factor(df$dose)
head(df, 3)
# Bar plots with p-values
stat.test <- stat.test %>%
  add_xy_position(x = "supp", fun = "mean_sd", dodge = 0.8)
bp +
  stat_pvalue_manual(
    stat.test, label = "p.adj", tip.length = 0.01,
    bracket.nudge.y = -2
  ) +
  scale_y_continuous(expand = expansion(mult = c(0, 0.1)))
边栏推荐
- Tick Data and Resampling
- Is bond fund safe? Does the bond buying foundation lose principal?
- QT获取某个日期是第几周
- A sharp tool for exposing data inconsistencies -- a real-time verification system
- Rest (XOR) position and thinking
- JS——每次调用从数组里面随机取一个数,且不能与上一次为同一个
- Introduction to interface debugging tools
- C # method of obtaining a unique identification number (ID) based on the current time
- Supermarket (heap overload
- ros gazebo相关包的安装
猜你喜欢

Develop scalable contracts based on hardhat and openzeppelin (II)
A white hole formed by antineutrons produced by particle accelerators

数字化转型挂帅复产复工,线上线下全融合重建商业逻辑
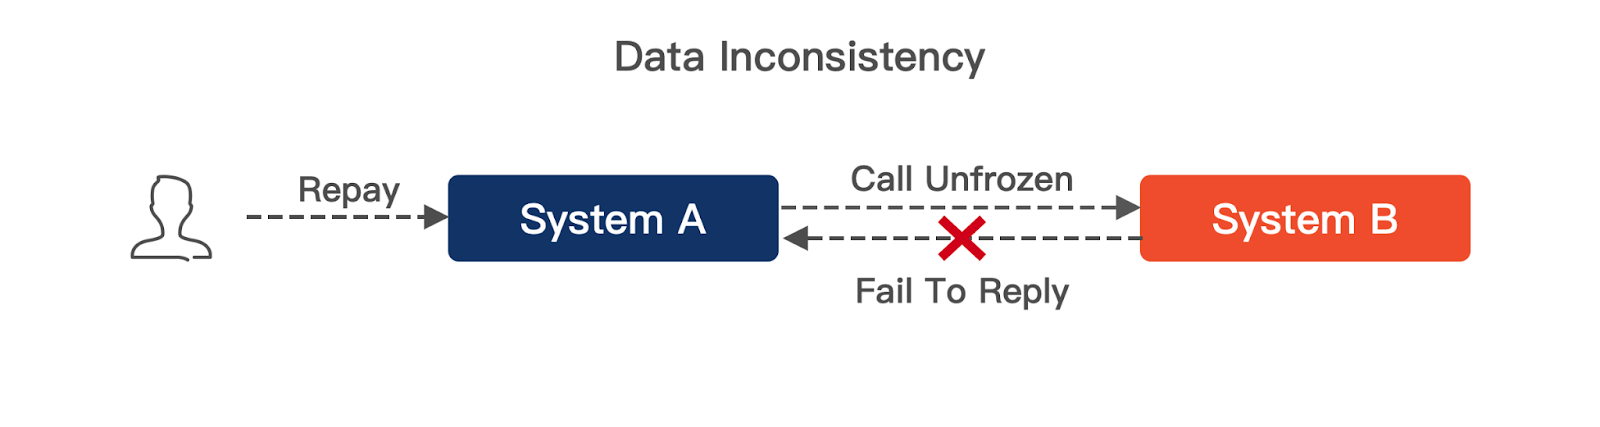
揭露数据不一致的利器 —— 实时核对系统

MTK full dump grab

ctf 记录

Tdsql | difficult employment? Tencent cloud database micro authentication to help you

Verilog and VHDL signed and unsigned number correlation operations
ESP32音频框架 ESP-ADF 添加按键外设流程代码跟踪

微信小程序利用百度api达成植物识别
随机推荐
GGPlot Examples Best Reference
tidb-dm报警DM_sync_process_exists_with_error排查
JS——每次调用从数组里面随机取一个数,且不能与上一次为同一个
Approximate sum count (approximate
On April 17, 2022, the five heart matchmaker team received double good news
ros缺少xacro的包
解决uniapp列表快速滑动页面数据空白问题
String (Analog
How to Create a Nice Box and Whisker Plot in R
基于Hardhat编写合约测试用例
【云原生】2.5 Kubernetes 核心实战(下)
Jinshanyun - 2023 Summer Internship
liftOver进行基因组坐标转换
Mmrotate rotation target detection framework usage record
Xiao Sha's pain (double pointer
Skills of PLC recorder in quickly monitoring multiple PLC bits
JS -- take a number randomly from the array every call, and it cannot be the same as the last time
C#基于当前时间,获取唯一识别号(ID)的方法
STM32 single chip microcomputer programming learning
C # method of obtaining a unique identification number (ID) based on the current time