当前位置:网站首页>【R】用grafify搞定统计绘图、方差分析、干预比较等!
【R】用grafify搞定统计绘图、方差分析、干预比较等!
2022-08-03 12:28:00 【风度78】
 本期推荐一个优质R包grafify,
grafify功能表现在以下几方面:
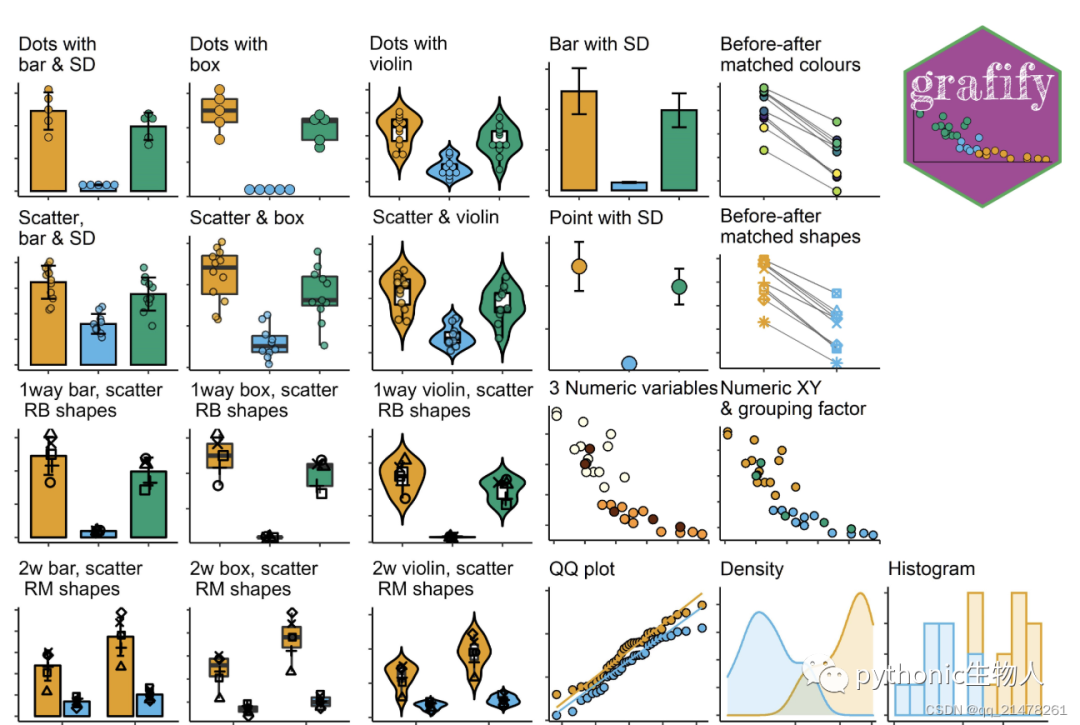
几行代码绘制高颜值统计图表,支持6大类,19种图表 (见上图);
包含辨识度极高的调色盘,可与ggplot2良好兼容;
支持方差分析 (ANOVA),包括随机区组和重复测量设计;
支持干预前后的变化比较 (post-hoc comparisons);
模拟1-way和2-way ANOVA设计。
grafify调色盘
支持以下调色盘,包含定性配色方案(Qualitative colormaps)如okabe_ito、r4等和顺序配色方案(Sequential colormaps)如grey_conti等。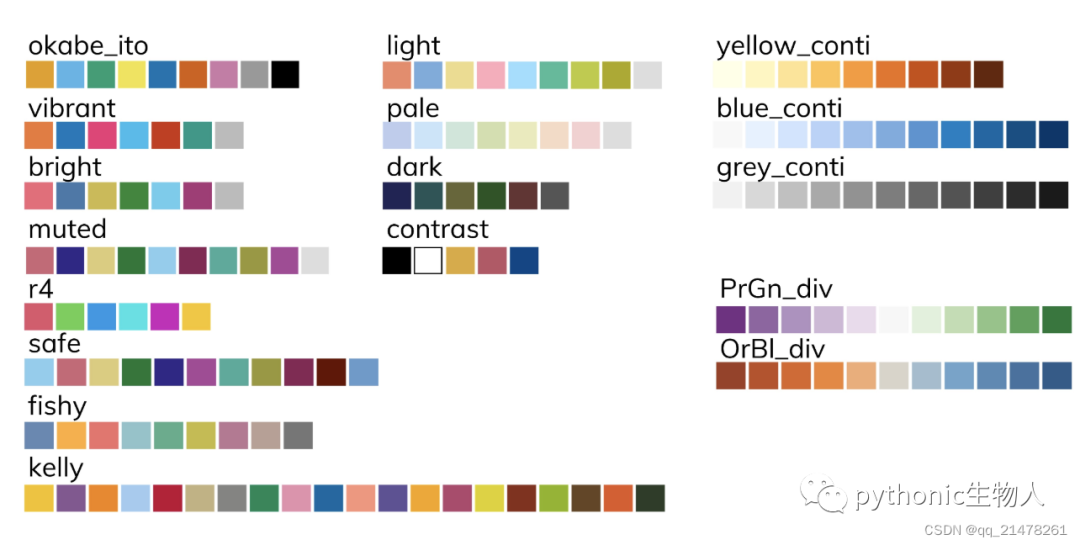 使用方法类似ggplot2,参考 R可视化07|ggplot2图层-标度图层(scale layer)-颜色盘篇
plot_grafify_palette(palette = "kelly") #查看kelly调色盘所有颜色色值号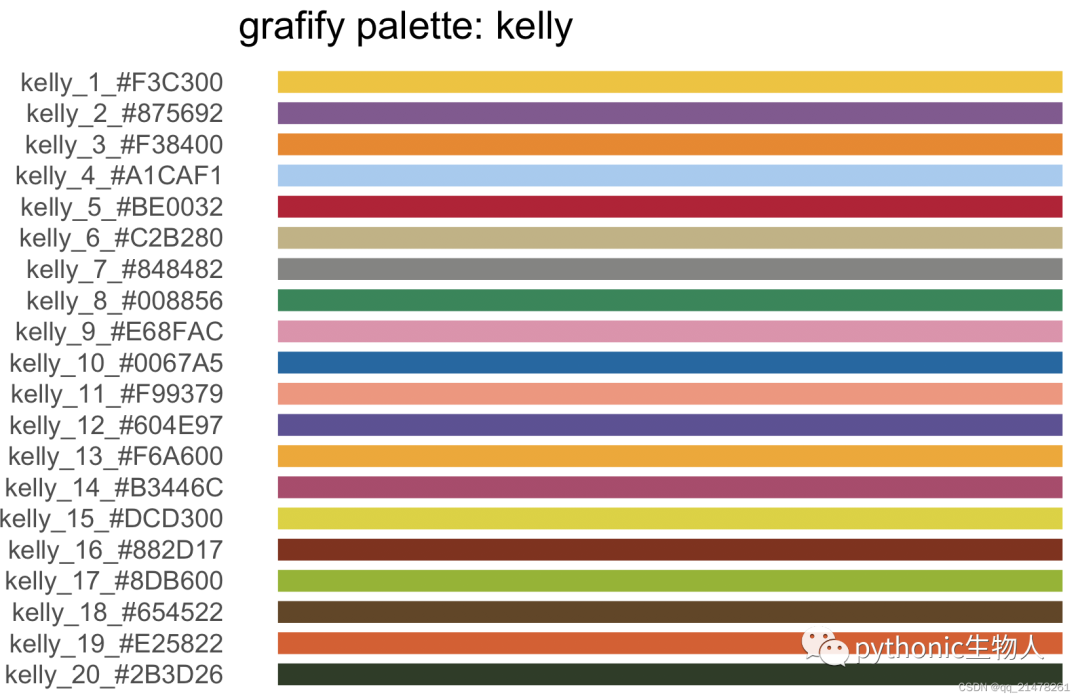
grafify:::graf_palettes #输出grafify所有调色盘色值
grafify绘制统计图
统计图对应的实现方法都在下图红框里了,需要那类图,使用图上方函数即可,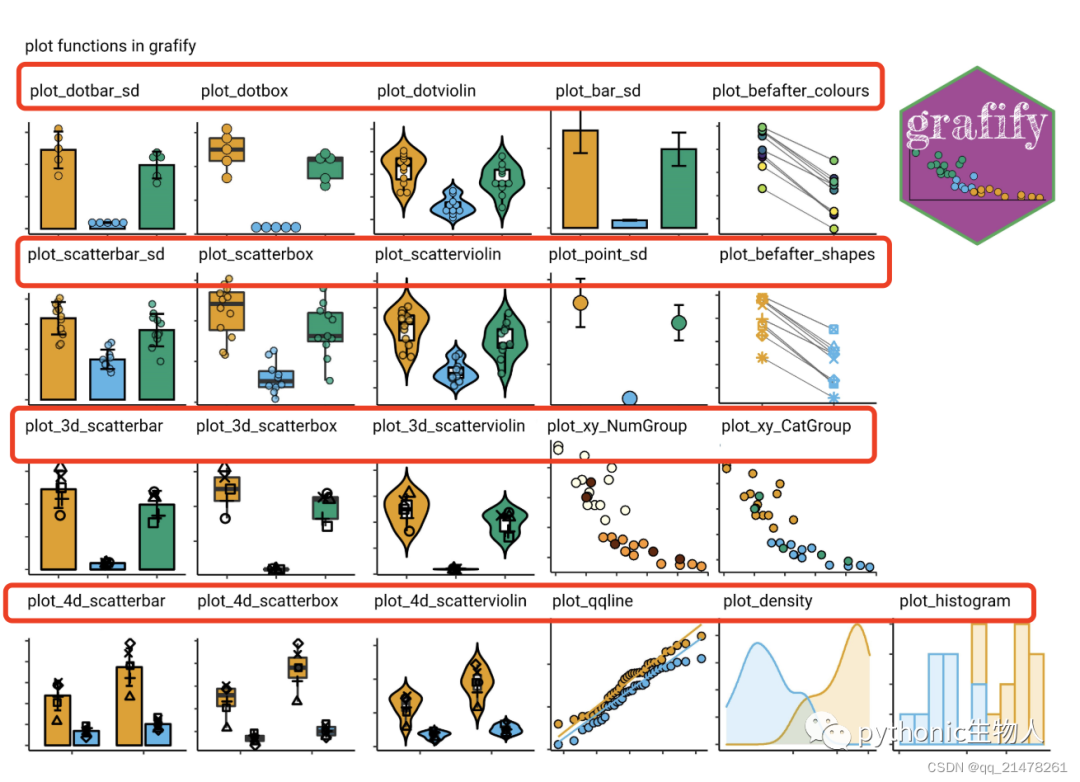 下面简单举例,说明grafify的使用:
demo0
plot_4d_scatterbar()实现3或4个分类变量bar图,
plot_4d_scatterbar(data_2w_Tdeath,
                   Genotype,
                   PI,
                   Time,
                   Experiment,
                   b_alpha = 0.7,
                   ColPal = "vibrant")+
  scale_colour_manual(values = c("black", "grey20"))+
  labs(title = "2way/RM, bars/SD",
       subtitle = "(shapes = randomised blocks)")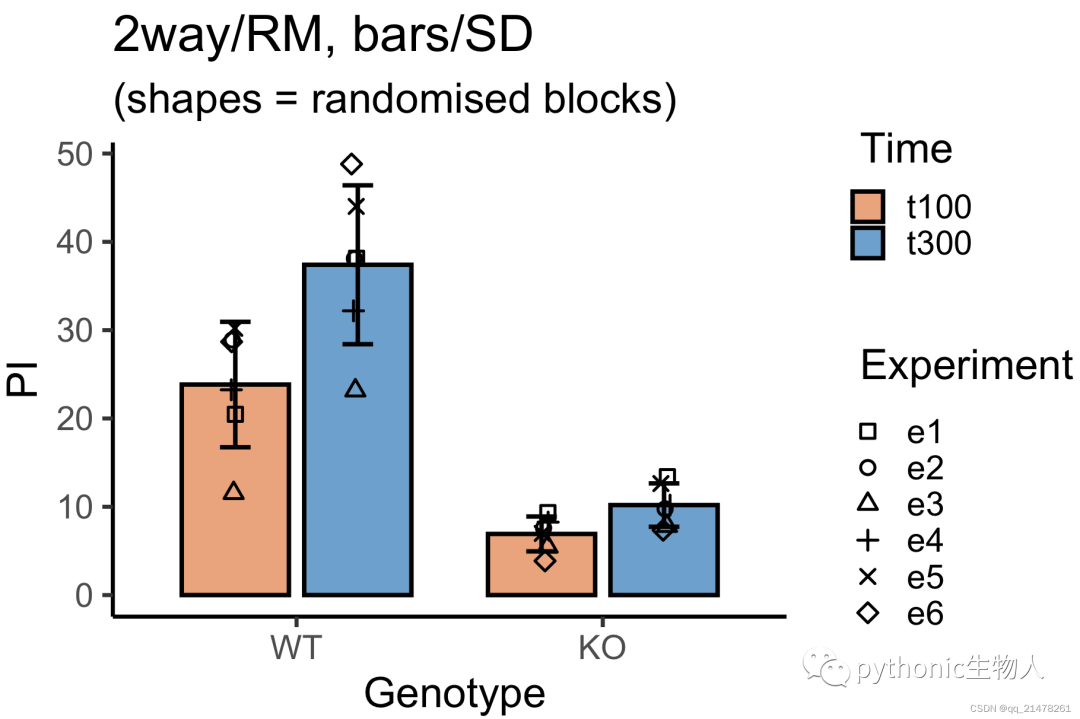
demo1
绘制一个组合图:bar图+散点图+SD,plot_scatterbar_sd()可轻松搞定
library('grafify') # 导入包
plot_scatterbar_sd(data = data_doubling_time,#使用内置数据集data_doubling_time
                   xcol = Student,           # 指定X轴变量
                   ycol = Doubling_time,     # 指定Y轴变量
                   SingleColour = "r4_1")+ # 指定颜色,这里取子调色盘r4
                   labs(title = "Scatter+bar+SD") # 设置标题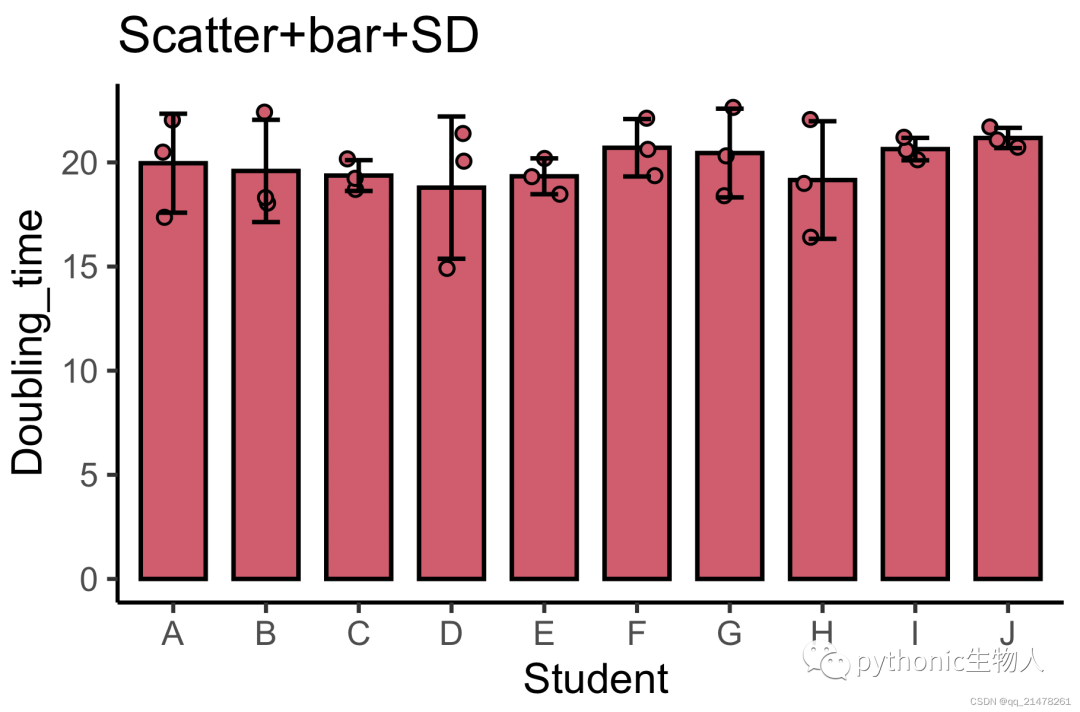
demo2
QQ图:使用plot_qqline()即可,
plot_qqline(data_t_pratio,
            log(Cytokine),
            Genotype)+
            labs(title = "QQ plot with plot_qqline()")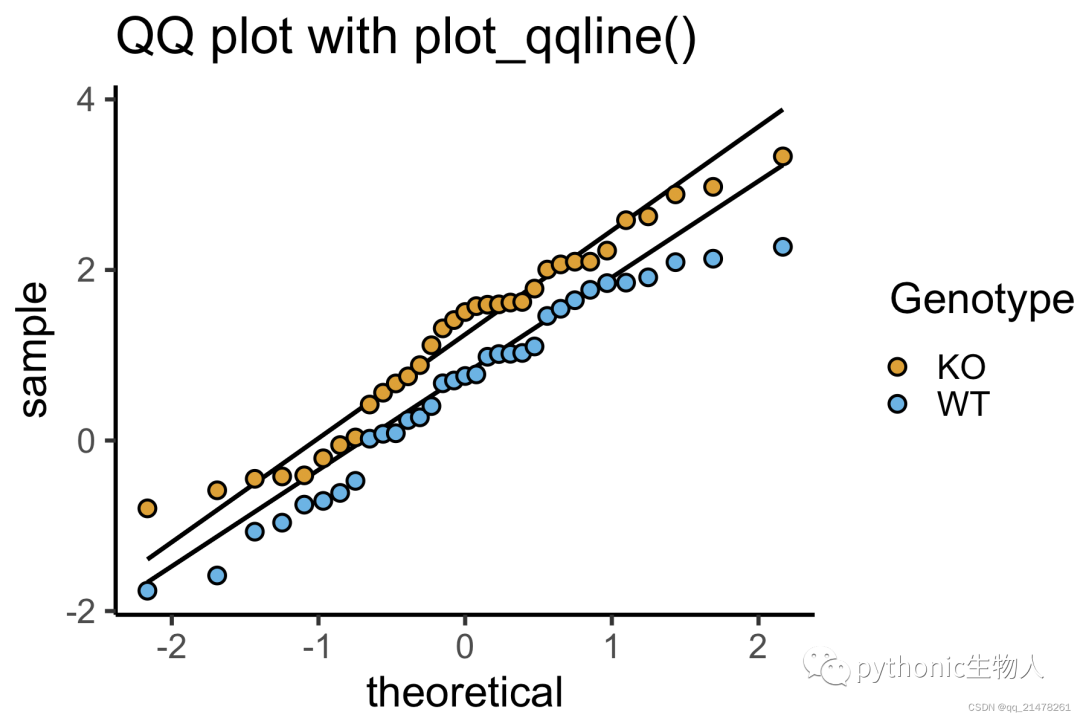
demo3
临床连线图:SCI文章中常用连线图比较一样本在干预前后的变化,grafify中plot_befafter_colours()可轻松实现,
plot_befafter_colours(data = data_t_pdiff,
                      xcol = Condition,
                      ycol = Mass,
                      match = Subject,
                      symsize = 5,
                      ColPal = "r4",
                      ColRev = T)+
  labs(title = "TBefore-after with plot_befafter_colours")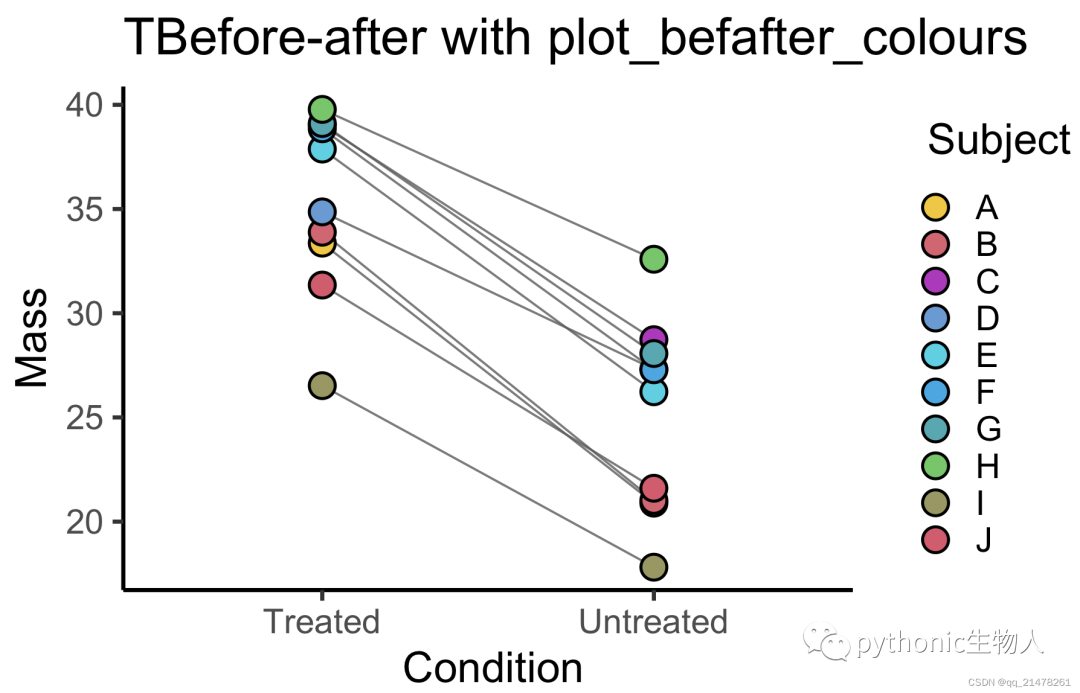
demo4
plot_xy_NumGroup()
plot_xy_NumGroup(dplyr::filter(diamonds, cut == "Premium" & clarity == "SI1"),
                 depth,
                 price,
                 carat,
                 s_alpha = .5,
                 ColPal = "grey_conti")+ #colschem
  labs(title = "plot_xy_NumGroup()")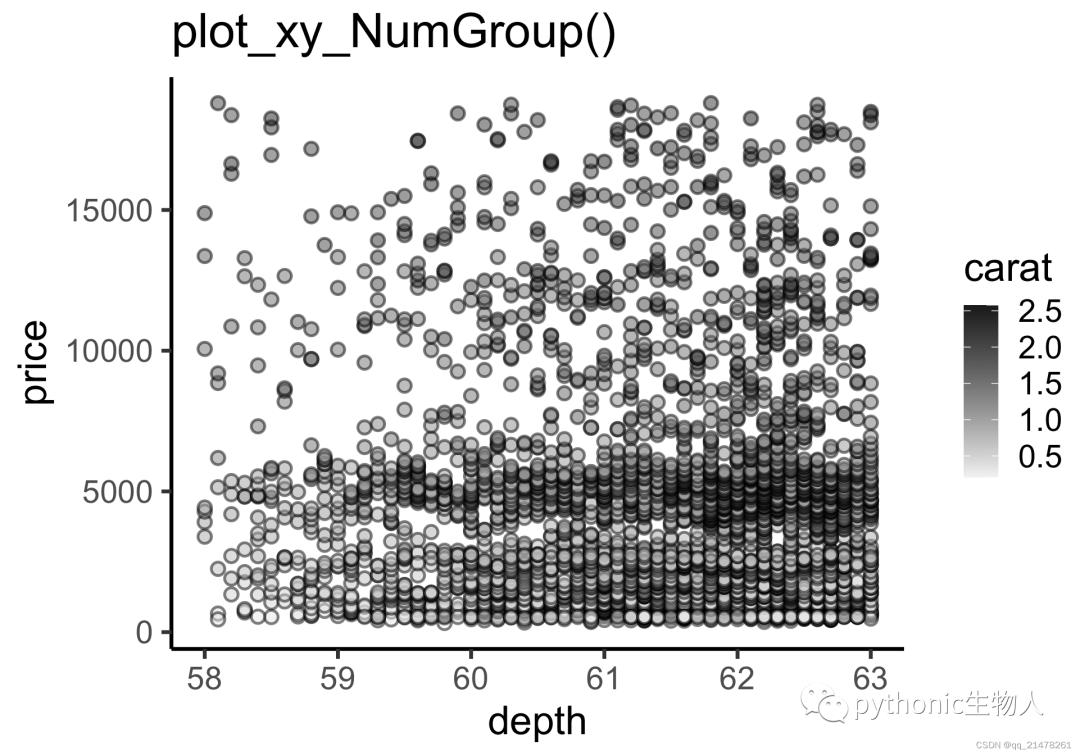
grafify方差分析
该部分不详细介绍,主要支持以下几类ANOVA:
Simple linear models: One-way ANOVA, Two-way ANOVAMixed effects models: One-way ANOVA & randomised blocks,Two-way ANOVA & randomised blocks,Two-way ANOVA, repeated-measures & randomised blocksPosthoc comparisons:posthoc_Pariwise, posthoc_Levelwise, posthoc_vsRef
参考:https://github.com/ashenoy-cmbi/grafify

往期精彩回顾


适合初学者入门人工智能的路线及资料下载(图文+视频)机器学习入门系列下载机器学习及深度学习笔记等资料打印《统计学习方法》的代码复现专辑机器学习交流qq群955171419,加入微信群请扫码
边栏推荐
- Mysql重启后innodb和myisam插入的主键id变化总结
- 别再用if-else了,分享一下我使用“策略模式”的项目经验...
- What knowledge points do you need to master to learn software testing?
- 层次分析法
- 字节最爱问的智力题,你会几道?
- pandas连接oracle数据库并拉取表中数据到dataframe中、生成当前时间的时间戳数据、格式化为指定的格式(“%Y-%m-%d-%H-%M-%S“)并添加到csv文件名称中
- 想学自动化测试网课哪个好?过了人告诉你:适合自己的才是最重要
- 如图,想批量读取mysql,批量处理,有哪个地方参数需要改变呢?
- 一些测试相关知识
- Simple implementation of a high-performance clone of Redis using .NET (1)
猜你喜欢

shell编程条件语句
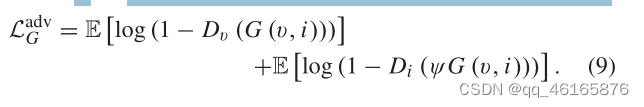
Image fusion DDcGAN study notes
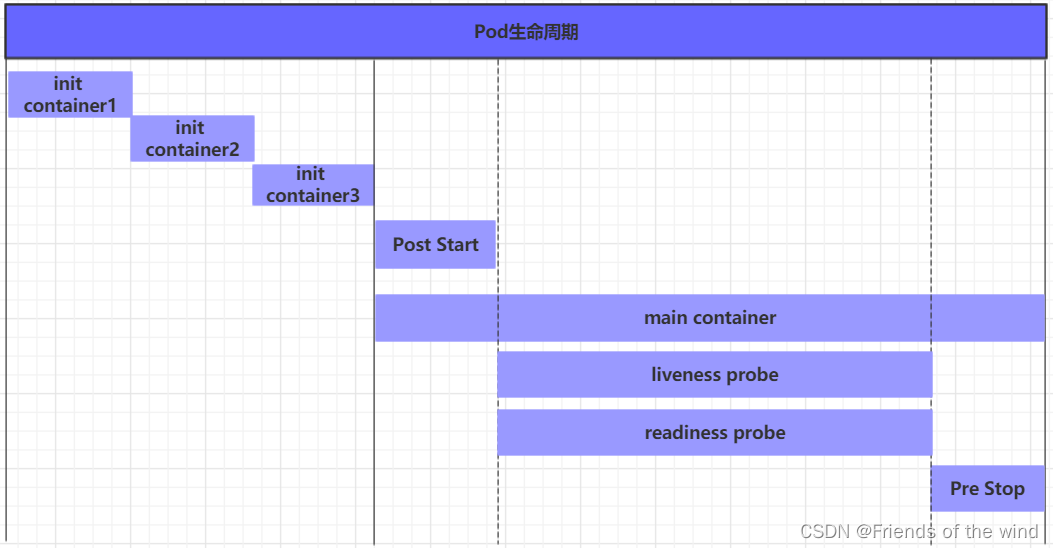
【精品必知】Pod生命周期

超多精美礼品等你来拿!2022年中国混沌工程调查启动

How to build an overseas purchasing system/purchasing website - source code analysis
第4章 搭建网络库&Room缓存框架
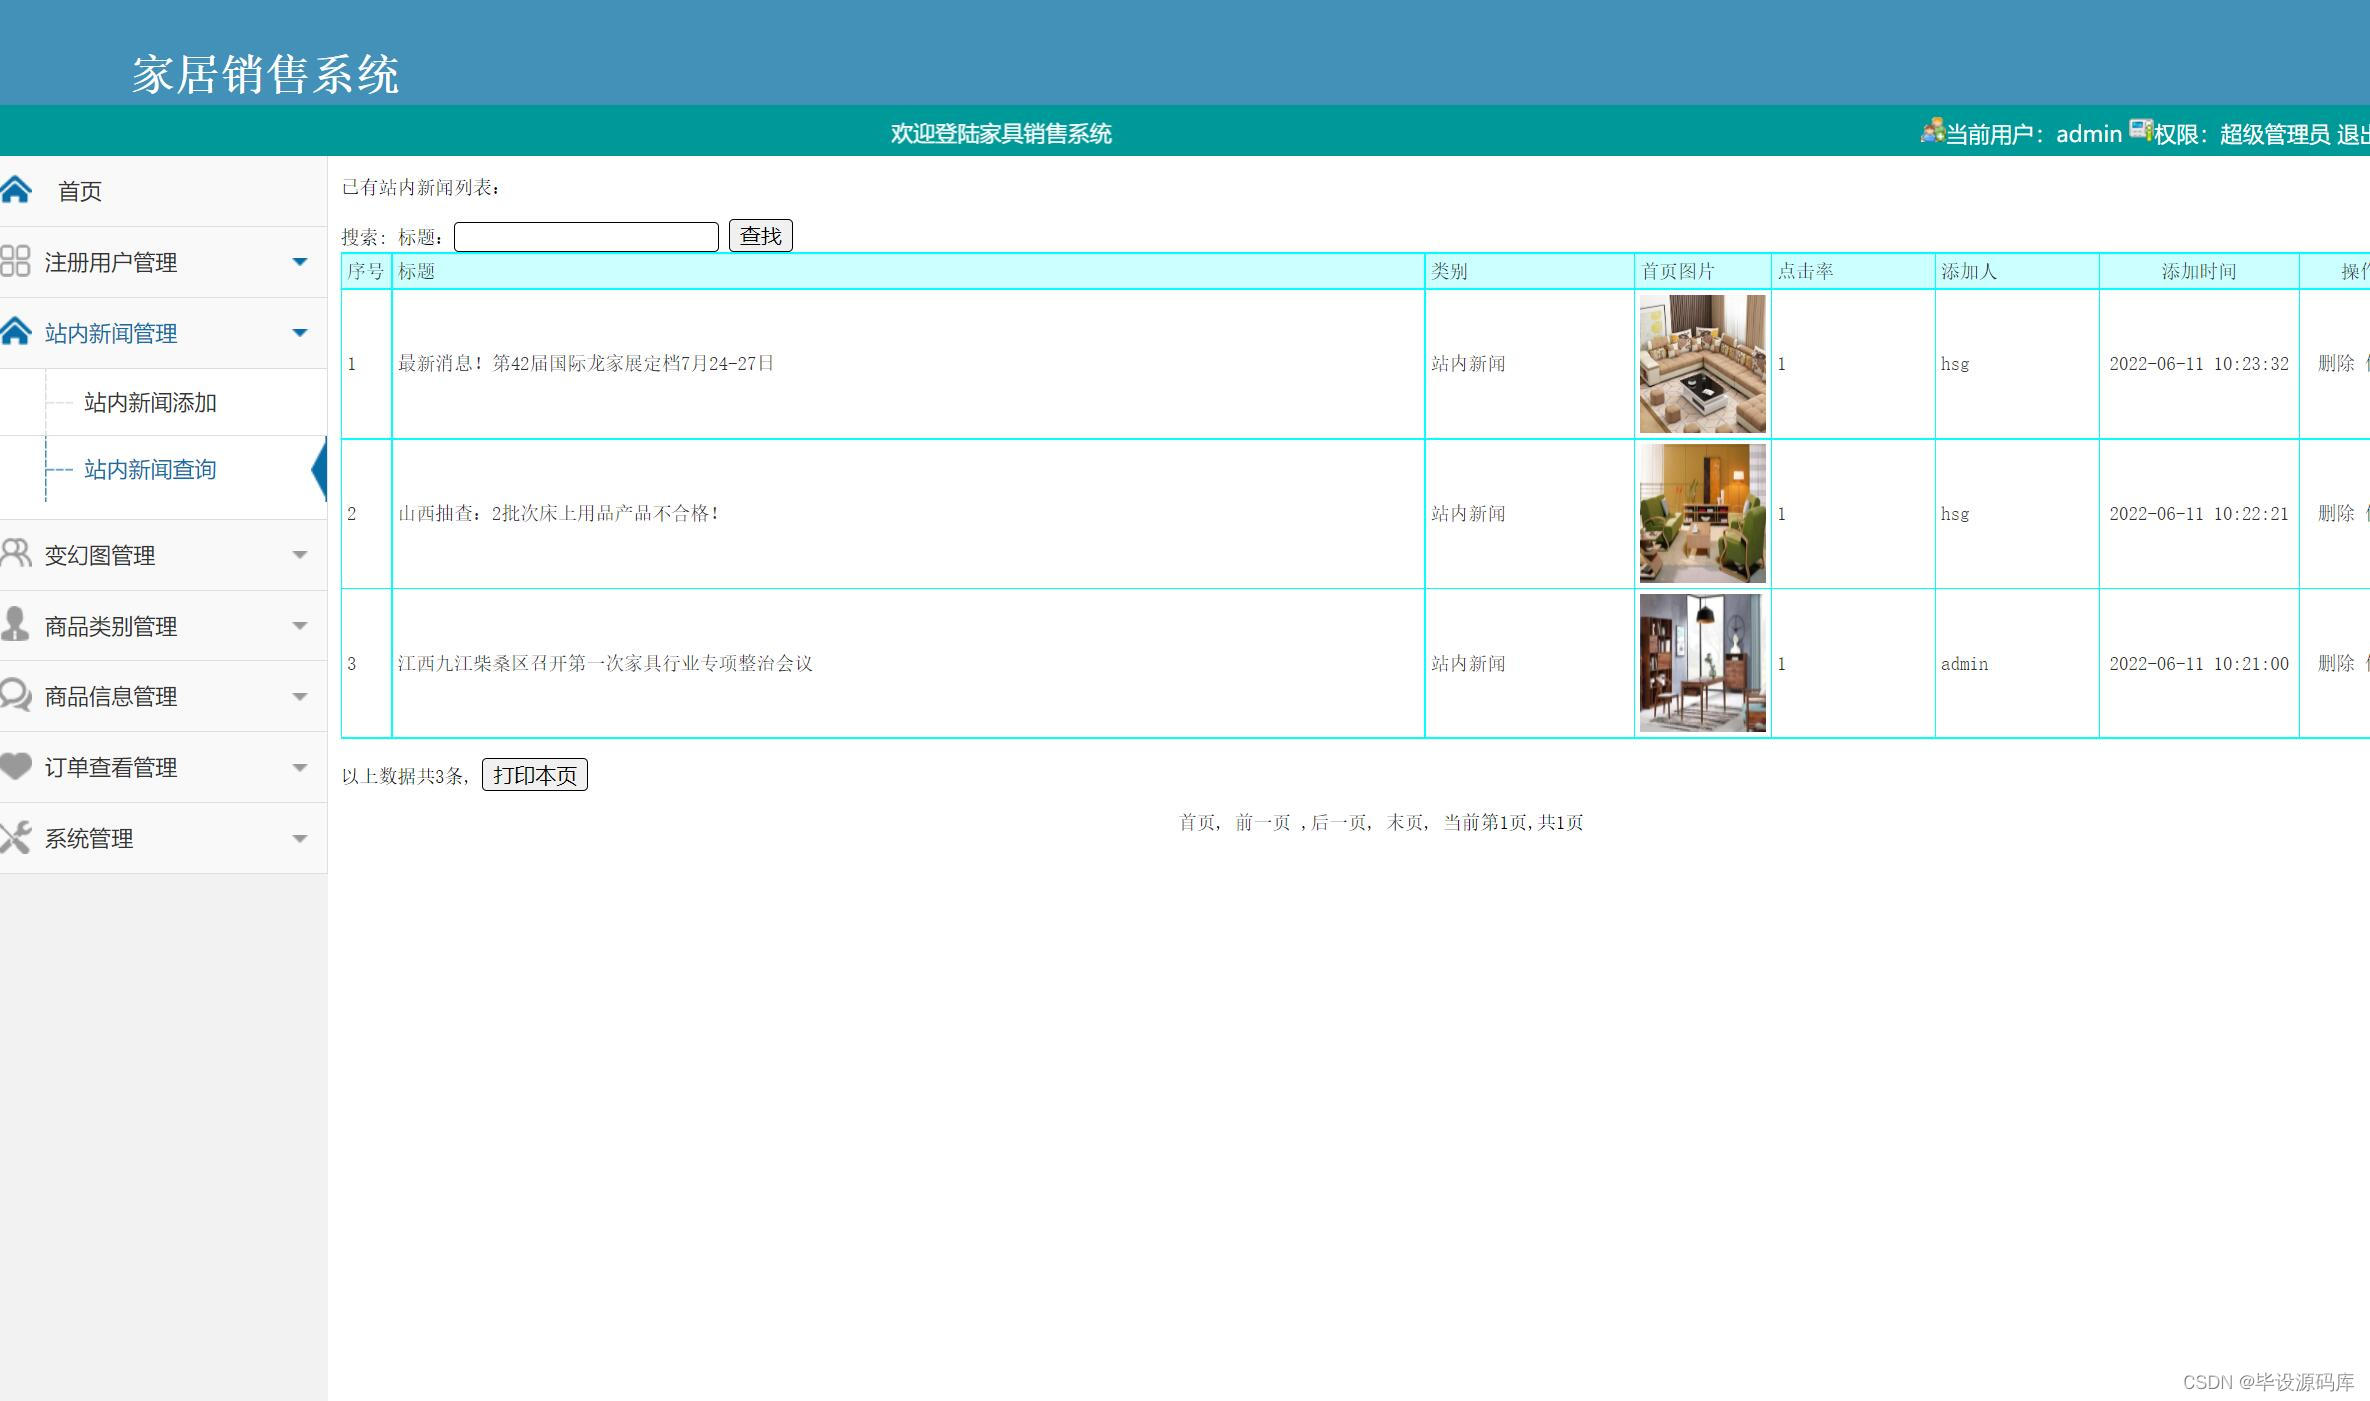
基于php家具销售管理系统获取(php毕业设计)
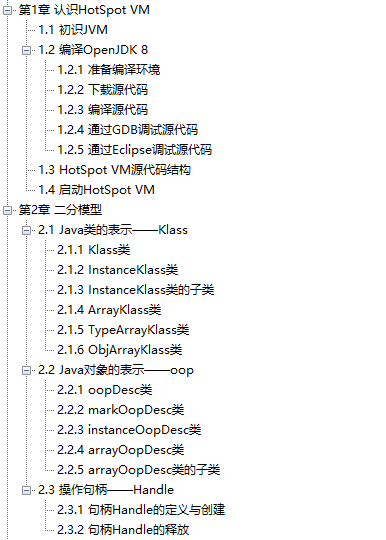
Explain the virtual machine in detail!JD.com produced HotSpot VM source code analysis notes (with complete source code)
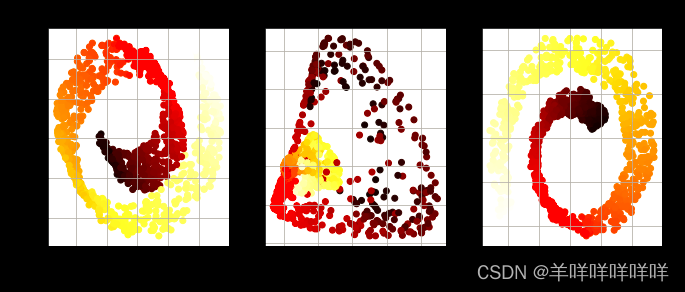
特征降维学习笔记(pca和lda)(1)
肝完Alibaba这份面试通关宝典,我成功拿下今年第15个Offer
随机推荐
From scratch Blazor Server (6) - authentication based on strategy
期货公司开户关注的关键点
如何免费获得一个市全年的气象数据?降雨量气温湿度太阳辐射等等数据
bash case usage
After completing the interview and clearance collection of Alibaba, I successfully won the 15th Offer this year
基于php家具销售管理系统获取(php毕业设计)
Feature dimensionality reduction study notes (pca and lda) (1)
pytorch+tensorboard使用方法
YOLOv5训练数据提示No labels found、with_suffix使用、yolov5训练时出现WARNING: Ignoring corrupted image and/or label
别再用if-else了,分享一下我使用“策略模式”的项目经验...
-找树根-
安全自定义 Web 应用程序登录
字节最爱问的智力题,你会几道?
[Verilog] HDLBits Problem Solution - Verification: Writing Testbenches
From the physical level of the device to the circuit level
Take you understand the principle of CDN technology
【云原生 · Kubernetes】部署Kubernetes集群
浅谈程序员的职业操守
Byte's favorite puzzle questions, how many do you know?
Five super handy phone open-source automation tools, which is suitable for you?