当前位置:网站首页>Windows 10 tensorflow (2) regression analysis of principles, deep learning framework (gradient descent method to solve regression parameters)
Windows 10 tensorflow (2) regression analysis of principles, deep learning framework (gradient descent method to solve regression parameters)
2020-11-06 01:22:00 【Elementary school students in IT field】
windows10 tensorflow( Two ) Regression analysis of principle and actual combat , Deep learning framework ( The gradient descent method is used to solve the regression parameters )
TF Data generation : Reference resources TF The data generated 12 Law
TF Basic principles and conceptual understanding : tensorflow( One )windows 10 64 Bit installation tensorflow1.4 And basic concept interpretation tf.global_variables_initializer
Model :
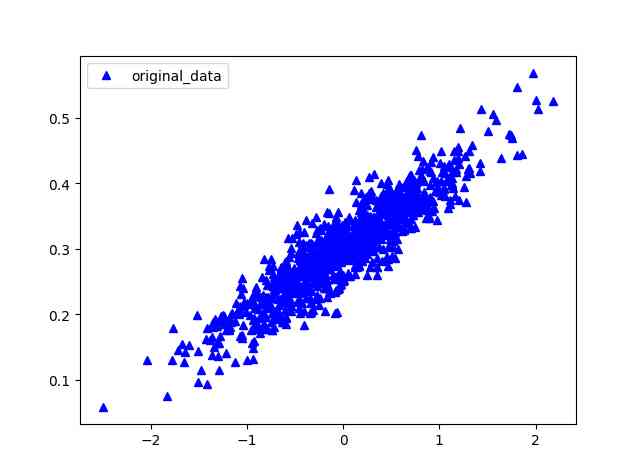
A simple linear regression y = W * x + b, use numpy Building complete regression data , And increase interference noise
import numpy as np
# Establish a linear regression equation of one variable y=0.1x1+0.3  , At the same time, a positive distribution deviation np.random.normal(0.0,0.03) For witnessing TF The algorithm of
num_points=1000
vectors_set=[]
for  i in  range(num_points):
    x1=np.random.normal(loc=0.0,scale=0.66)
    y1=x1*0.1+0.3+np.random.normal(0.0,0.03)
    vectors_set.append([x1,y1])
x_data=[v[0] for v in vectors_set]
y_data=[v[1] for v in vectors_set]
Graphic display Data distribution results
import matplotlib.pyplot as plt
#https://www.cnblogs.com/zqiguoshang/p/5744563.html
##line_styles=['ro-','b^-','gs-','ro--','b^--','gs--']  #set line style
plt.plot(x_data,y_data,'ro',marker='^',c='blue',label='original_data')
plt.legend()
plt.show()
adopt TensorFlow The code finds the best parameters W And b, Make the input data of x_data, Generate output data y_data, In this case, there will be a straight line y_data=W*x_data+b. The reader knows W It will be close 0.1,b near 0.3, however TensorFlow Don't know , It needs to calculate the value itself . Therefore, the gradient descent method is used to solve the data iteratively
import tensorflow as tf
import math
# One 、 establish graph data
# Arbitrarily construct the parameters of a univariate regression equation W And b
W=tf.Variable(tf.random_uniform([1], minval=-1.0, maxval=1.0))
b=tf.Variable(tf.zeros([1]))
y=W*x_data+b
# Define the following minimum variance
#1. Define the minimum square root of error
loss=tf.reduce_mean(tf.square(y-y_data))
#2.learning_rate=0.5
optimizer=tf.train.GradientDescentOptimizer(learning_rate=0.5)
#3. Optimize the minimum
train=optimizer.minimize(loss)
# Two 、 Initialize variable
init=tf.global_variables_initializer()
# 3、 ... and 、 start-up graph
sess=tf.Session()
sess.run(init)
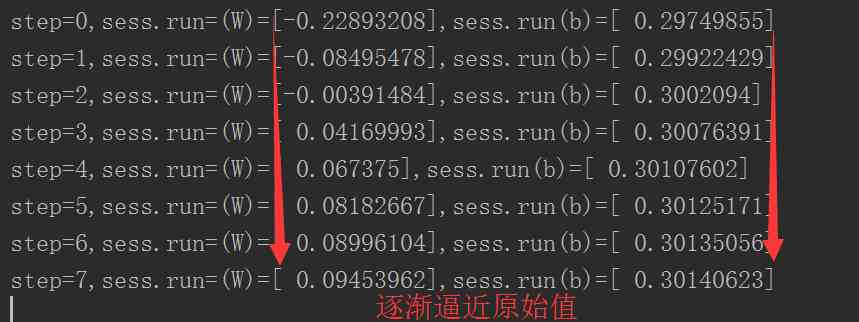
for step in range(8):
sess.run(train)
print("step={},sess.run=(W)={},sess.run(b)={}".format(step,sess.run(W),sess.run(b)))
Here's the iteration 8 Results of . Gradient is like a compass , Guiding us in the smallest direction . To calculate the gradient ,TensorFlow It will take the derivative of the wrong function , In our case , The algorithm needs to work on W and b Calculating partial derivatives , To indicate the direction of advance in each iteration .
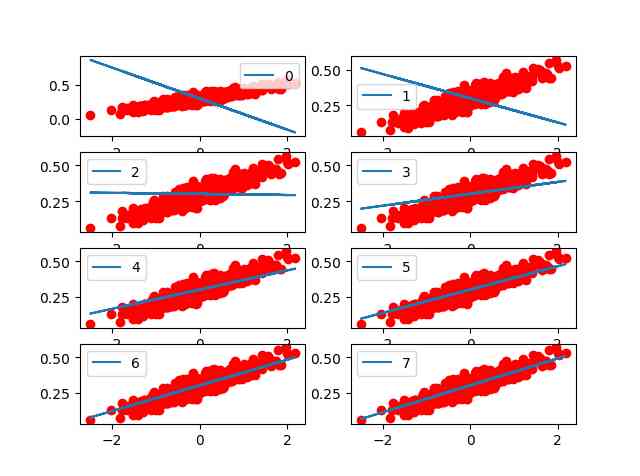
The following is the visualization of each iteration :
#Graphic display
    # print(sub_1+'41')
    # Be careful : You can use commas for each parameter , Separate . The first parameter represents the number of rows in the subgraph ; The second parameter represents the number of columns in the row of images ;  The third parameter represents the number of images in each row , From left to right , From top to next add .
    plt.subplot(4,2,step+1)
	plt.plot(x_data,y_data,'ro')
	plt.plot(x_data,sess.run(W)*x_data+
	sess.run(b),label=step)
    plt.legend()
plt.show()

版权声明
本文为[Elementary school students in IT field]所创,转载请带上原文链接,感谢
边栏推荐
- ipfs正舵者Filecoin落地正当时 FIL币价格破千来了
- 基於MVC的RESTFul風格API實戰
- PHPSHE 短信插件说明
- Use of vuepress
- Didi elasticsearch cluster cross version upgrade and platform reconfiguration
- Nodejs crawler captures ancient books and records, a total of 16000 pages, experience summary and project sharing
- Deep understanding of common methods of JS array
- How to get started with new HTML5 (2)
- Using consult to realize service discovery: instance ID customization
- Classical dynamic programming: complete knapsack problem
猜你喜欢

What is the side effect free method? How to name it? - Mario
Face to face Manual Chapter 16: explanation and implementation of fair lock of code peasant association lock and reentrantlock
How long does it take you to work out an object-oriented programming interview question from Ali school?

Just now, I popularized two unique skills of login to Xuemei

如何将数据变成资产?吸引数据科学家
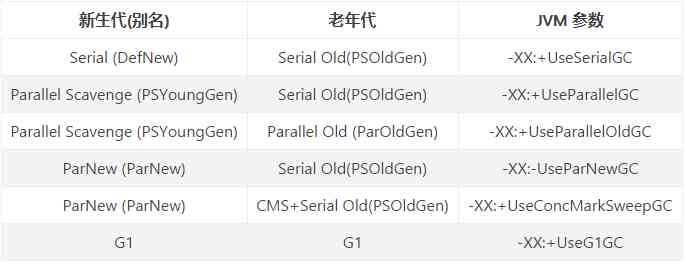
JVM memory area and garbage collection
How do the general bottom buried points do?
教你轻松搞懂vue-codemirror的基本用法:主要实现代码编辑、验证提示、代码格式化
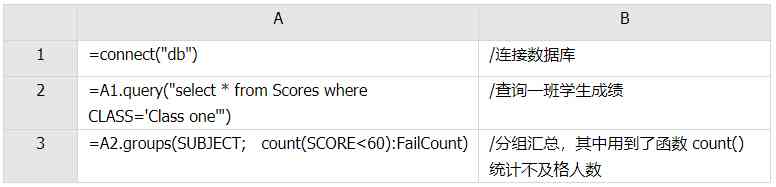
Examples of unconventional aggregation
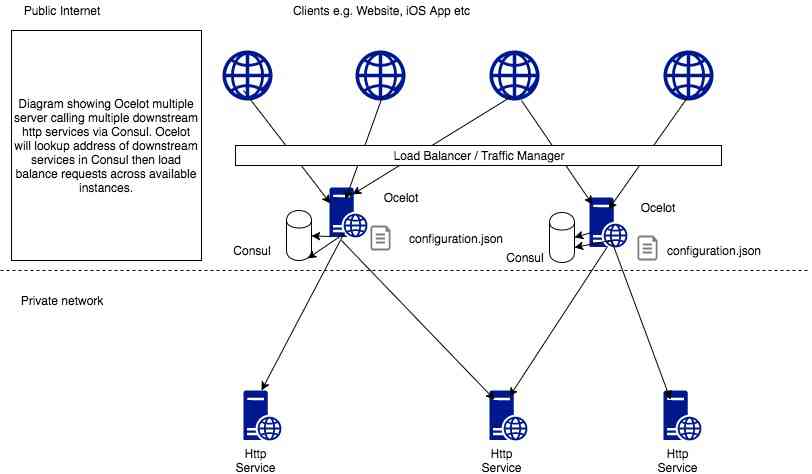
(1) ASP.NET Introduction to core3.1 Ocelot
随机推荐
Jmeter——ForEach Controller&Loop Controller
Elasticsearch 第六篇:聚合統計查詢
In depth understanding of the construction of Intelligent Recommendation System
Serilog原始碼解析——使用方法
速看!互联网、电商离线大数据分析最佳实践!(附网盘链接)
How to demote a domain controller in Windows Server 2012 and later
Every day we say we need to do performance optimization. What are we optimizing?
6.2 handleradapter adapter processor (in-depth analysis of SSM and project practice)
I'm afraid that the spread sequence calculation of arbitrage strategy is not as simple as you think
H5 makes its own video player (JS Part 2)
Not long after graduation, he earned 20000 yuan from private work!
PHPSHE 短信插件说明
Elasticsearch database | elasticsearch-7.5.0 application construction
(2)ASP.NET Core3.1 Ocelot路由
Nodejs crawler captures ancient books and records, a total of 16000 pages, experience summary and project sharing
從小公司進入大廠,我都做對了哪些事?
Why do private enterprises do party building? ——Special subject study of geek state holding Party branch
Common algorithm interview has been out! Machine learning algorithm interview - KDnuggets
Programmer introspection checklist
Details of dapr implementing distributed stateful service