当前位置:网站首页>Machine learning - decision tree
Machine learning - decision tree
2022-07-06 07:44:00 【Tc. Xiaohao】
List of articles
One 、 Decision tree
- Decision tree is a tree structure , Each internal node represents a test on an attribute , Each branch represents a test output , Each leaf node represents a category .
- Step by step from the root node to the leaf node .
- All the data will end up in the leaf node , It can be classified or regressed
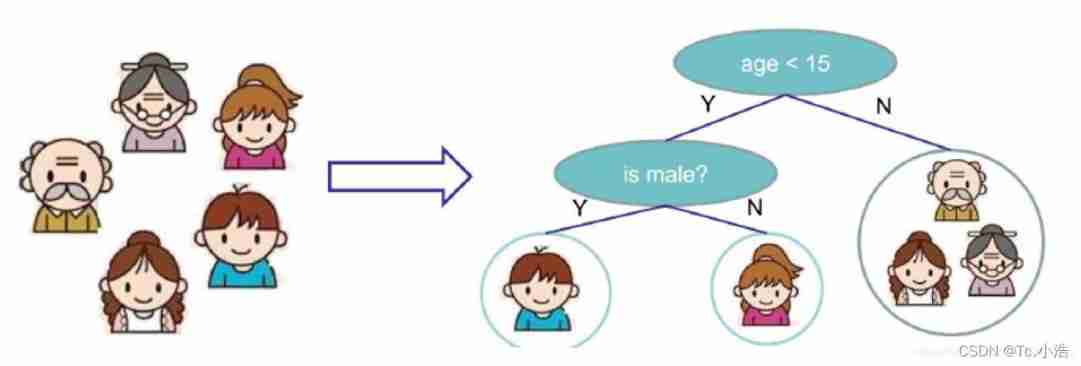
Think of a family as a piece of data , Enter into the decision tree , First, we will judge whether the age is greater than 15 year ( Artificially subjective value ), If it is greater than 15, It is judged that it is less likely to play the game , Less than or equal to 15 At the age of, they think they are more likely to play games , Then subdivide it in the next step , Determine gender , If you are a boy, you think you are more likely to play games , If you are a girl, you are less likely to like playing games .
This is a simple decision tree process , It's kind of like the beginning python The progress of learning if-else The procedure for classifying grades of good and bad grades . however , The order of classification in the decision tree is usually not interchangeable , For example, why should we put the judgment of age before the judgment of gender , It is because we hope that the first decision and judgment can realize the screening of most data , Do everything you can right , Then proceed to the next step , Then realize the fine adjustment of the deviation data in the previous step , Therefore, the importance of the root node can be imagined , It should realize the rough judgment of data samples , Filter out more accurate data . You can compare basketball games , Of course, first in the starting lineup , Second, I'm considering substitutes , Supplement the short board .
So here's the problem ?( How to select the root node )—— Why should we divide by age first , Or what makes you think they're starting ?
What is the basis of judgment ??? The next? ? How to segment the secondary root node ???
Training and testing of decision tree
- Training phase : Construct a tree from a given training set ( Select features from nodes , How to segment features )
- Testing phase : According to the constructed mathematical model, just make a series from top to bottom
- Once the decision tree is constructed , So the task of classification or prediction is very simple , It only needs one time , So the difficulty is how to construct a tree ?
Two 、 Entropy function
The goal is : Pass a measure , To calculate the classification situation after branch selection through different features , Find the best one as the root node , And so on .
The measure - entropy : Entropy is a measure of the uncertainty of a random variable ( explain : Speaking human is the degree of chaos inside an object , For example, there is everything in the voluntary grocery market. It must be chaotic , If only one brand is sold in the exclusive store, it will be much more stable )
for instance : as follows ,A After the decision classification is completed, there are three triangles and two circles on one side , The other side is a triangle , and B After the decision classification, one side is triangle and the other side is circle , Obviously B The decision-making judgment of the scheme is more reliable , Using entropy to explain is that the smaller the entropy ( The lower the level of confusion ), The more effective the decision is 
The formula :
Here, the above example is used to interpret the formula , Just look at the classification results on the left , about B Medium , Only the triangle , That is, a classification result , p i p_i pi
Is the value probability , It's here for 100%, Let's combine log function , Its value is [0,1] Between them is increasing , Then adding a minus sign in front is decreasing , So the B The calculation formula value brought in by the classification result on the right is 0, and 0 It's the lowest value in this formula again . Look again A The classification result on the left side of the middle , Because there are two situations , So there is accumulation in the formula , Calculate the entropy of the two results respectively , Finally, summarize , Its value must be greater than 0 Of , so A There are many categories in , Entropy is much larger ,B The categories in are relatively stable ( Then, when the classification task is heavy, do we want the entropy value of the data category to be large or small after branching through the node ?)
Not really , Before classification, the data has an entropy , After adopting the decision tree, there will also be entropy , Also take A give an example , The initial state is five triangles and three circles ( Corresponding to an entropy value 1), After the decision, three triangles and two circles on the left are formed ( Corresponding entropy 2) And the two triangles on the right, a circle ( Corresponding entropy 3), If the final entropy 2+ Entropy 3 < Entropy 1, Then we can judge that the classification is better , Better than before , That is, by comparing entropy ( uncertainty ) The degree of reduction determines whether the decision is good or bad , It doesn't just look at the size of entropy after classification , It depends on the change of entropy before and after decision-making .
3、 ... and 、 Decision tree construction example
Here we use the sample data provided on the official website to explain , The data is 14 Days of playing ( The actual situation ); Characterized by 4 Kinds of environmental changes ( x i x_i xi ); The final goal is to build a decision tree to predict whether to play or not (yes|no), The data are as follows
x 1 x_1 x1: outlook
x2 : temperature
x3 : humidity
x4: windy
play: yes|no
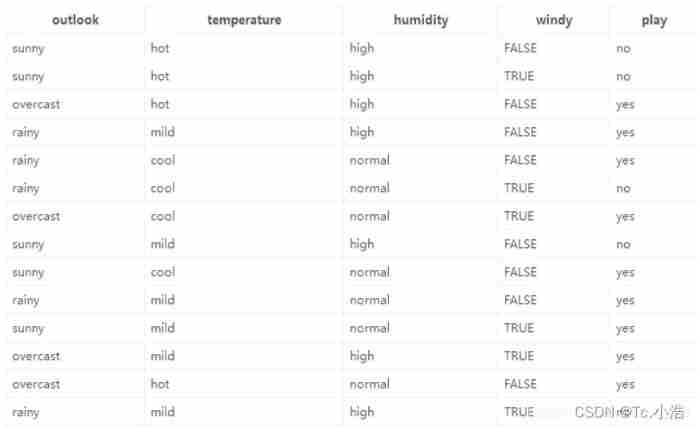
According to the data, there are 4 Species characteristics , Therefore, when building the decision tree, the choice of root node has 4 In this case , as follows . So back to the original question , Which is the root node ? whether 4 All kinds of division methods are OK ? therefore Information gain It's about to make a formal appearance
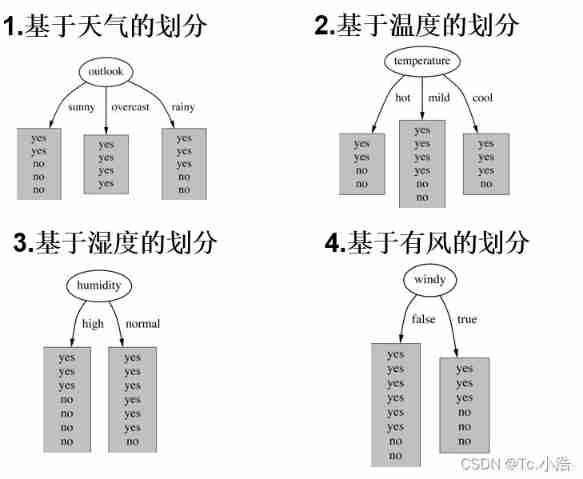
Because it is to judge the change of entropy before and after decision-making , First, make sure that in the historical data (14 God ) Yes 9 Heaven plays ,5 God doesn't play , So the entropy at this point should be ( commonly log The bottom of the function 2, It is required to unify the base number when calculating ):
Start with the first feature , Calculate the change of entropy after decision tree classification , Or use the formula to calculate 
Be careful : Directly compare the calculated result with the initial result calculated above ? ( Of course not. ,outlook Fetch sunny,overcast,rainy There are different probabilities , Therefore, the final calculation results should consider this situation )
The final entropy calculation is :14 In the day 5 God sunny,4 God overcast,5 God rainy
Information gain : The entropy of the system changes from the original 0.940 Down to 0.693, The gain is
gain(outlook)=0.247
By analogy , The information gains of the remaining three feature classifications can be calculated as follows :
$
gain(temperature)=0.029,gain(humidity)=0.152,gain(windy)=0.048$
Finally, we can choose the biggest one , So I went through the features , Found the root node ( The eldest brother ), Then continue to find child nodes through information gain in the rest ( The second )…, Finally, the whole decision tree is built !
Four 、 Information gain rate and gini coefficient
Before, we used information gain to judge whether there is any problem with the root node , Or whether this method exists bug, Some problems cannot be solved ??? The answer is of course , For example, use the one above 14 Personal playing data , Add a feature here, which is the number of times you play ID, Respectively 1,2,3,…,12,13,14, Then if the decision is made according to this feature , as follows 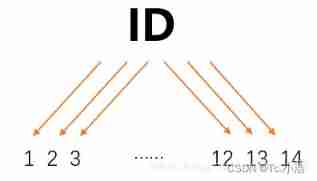
The results of decision-making and judgment based on this feature can be found to be a single branch , The result of calculating entropy is 0, The result information gain of this classification is the largest , It shows that this feature is very useful , If you still judge by information gain , The tree model will follow ID Select the root node , In fact, it is not feasible to make decisions and judgments in this way , Just watch every time you play ID I can't say whether I can play on this day .
From the above example, it can be found that information gain cannot solve this feature classification ( similar ID) There are many cases with special results , Therefore, another decision tree algorithm called Information gain rate and gini coefficient
Here is an introduction to the algorithm used in building the decision tree ( As for the previous English address , Just know that it is a referential relationship , For example, information gain can also be used ID3 To said ):
gini The coefficient calculation formula is similar to the measurement standard of entropy , But the calculation method is different , The smaller the value here, the better the effect of this decision classification , For example, when p The cumulative value of is taken as 1 了 , Then the final result is 0, When p When the value is small , After squared, it's smaller , The result of this calculation is close to 1 了
Information gain rate It is an improvement of the method of Judging according to entropy , and gini coefficient Is to start a new stove , Has its own calculation method
5、 ... and 、 Decision tree pruning strategy
Why pruning : Decision tree over fitting is risky , In theory, data can be completely separated
pruning strategy : pre-pruning , After pruning
pre-pruning : At the same time, the decision tree is established and the pruning operation is carried out
After pruning : When the decision tree is established, pruning operation is carried out later
Pre pruning method : Limit depth ( For example, after specifying a specific value, it will not be split )、 Number of leaf nodes 、 Number of leaf node samples 、 Information gain, etc
Back pruning method : By a certain measure , C α ( T ) = C ( T ) + α ∗ ∣ T l e a f ∣ C α ( T ) = C ( T ) + α ∗ ∣ T_{ l e a f} | Cα(T)=C(T)+α∗∣Tleaf∣, More leaf nodes , The greater the loss
Post pruning workflow , For example, select the following nodes , Judge whether it will not split ? The condition of not splitting is that the result after splitting is worse than that before splitting .
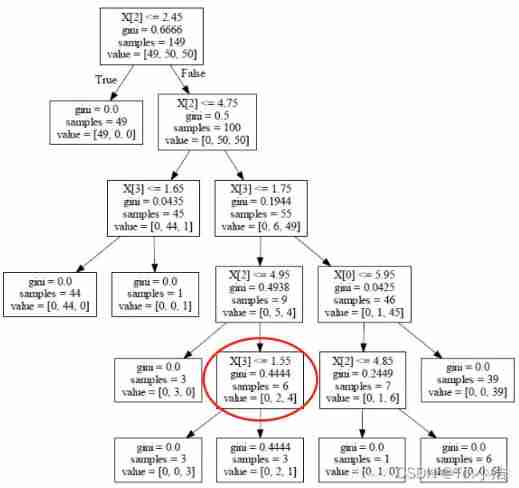
According to the above calculation formula , Before splitting
C α ( T ) = 0.4444 ∗ 6 + 1 ∗ α C_{\alpha}(T) =0.4444*6 + 1* \alpha Cα(T)=0.4444∗6+1∗α
After splitting, the sum of the two leaf nodes is added
C α ( T ) = 3 ∗ 0 + 1 ∗ α + 0.4444 ∗ 3 + 1 ∗ α = 0.444 ∗ 3 + 2 ∗ α C_{\alpha}(T) =3*0+1* \alpha + 0.4444*3+1* \alpha=0.444*3 + 2* \alpha Cα(T)=3∗0+1∗α+0.4444∗3+1∗α=0.444∗3+2∗α
Finally, it becomes comparing the two values , The greater the value, the greater the loss , The worse , The size of the value depends on our given α value ,α The greater the value given , The more the model controls over fitting , When the value is small, we want the model to achieve better results , But fitting is not very important
6、 ... and 、 classification 、 Return to the task
The tree model does the classification task , What determines the type in a leaf node ? Also use the original illustration as an example , Tree model belongs to supervised algorithm , The data is already labeled before input , For example, below “-” For not playing games .“+” Represents playing games , Then there are three classification results in the red box on the right “-” The data of , The modes of the data are classified as “-”, So if there is data in this category later , Will be marked as “-”, Therefore, the classification task is determined by the mode of the data in the leaf node , The minority is subordinate to the majority , There are... In a leaf node 10 individual “-”,2 individual “+”, Then the leaf node is classified as “-”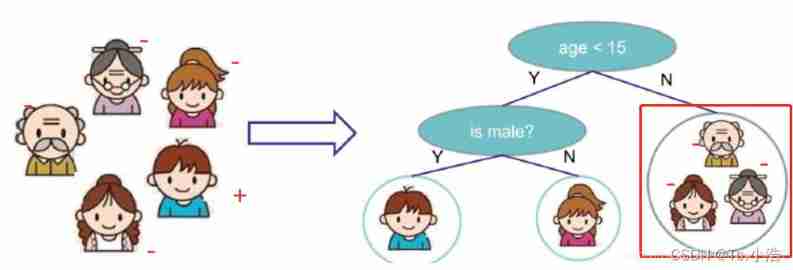
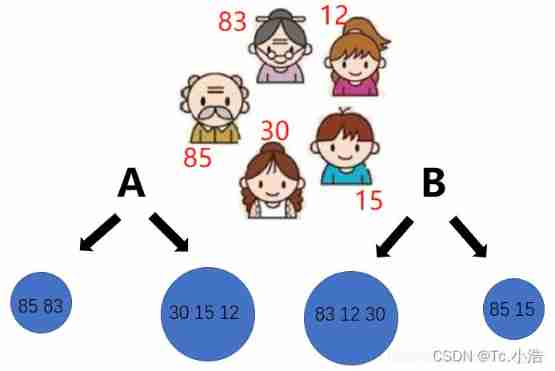
The approach of regression task and classification task is almost the same , But the way of evaluation is different , Regression is measured by variance , For example, judge the above five people according to their age , Whether it is the elderly , In fact A programme , Obviously, its variance is less than B Variance in the scheme , That is, man-made A The division method in the scheme is more reasonable . Since the problem of data regression cannot be avoided , The numerical calculation method in the leaf node is the average of each data , Then, when using the tree model for prediction , If the data falls into the leaf node, the value is the average value calculated before , If so A The right leaf node in the scheme , The predicted result is (30+15+12) /3 =19
Reference resources :https://blog.csdn.net/lys_828/article/details/108669442
边栏推荐
- word设置目录
- Three no resumes in the software testing industry. What does the enterprise use to recruit you? Shichendahai's resume
- Pre knowledge reserve of TS type gymnastics to become an excellent TS gymnastics master
- 成为优秀的TS体操高手 之 TS 类型体操前置知识储备
- 49. Sound card driven article collection
- Iterator Foundation
- 解决方案:智慧工地智能巡检方案视频监控系统
- 数据治理:数据质量篇
- Word setting directory
- Comparison of usage scenarios and implementations of extensions, equal, and like in TS type Gymnastics
猜你喜欢
Codeforces Global Round 19(A~D)
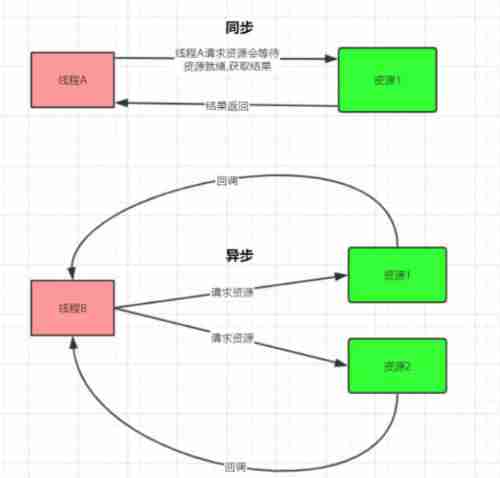
NiO programming introduction

The ECU of 21 Audi q5l 45tfsi brushes is upgraded to master special adjustment, and the horsepower is safely and stably increased to 305 horsepower
![Ble of Jerry [chapter]](/img/d8/d080ccaa4ee530ed21d62755808724.png)
Ble of Jerry [chapter]
![[CF Gym101196-I] Waif Until Dark 网络最大流](/img/66/6b339fc23146b5fbdcd2a1fa0a2349.png)
[CF Gym101196-I] Waif Until Dark 网络最大流
![Ble of Jerry [chapter]](/img/ed/32a5d045af8876d7b420ae9058534f.png)
Ble of Jerry [chapter]
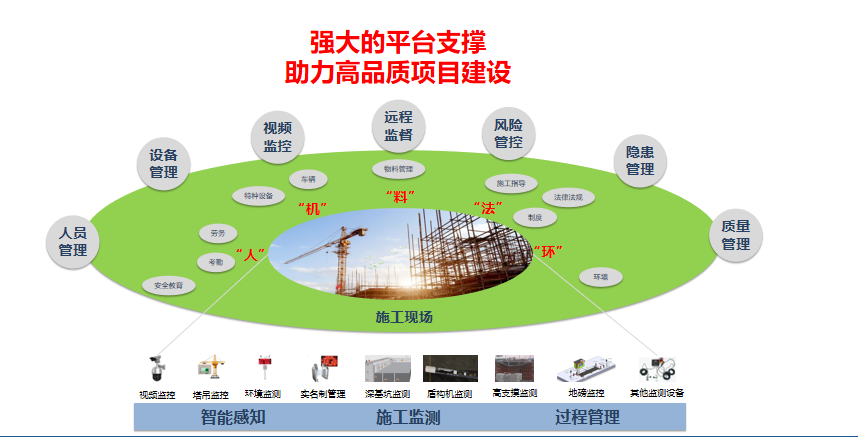
Solution: système de surveillance vidéo intelligent de patrouille sur le chantier
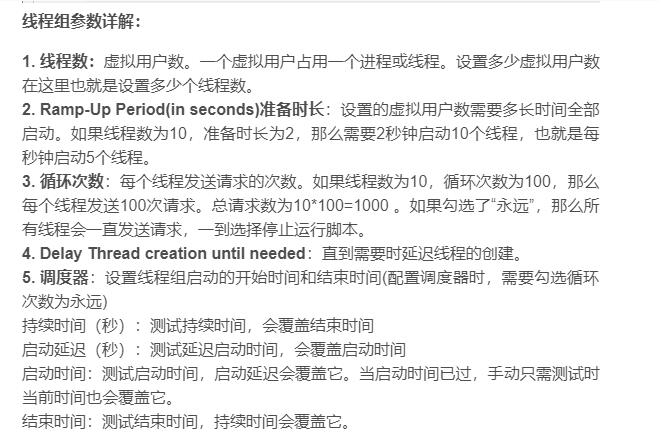
jmeter性能测试步骤实战教程
![When the Jericho development board is powered on, you can open the NRF app with your mobile phone [article]](/img/3e/3d5bff87995b4a9fac093a6d9f9473.png)
When the Jericho development board is powered on, you can open the NRF app with your mobile phone [article]
![Jerry's ad series MIDI function description [chapter]](/img/28/e0f9b41db597ff3288af431c677001.png)
Jerry's ad series MIDI function description [chapter]
随机推荐
Is the super browser a fingerprint browser? How to choose a good super browser?
Generator Foundation
Codeforces Global Round 19(A~D)
49. Sound card driven article collection
[count] [combined number] value series
Typescript indexable type
TS 类型体操 之 extends,Equal,Alike 使用场景和实现对比
octomap averageNodeColor函数说明
Risk planning and identification of Oracle project management system
Google may return to the Chinese market after the Spring Festival.
Comparison of usage scenarios and implementations of extensions, equal, and like in TS type Gymnastics
[window] when the Microsoft Store is deleted locally, how to reinstall it in three steps
Three no resumes in the software testing industry. What does the enterprise use to recruit you? Shichendahai's resume
How to prevent Association in cross-border e-commerce multi account operations?
. Net 6 learning notes: what is NET Core
NiO programming introduction
leecode-C語言實現-15. 三數之和------思路待改進版
Opencv learning notes 8 -- answer sheet recognition
After the hot update of uniapp, "mismatched versions may cause application exceptions" causes and Solutions
xpath中的position()函数使用