当前位置:网站首页>Comics: looking for the best time to buy and sell stocks
Comics: looking for the best time to buy and sell stocks
2020-11-08 13:02:00 【I'm sorry.】
Some time ago , Xiaohui released the next two on the stock trading algorithm problem explanation , It has inspired a lot of interest from small partners .
This time, , Xiao Hui integrates these two comics together , And fixed some of the details of the error , Thank you for your advice .


————— the second day —————


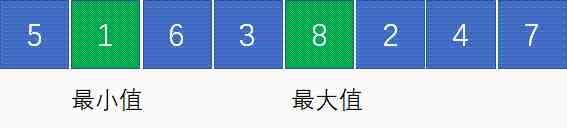
What does that mean ? Let's take an example , Given the following array :

The corresponding stock up and down curve of this array is as follows :
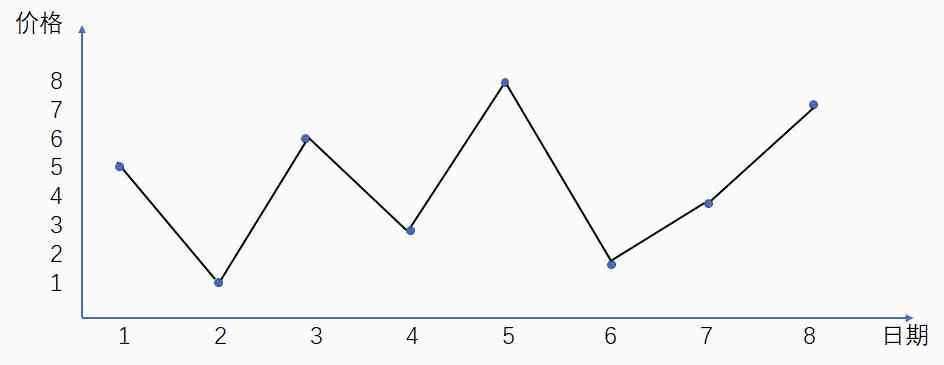
obviously , From 2 The price is 1 Buy when , From 5 The price is 8 Sell when , You can get the most out of it :
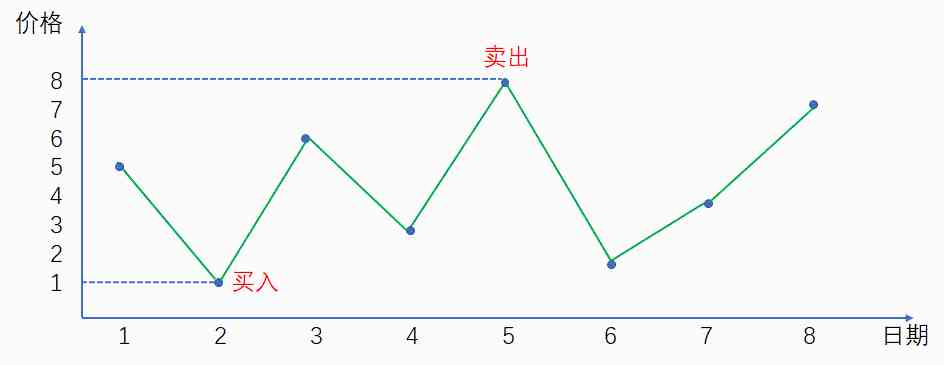
The biggest payoff at this point is 8-1=7.


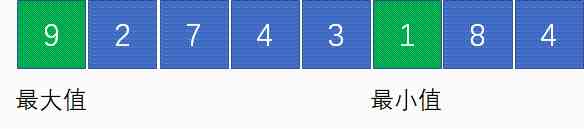
In the example above , Maximum 9 At the minimum 1 In front of , How can we trade ? We can't turn back time ?


————————————


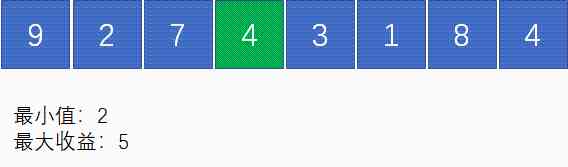
The following is an example , If we have set the price 4 It's time to sell , So which is the best time to buy ?
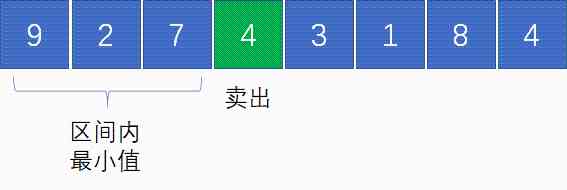
We have to choose the price 4 The previous interval , And must be the minimum value in the interval , obviously , The best choice is price 2 The timing of the .


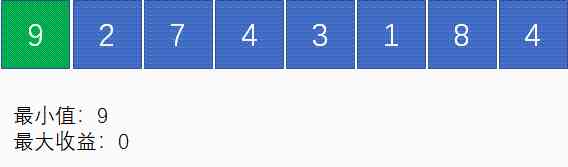
The first 1 Step , Initialization operation , Put the first 1 Elements as temporary minimum price ; The initial value of maximum return is 0:
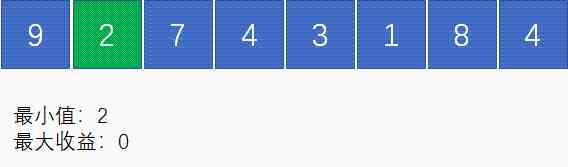
The first 2 Step , Traverse to the 2 Elements , because 2<9, So the current minimum price becomes 2; There is no need to calculate the difference ( Because the front element is bigger than it ), The biggest benefit is still 0:
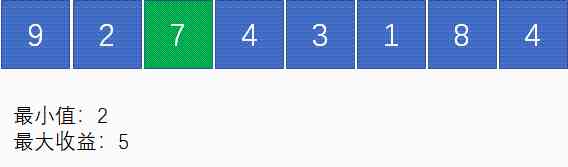
The first 3 Step , Traverse to the 3 Elements , because 7>2, So the current minimum price is still 2; As we said just now , Suppose the price 7 For selling point , The best buy point for that is the price 2, The difference between the two 7-2=5,5>0, So the biggest payoff right now is 5:
The first 4 Step , Traverse to the 4 Elements , because 4>2, So the current minimum price is still 2;4-2=2,2<5, So the biggest payoff is still 5:
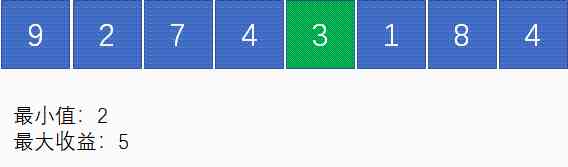
The first 5 Step , Traverse to the 5 Elements , because 3>2, So the current minimum price is still 2;3-2=1,1<5, So the biggest payoff is still 5:
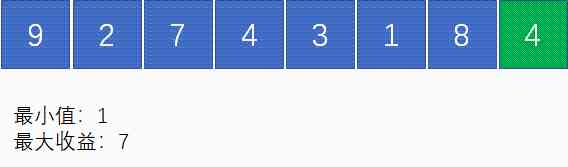
And so on , We walk through the end of the array , The minimum price at this time is 1; The biggest benefit is 8-1=7:


public class StockProfit {

    public static int maxProfitFor1Time(int prices[]) {
        if(prices==null || prices.length==0) {
            return 0;
        }
        int minPrice = prices[0];
        int maxProfit = 0;
        for (int i = 1; i < prices.length; i++) {
            if (prices[i] < minPrice) {
                minPrice = prices[i];
            } else if(prices[i] - minPrice > maxProfit){
                maxProfit = prices[i] - minPrice;
            }
        }
        return maxProfit;
    }

    public static void main(String[] args) {
        int[] prices = {9,2,7,4,3,1,8,4};
        System.out.println(maxProfitFor1Time(prices));
    }

}


Let's take the array in the following figure for example , Take a visual look at the timing of buying and selling :
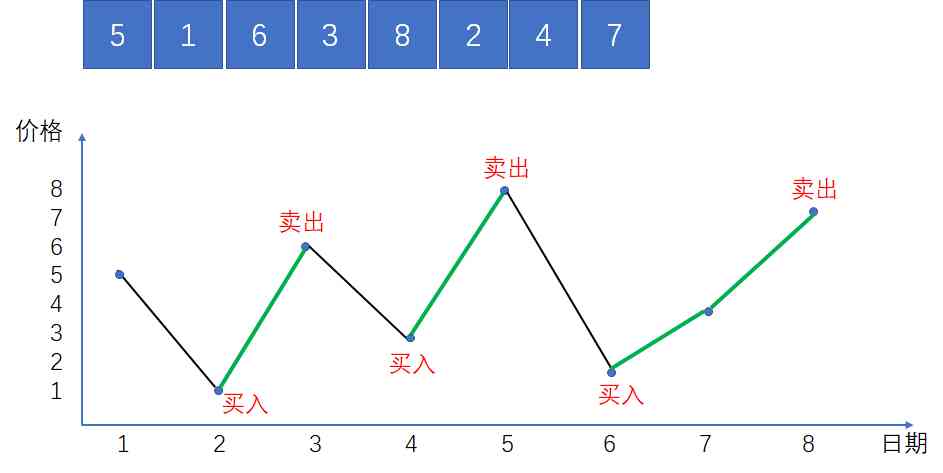
In the picture , The green line represents the stage of price rise . Since there is no limit to the number of transactions , So we can buy at every low point , Sell at every high .
thus , All the green parts are our gains , The maximum total return is the sum of these local returns :
(6-1)+(8-3)+(4-2)+(7-4) = 15
As for how to judge these green rising stages ? It's simple , We traverse the entire array , But where the latter is greater than the former , It means that the stock price is in the rising stage .

    public int maxProfitForAnyTime(int[] prices) {
        int maxProfit = 0;
        for (int i = 1; i < prices.length; i++) {
            if (prices[i] > prices[i-1])
                maxProfit += prices[i] - prices[i-1];
        }
        return maxProfit;
    }


Let's still take the previous array as an example :
First , Look for 1 The best buy and sell point under the sub limit :

It's impossible to cross the two positions , So we found number one 1 After the second trading position , Take out this pair of buy and sell points and the elements in between :

Next , We follow the same line of thinking , And then look for the rest of the elements 2 The best buy and sell point for sub - Sales :

thus , We found the most 2 The best choice in the case of sub sales :


For the array above , If we solve it twice independently , The best buy and sell points are 【1,9】 and 【6,7】, The biggest benefit is (9-1)+(7-6)=9:

But actually , If you choose 【1,8】 and 【3,9】, The biggest benefit is (8-1)+(9-3)=13>9:


When the first 1 The next best buy and sell point is determined , The first 2 What kind of situation will there be in the position of buying and selling points ?
situation 1: The first 2 Second best buy and sell point , In the 1 Buy sell left

situation 2: The first 2 Second best buy and sell point , In the 1 On the right side of the buying and selling point

situation 3: The first 1 The buy and sell range is cut off from the middle , Split it back into two deals

that , How to judge what kind of situation a given stock price array belongs to ? It's simple , In the 1 After the next maximum buying and selling point is determined , We can compare which situation brings about the largest increase in revenue :

Looking for the biggest gains on the left and right is easy to understand , What's the use of looking for the biggest drop in the middle ?
Think about it and you'll know , When the first 1 When the sale needs to be split up , The biggest drop in the trading range , It's the same as the profit increment after the split ( Similar to the bottom of the stock market operation ):

thus , We can sum up the following formula :
Maximum total revenue = The first 1 The second largest return + Max( The biggest gain on the left , The biggest drop in the middle , The biggest gain on the right )


So called dynamic programming , It is to simplify a complex problem into smaller subproblems , And then from the simple subproblem from the bottom up step by step recursion , Finally, we get the optimal solution of complex problems .
First , Let's analyze the current stock trading problem , This problem requires a certain number of days to be solved 、 The maximum return under a certain number of transactions .
Since the limit on the maximum trading of shares 2 Time , Then the stock transaction can be divided into 5 Stages :
No business
The first 1 Buy... Times
The first 1 Time to sell
The first 2 Buy... Times
The first 2 Time to sell
We set the trading stage of a stock as a variable m( Use from 0 To 4 The value of represents ), Set the range of days as a variable n. And the biggest benefit of our solution is , Influenced by these two variables , It can be expressed as follows :
The biggest gain = F(n,m)(n>=1,0<=m<=4)
Since functions and variables have been determined , Next, we're going to identify two elements of dynamic planning :
1. The initial state of the problem
2. The state transition equation of the problem
What is the initial state of the problem ? We assume that the range of trading days is limited to 1 God , That is to say n=1 The situation of :

1. If there is no business , That is to say m=0 when , The biggest benefit is obviously 0, That is to say F(1,0)= 0
2. If there is 1 Buy... Times , That is to say m=1 when , It's equivalent to subtracting the first one out of thin air 1 Day's share price , The biggest profit is negative day stock price , That is to say F(1,1)= -price[0]
3. If there is 1 Time to buy , That is to say m=2 when , The sale offsets ( Of course , It doesn't make sense ), The biggest benefit is 0, That is to say F(1,2)= 0
4. If there is 2 Buy... Times , That is to say m=3 when , Same as m=1 The situation of ,F(1,3)= -price[0]
5. If there is 2 Time to sell , That is to say m=4 when , Same as m=2 The situation of ,F(1,4)= 0
The initial state is determined , Let's take a look at the state shift . If the range of days is limited from n-1 Days increased to n God , So what happens to the maximum return ?

It depends on what stage is it now ( It's the number of buying and selling ), And for the first time n Day stock price operation ( purchase 、 Sell or wait and see ). Let's analyze the situation at each stage :
1. If there was no sale before , And the first n The sky is still watching , So the biggest payoff is still 0, namely F(n,0) = 0
2. If there was no sale before , And the first n Days to buy , So the biggest return is the negative day stock price , namely F(n,1)= -price[n-1]
3. If there was 1 Buy... Times , And the first n God chooses to wait and see , So the maximum profit is the same as before , namely F(n,1)= F(n-1,1)
4. If there was 1 Buy... Times , And the first n Days to sell , So the biggest payoff is 1 The negative return on the second purchase plus the share price of the day , That is to say F(n,2)= F(n-1,1)+ price[n-1]
5. If there was 1 Time to sell , And the first n God chooses to wait and see , So the maximum profit is the same as before , namely F(n,2)= F(n-1,2)
6. If there was 1 Time to sell , And the first n Days go on 2 Buy... Times , So the biggest payoff is 1 The second sale income minus the share price of the day , namely F(n,3)= F(n-1,2) - price[n-1]
7. If there was 2 Buy... Times , And the first n God chooses to wait and see , So the maximum profit is the same as before , namely F(n,3)= F(n-1,3)
8. If there was 2 Buy... Times , And the first n Days to sell , So the biggest payoff is 2 The second buy income minus the share price of the day , namely F(n,4)= F(n-1,3) + price[n-1]
9. If there was 2 Time to sell , And the first n God chooses to wait and see ( I can only wait and see ), So the maximum profit is the same as before , namely F(n,4)= F(n-1,4)
Last , We put the situation 【2,3】,【4,5】,【6、7】,【8,9】 Merge , It can be summed up as follows 5 An equation :
F(n,0) = 0
F(n,1)= max(-price[n-1],F(n-1,1))
F(n,2)= max(F(n-1,1)+ price[n-1],F(n-1,2))
F(n,3)= max(F(n-1,2)- price[n-1],F(n-1,3))
F(n,4)= max(F(n-1,3)+ price[n-1],F(n-1,4))
From the back 4 In the equation , We can sum up the relationship between the maximum return of each stage and the previous stage :
F(n,m) = max(F(n-1,m-1)+ price[n-1],F(n-1,m))
From this we can conclude that , The complete state transition equation is as follows :


In the table , Different lines represent the maximum return under different day limits , The different columns represent the maximum returns at different stages of trading .
We still use the array from the previous example , Fill in the table on this basis :
First , We fill in the initial state for the table :

Next , We're starting to fill in the 2 Row data .
When there is no business , The maximum benefit must be 0, therefore F(2,0) The result is 0:

According to the previous state transition equation ,F(2,1)= max(F(1,0)-2,F(1,1))= max(-2,-1)= -1, So the first 2 Xing di 2 The result of the column is -1:

F(2,2)= max(F(1,1)+2,F(1,2))= max(1,0)= 1, So the first 2 Xing di 3 The result of the column is 1:

F(2,3)= max(F(1,2)-2,F(1,3))= max(-2,-1)= -1, So the first 2 Xing di 4 The result of the column is -1:

F(2,4)= max(F(1,3)+2,F(1,4))= max(1,0)= 1, So the first 2 Xing di 5 The result of the column is 1:

And then we go on with the state transition equation , Fill first 3 Row data :

Next, fill in the 4 That's ok :

And so on , We've been filling in the entire form :

As shown in the figure , The last data in the table 13, It's the biggest benefit of the whole .


    // The maximum number of transactions
    private static int MAX_DEAL_TIMES = 2;

    public static int maxProfitFor2Time(int[] prices) {
        if(prices==null || prices.length==0) {
            return 0;
        }
        // The maximum number of rows in a table
        int n = prices.length;
        // The maximum number of columns in a table
        int m = MAX_DEAL_TIMES*2+1;
        // Record data using a two-dimensional array
        int[][] resultTable = new int[n][m];
        // Fill in the initial state
        resultTable[0][1] = -prices[0];
        resultTable[0][3] = -prices[0];
        // Bottom up , Fill in the data
        for(int i=1;i<n;++i) {
            for(int j=1;j<m;j++){
                if((j&1) == 1){
                    resultTable[i][j] = Math.max(resultTable[i-1][j], resultTable[i-1][j-1]-prices[i]);
                }else {
                    resultTable[i][j] = Math.max(resultTable[i-1][j], resultTable[i-1][j-1]+prices[i]);
                }
            }
        }
        // Return the final result
        return resultTable[n-1][m-1];
    }


    // The maximum number of transactions
    private static int MAX_DEAL_TIMES = 2;

    public static int maxProfitFor2TimeV2(int[] prices) {
        if(prices==null || prices.length==0) {
            return 0;
        }
        // The maximum number of rows in a table
        int n = prices.length;
        // The maximum number of columns in a table
        int m = MAX_DEAL_TIMES*2+1;
        // Record data using a one-dimensional array
        int[] resultTable = new int[m];
        // Fill in the initial state
        resultTable[1] = -prices[0];
        resultTable[3] = -prices[0];
        // Bottom up , Fill in the data
        for(int i=1;i<n;++i) {
            for(int j=1;j<m;j++){
                if((j&1) == 1){
                    resultTable[j] = Math.max(resultTable[j], resultTable[j-1]-prices[i]);
                }else {
                    resultTable[j] = Math.max(resultTable[j], resultTable[j-1]+prices[i]);
                }
            }
        }
        // Return the final result
        return resultTable[m-1];
    }
In this code ,resultTable From a two-dimensional array to a one-dimensional array . Because the maximum number of transactions is constant , So the spatial complexity of the algorithm also varies from O(n) Down to O(1).


    public static int maxProfitForKTime(int[] prices, int k) {
        if(prices==null || prices.length==0 || k<=0) {
            return 0;
        }
        // The maximum number of rows in a table
        int n = prices.length;
        // The maximum number of columns in a table
        int m = k*2+1;
        // Record data using a one-dimensional array
        int[] resultTable = new int[m];
        // Fill in the initial state
        for(int i=1;i<m;i+=2) {
            resultTable[i] = -prices[0];
        }
        // Bottom up , Fill in the data
        for(int i=1;i<n;i++) {
            for(int j=1;j<m;j++){
                if((j&1) == 1){
                    resultTable[j] = Math.max(resultTable[j], resultTable[j-1]-prices[i]);
                }else {
                    resultTable[j] = Math.max(resultTable[j], resultTable[j-1]+prices[i]);
                }
            }
        }
        // Return the final result
        return resultTable[m-1];
    }

—————END—————
Friends who like this article , Welcome to the official account Programmer Xiaohui , Watch more

Order one [ Looking at ], It's the biggest support for Xiao Hui !
版权声明
本文为[I'm sorry.]所创,转载请带上原文链接,感谢
边栏推荐
- Where is the new target market? What is the anchored product? |Ten questions 2021 Chinese enterprise service
- Win10 Terminal + WSL 2 安装配置指南,精致开发体验
- Top 5 Chinese cloud manufacturers in 2018: Alibaba cloud, Tencent cloud, AWS, telecom, Unicom
- 笔试面试题目:盛水最多的容器
- wanxin finance
- Get PMP certificate at 51CTO College
- 2018中国云厂商TOP5:阿里云、腾讯云、AWS、电信、联通 ...
- PMP experience sharing
- OR Talk NO.19 | Facebook田渊栋博士:基于蒙特卡洛树搜索的隐动作集黑盒优化 - 知乎
- 用科技赋能教育创新与重构 华为将教育信息化落到实处
猜你喜欢

Ali! Visual computing developer's series of manuals (with internet disk link)
Adobe media encoder /Me 2021软件安装包(附安装教程)
Service architecture and transformation optimization process of e-commerce trading platform in mogujie (including ppt)
Tight supply! Apple's iPhone 12 power chip capacity exposed
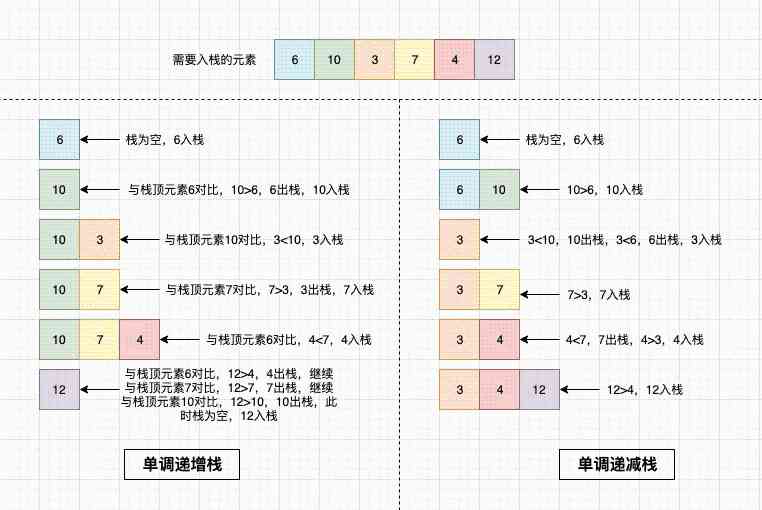
On monotonous stack
阿里撕下电商标签
优化if-else代码的八种方案
Suitable for C / C + + novice learning some projects, do not give me to miss!
wanxin finance
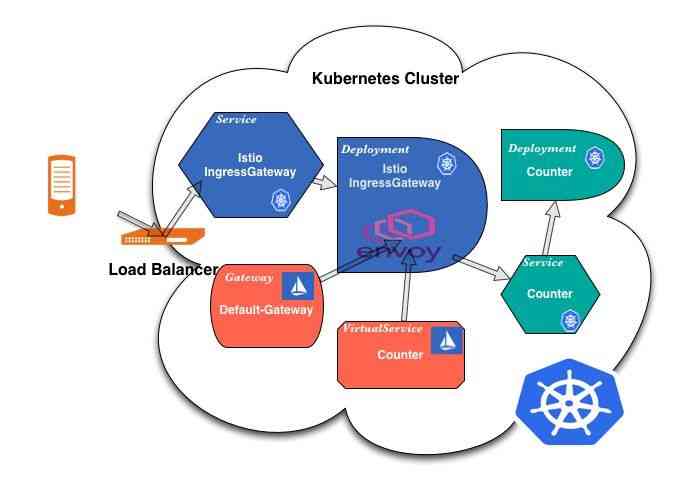
Istio流量管理--Ingress Gateway
随机推荐
为什么 Schnorr 签名被誉为比特币 Segwit 后的最大技术更新
在51CTO学院Get到PMP证书
Service architecture and transformation optimization process of e-commerce trading platform in mogujie (including ppt)
Top 5 Chinese cloud manufacturers in 2018: Alibaba cloud, Tencent cloud, AWS, telecom, Unicom
Adobe media encoder /Me 2021软件安装包(附安装教程)
蘑菇街电商交易平台服务架构及改造优化历程(含PPT)
2018中国云厂商TOP5:阿里云、腾讯云、AWS、电信、联通 ...
分布式文档存储数据库之MongoDB基础入门
Entry level! Teach you how to develop small programs without asking for help (with internet disk link)
新的目标市场在哪里?锚定的产品是什么?| 十问2021中国企业服务
笔试面试题目:求缺失的最小正整数
Windows下快递投递柜、寄存柜的软件初探
On monotonous stack
Ali teaches you how to use the Internet of things platform! (Internet disk link attached)
2018中国云厂商TOP5:阿里云、腾讯云、AWS、电信、联通 ...
C language I blog assignment 03
这次,快手终于比抖音'快'了!
How to solve the difference between NAT IP and port IP
Xamarin deploys IOS from scratch Walterlv.CloudKeyboard application
[Python 1-6] Python tutorial 1 -- number