当前位置:网站首页>Elastic Stack之Beats(Filebeat、Metricbeat)、Kibana、Logstash教程
Elastic Stack之Beats(Filebeat、Metricbeat)、Kibana、Logstash教程
2022-07-02 06:34:00 【niceyz】
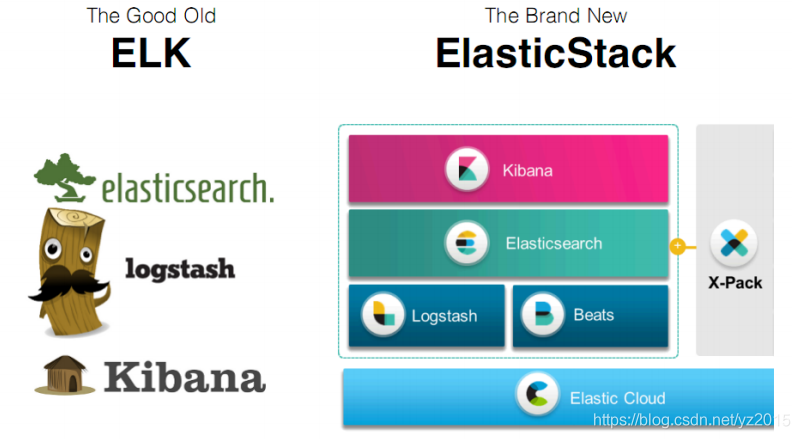
如果你没有听说过Elastic Stack,那你一定听说过ELK,实际上ELK是三款软件的简称,分别是Elasticsearch、Logstash、Kibana组成,在发展的过程中,又有新成员Beats的加入,所以就形成了Elastic Stack。所以说,ELK是旧的称呼,Elastic Stack是新的名字。
全系的Elastic Stack技术栈包括:
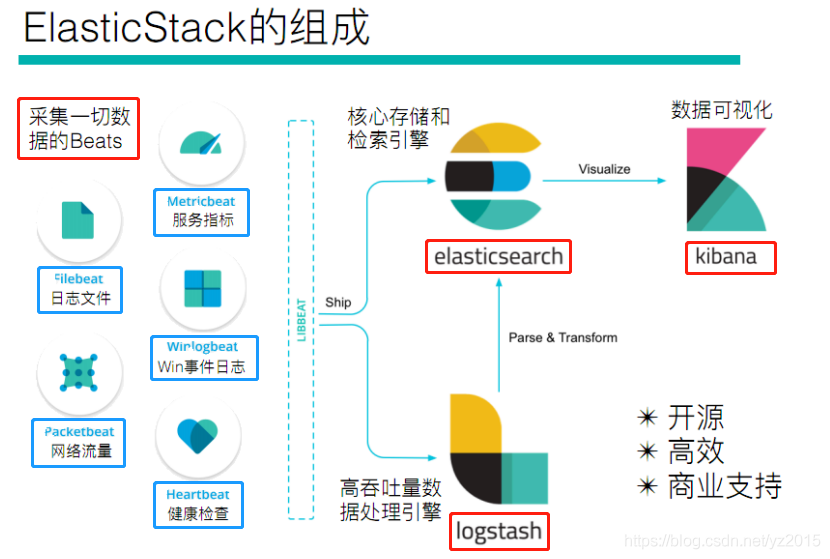
由上图可以看出Beats并不是指单一的某个技术,它是指一系列技术在总称,采集能力更加轻量级更加强大,并且已经逐渐取代Logstash的地位。
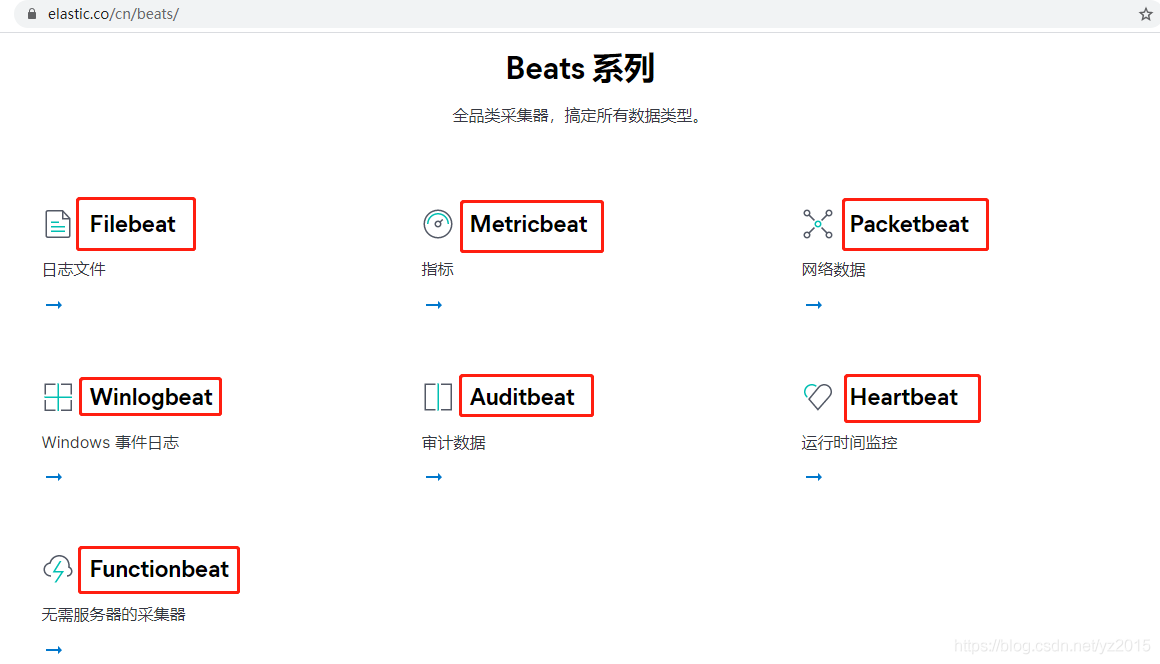
https://www.elastic.co/cn/beats/
1. Beats简介

2. Beats之Filebeat

2.1 架构
用于监控、收集服务器日志文件。Harvester:收割机 Spooler:卷轴,把数据传输到下游

2.2 部署与运行
下载: https://www.elastic.co/downloads/beats 本文下载的是:filebeat-7.10.0-linux-x86_64.tar.gz
解压到指定目录:tar -zxvf filebeat-7.10.0-linux-x86_64.tar.gz -C ../opt/
进入到filebeat目录:cd /opt/filebeat-7.10.0-linux-x86_64/
2.2.1 读取标准输入
#创建如下配置文件 vim yztest.yml 注意有空格
filebeat.inputs:
- type: stdin 标准输入
enabled: true 启用输入
setup.template.settings:
index.number_of_shards: 3 指定ES索引分区数,现在用不到
output.console: 输出到控制台
pretty: true 输出美化
enable: true 输出启用

./filebeat -e -c yztest.yml

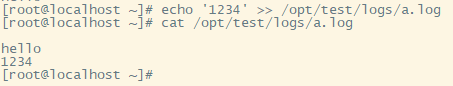
2.3 读取文件
filebeat.inputs:
- type: log 输入类型为日志文件
enabled: true 启用输入
paths:
- /opt/test/logs/*.log 要收集的日志路径
setup.template.settings:
index.number_of_shards: 3 指定ES索引分区数,现在用不到
output.console: 输出到控制台
pretty: true 输出美化
enable: true 输出启用

./filebeat -e -c yztest-log.yml
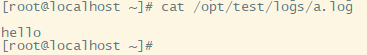

可以看出,已经检测到日志文件有更新,立刻就会读取到更新的内容,并且输出到控制台。
2.4 自定义字段,给要收集的日志定义tab标签用于区分来自哪里
filebeat.inputs:
- type: log
enabled: true
paths:
- /opt/test/logs/*.log
tags: ["fl-carloan-web"] #添加自定义tag,便于后续的处理
fields: #添加自定义字段,说明日志来自哪里
from: fl-carloan-web
fields_under_root: true #true为添加到根节点,false为添加到子节点中
setup.template.settings:
index.number_of_shards: 3
output.console:
pretty: true
enable: true


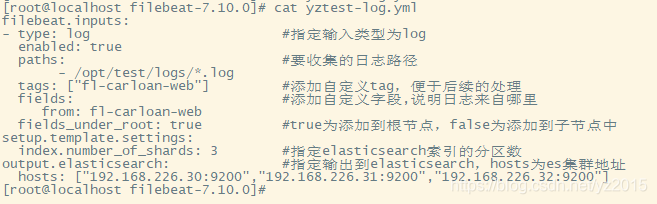
2.5 输出到Elasticsearch vim yztest-log.yml
- type: log #输入类型为log
enabled: true
paths: #要收集的日志路径
- /opt/test/logs/*.log
tags: ["fl-carloan-web"] #添加自定义tag,便于后续的处理
fields: #添加自定义字段,说明日志来自哪里
from: fl-carloan-web
fields_under_root: true #true为添加到根节点,false为添加到子节点中
setup.template.settings:
index.number_of_shards: 3 #指定elasticsearch索引的分区数
setup.template.pattern: "filebeat-*"
hosts: ["192.168.226.30:9200","192.168.226.31:9200","192.168.226.32:9200"]


2.6 FileBeat工作原理
Filebeat由两个主要组件组成:prospector(勘探者) 和 harvester(收割机)。
harvester:
负责读取单个文件的内容。
如果文件在读取时被删除或重命名,Filebeat将继续读取文件。
prospector:
prospector 负责管理harvester并找到所有要读取的文件来源。
如果输入类型为日志,则查找器将查找路径匹配的所有文件,并为每个文件启动一个harvester。
Filebeat目前支持两种prospector类型:log和stdin。
Filebeat如何保持文件的状态(就是Filebeat宕机之后从哪里开始读取):
Filebeat 保存每个文件的状态并经常将状态刷新到磁盘上的注册文件中(文件状态记录在filebeat-7.10.0/data/registry/filebeat/log.json文件中)。
该状态用于记住harvester正在读取的最后偏移量,并确保发送所有日志行。
如果输出(例如Elasticsearch或Logstash)无法访问,Filebeat会跟踪最后发送的行,并在输出再次可用时继续读取文件。
在Filebeat运行时,每个prospector内存中也会保存的文件状态信息,当重新启动Filebeat时,将使用注册文件的数据来重建文件状态,Filebeat将每个harvester在从保存的最后偏移量继续读取。
cat log.json 记录读取日志文件和最后偏移量

启动命令:
2.7 读取Nginx日志文件,filebeat整合nginx做个测试
简要介绍Nginx日志分析系统
1.1、项目需求
Nginx是一款非常优秀的web服务器,往往nginx服务会作为项目的访问入口,那么,nginx的性能保障就变得非常重要了,如果nginx的运行出现了问题就会对项目有较大的影响,所以,我们需要对nginx的运行有监控措施,实时掌握nginx的运行情况,那就需要收集nginx的运行指标和分析nginx的运行日志了。
1.2、业务流程
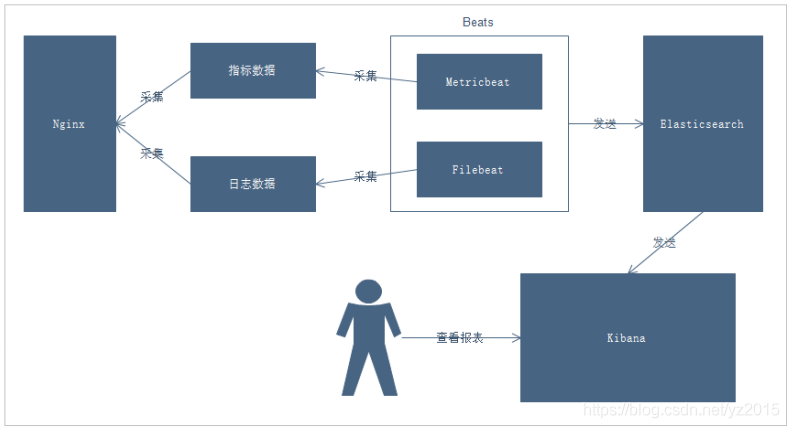
说明:
1. 通过Beats采集Nginx的指标数据和日志数据
2. Beats采集到数据后发送到Elasticsearch中
3. Kibana读取数据进行分析
4. 用户通过Kibana进行查看分析报表


filebeat 读取nginx日志文件
# 编写配置文件 cd /opt/filebeat-7.10.0/ vim yztest-nginx.yml
- type: log
enabled: true
paths:
- /usr/local/nginx/logs/*.log
tags: ["nginx"]
setup.template.settings:
index.number_of_shards: 3 #指定ES索引的分区数
output.elasticsearch: #指定ES的配置
hosts: ["192.168.226.30:9200","192.168.226.31:9200","192.168.226.32:9200"]
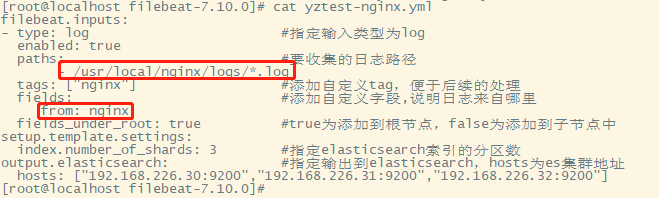

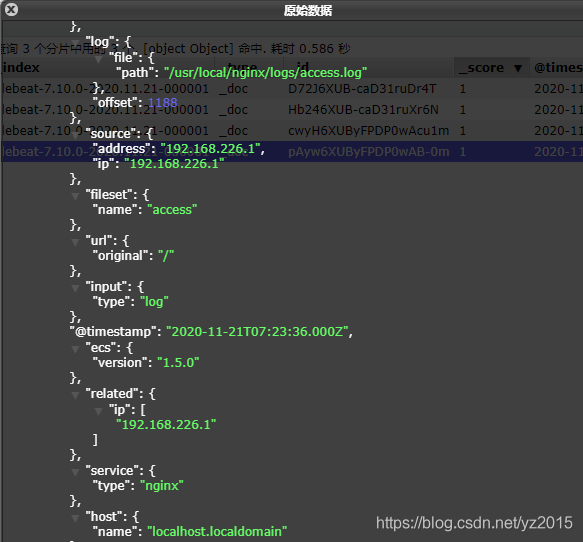
可以看到,在message中已经获取到了nginx的日志,但是,内容并没有经过处理,只是读取到原数据,那么对于我们后期的操作是不利的,可以使用内置的module来处理一下。
2.8 Module
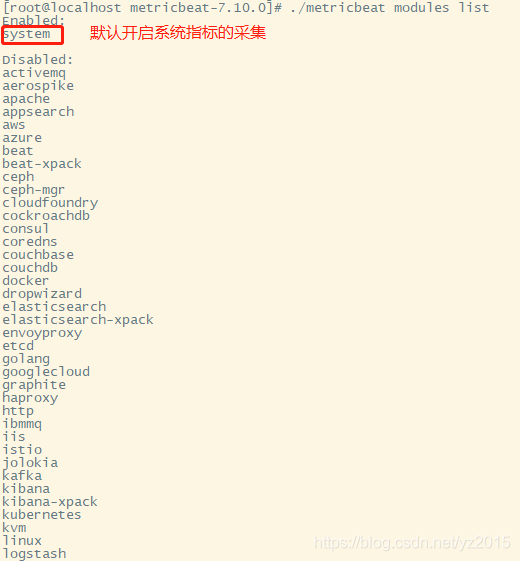
前面要想实现日志数据的读取以及处理都是自己手动配置的,比如手动解析message字符串的内容。其实,在Filebeat中,有大量的Module(使用module解析message字符串,好比工具类),可以简化我们的配置,直接就可以使用,如下: 命令 ./filebeat modules list

./filebeat modules disable nginx #禁用

cd modules.d/ ll查看


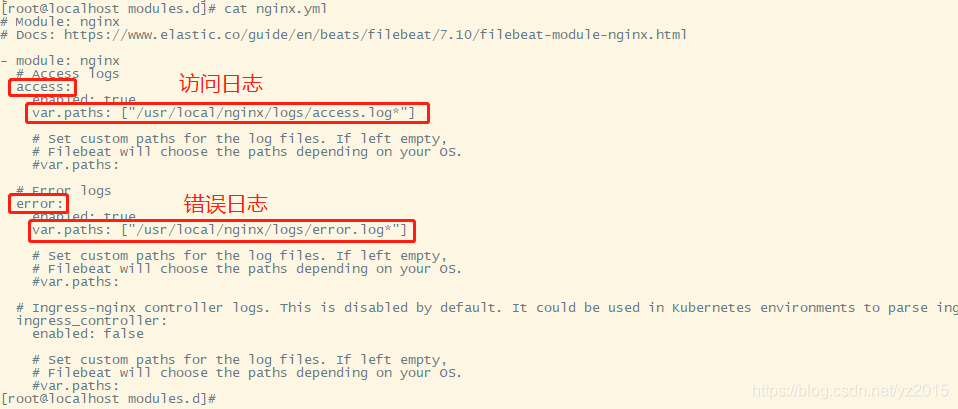
vim nginx.yml
- module: nginx
# Access logs
access:
enabled: true
var.paths: ["/usr/local/nginx/logs/access.log*"] # 日志按天结尾
# Error logs
error:
enabled: true
var.paths: ["/usr/local/nginx/logs/error.log*"] # 日志按天结尾
filebeat.inputs:
tags: ["nginx"] #添加自定义tag,便于后续的处理
fields: #添加自定义字段,说明日志来自哪里
from: nginx
fields_under_root: true #true为添加到根节点,false为添加到子节点中
setup.template.settings:
index.number_of_shards: 3 #指定elasticsearch索引的分区数
output.elasticsearch: #指定输出到elasticsearch,hosts为es集群地址
hosts: ["192.168.226.30:9200","192.168.226.31:9200","192.168.226.32:9200"]
filebeat.config.modules:
path: ${path.config}/modules.d/*.yml
reload.enabled: false
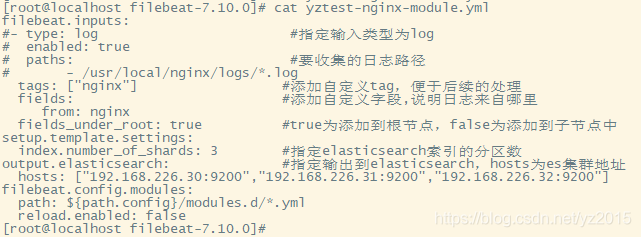
启动 ./filebeat -e -c yztest-nginx-module.yml
如果有报错,按下面的方式解决,这里启动没有报错。
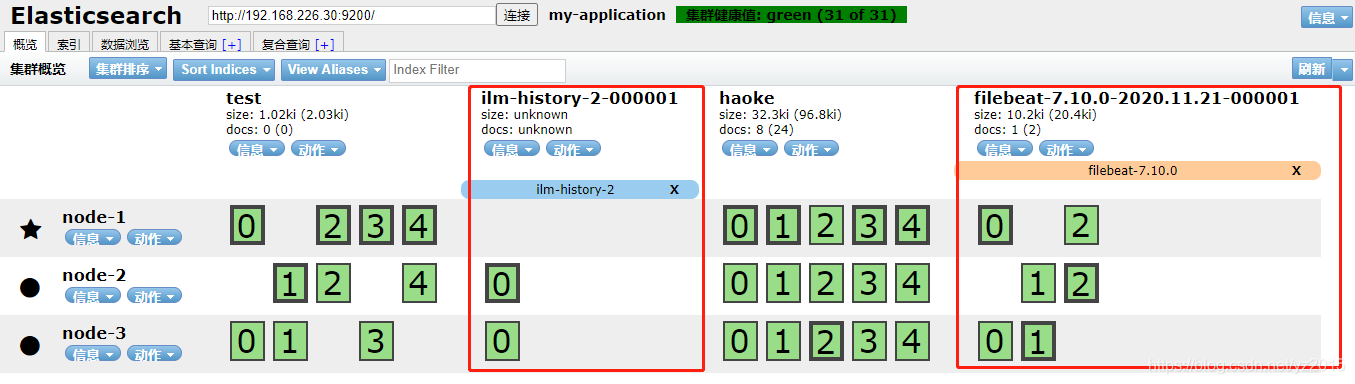
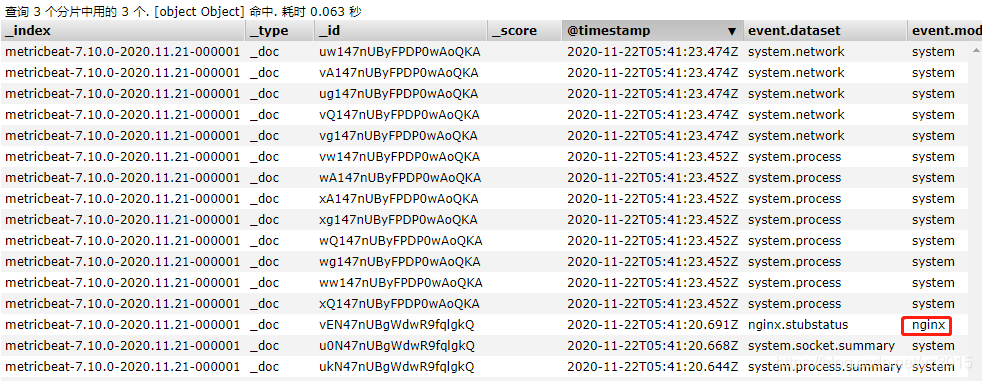
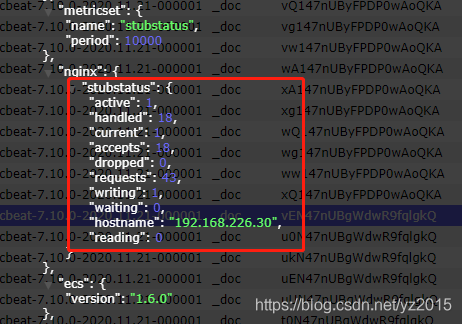
请求几次nginx,让filebeat读取nginx日志文件信息并刷新到elasticsearch中,在elasticsearch可以看到,使用nginx-modul后,返回信息比之前拆的细一点。

主要采集指标的数据
定期收集操作系统或应用服务的指标数据
存储到Elasticsearch中,进行实时分析
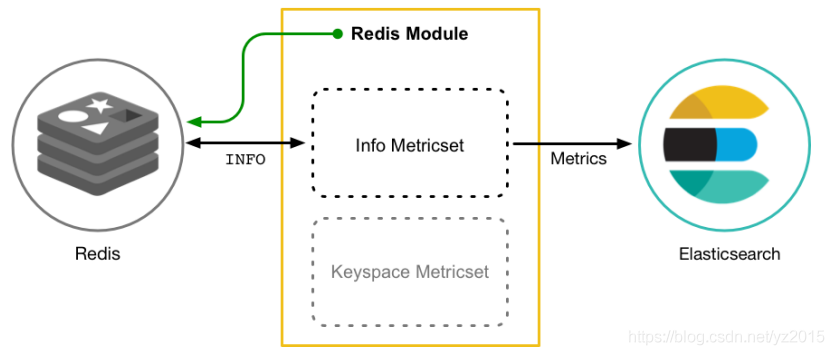
Metricbeat有2部分组成,一部分是Module,另一部分为Metricset。
Module: 收集的对象,如:mysql、redis、nginx、操作系统等;
Metricset:收集指标的集合,如:cpu、memory(内存)、network(网络)等;
1. tar -zxvf metricbeat-7.10.0-linux-x86_64.tar.gz -C /opt/ mv metricbeat-7.10.0-linux-x86_64/ metricbeat-7.10.0
2. cd metricbeat-7.10.0
3. vim metricbeat.yml 只修改elasticsearch输出路径即可,其他地方保持不变,es分片数可改可不改:
hosts: ["192.168.226.30:9200","192.168.226.31:9200","192.168.226.32:9200"]

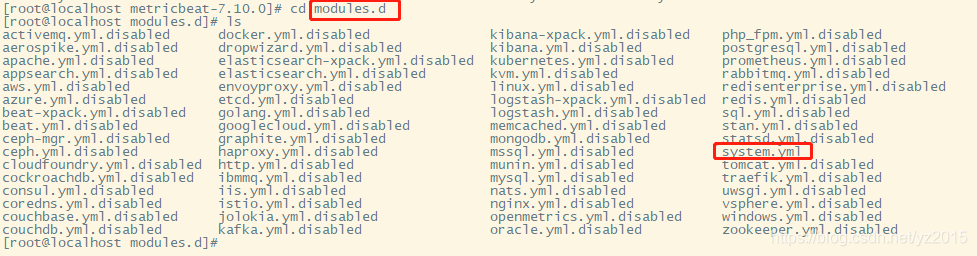
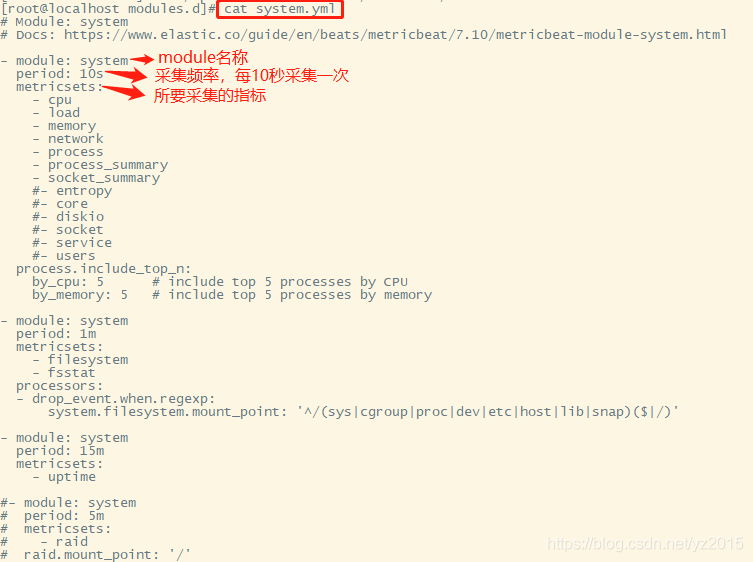
默认系统指标收集开启:

在nginx中,需要开启状态查询,才能查询到指标数据
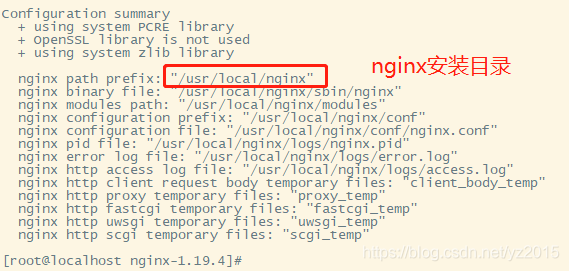
#重新编译nginx
cd /opt/nginx-1.19.4/ 执行: ./configure --prefix=/opt/context/nginx --with-http_ssl_module --with-http_stub_status_module
先执行:make 在执行:make install
cd /usr/local/nginx/sbin 执行: ./nginx -V #查询版本信息 nginx状态模块已安装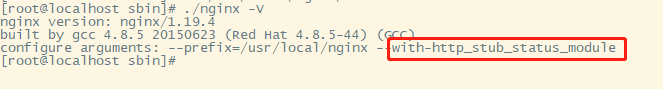
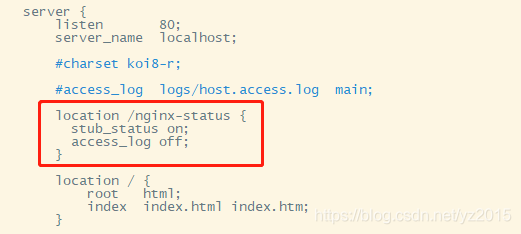
#配置nginx
cd /usr/local/nginx/conf vim nginx.conf 添加:
location /nginx-status {
stub_status on;
access_log off;
}
重启nginx : cd /usr/local/nginx/sbin/ 执行: ./nginx -s reload (命令不好使的话,就先停止nginx: ./nginx -s stop 在启动 ./nginx)
访问刚刚配置的 /nginx-status

结果说明:
Active connections:正在处理的活动连接数
server accepts handled requests
第一个 server 表示Nginx启动到现在共处理了15个连接
第二个 accepts 表示Nginx启动到现在共成功创建 15 次握手
第三个 handled requests 表示总共处理了 23次请求
请求丢失数 = 握手数 - 连接数 ,可以看出目前为止没有丢失请求
Reading: 0 Writing: 1 Waiting: 1
Reading:Nginx 读取到客户端的 Header 信息数
Writing:Nginx 返回给客户端 Header 信息数
Waiting:Nginx 已经处理完正在等候下一次请求指令的驻留链接(开启keep-alive的情况下,这个值等于Active - (Reading+Writing)
- module: nginx
#metricsets:
# - stubstatus
period: 10s
# Nginx hosts
#hosts: ["http://127.0.0.1"]
hosts: ["http://192.168.226.30"]
# Path to server status. Default server-status
#server_status_path: "server-status"
server_status_path: "nginx-status"
#username: "user"
#password: "secret"


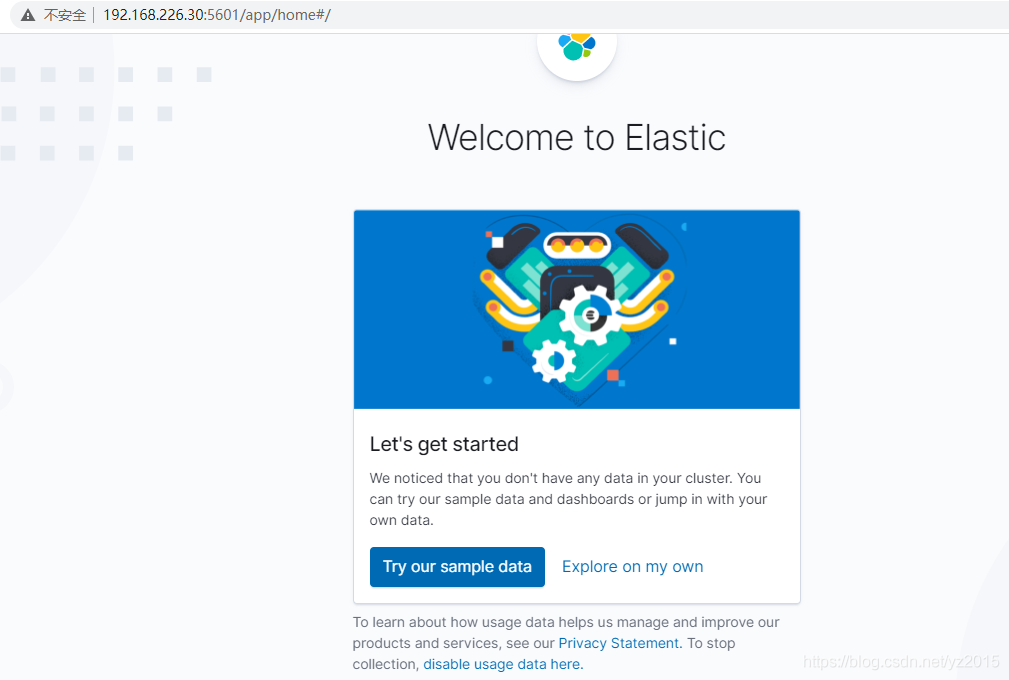
Kibana 是一款开源的数据分析和可视化平台,它是 Elastic Stack 成员之一,设计用于和 Elasticsearch 协作。您可以使用 Kibana 对 Elasticsearch 索引中的数据进行搜索、查看、交互操作。您可以很方便的利用图表、表格及地图对数据进行多元化的分析和呈现。
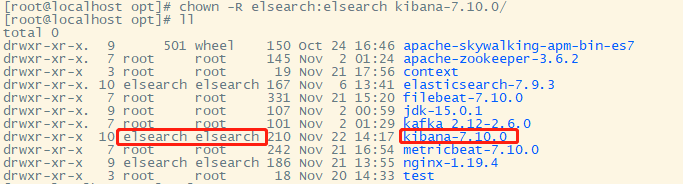
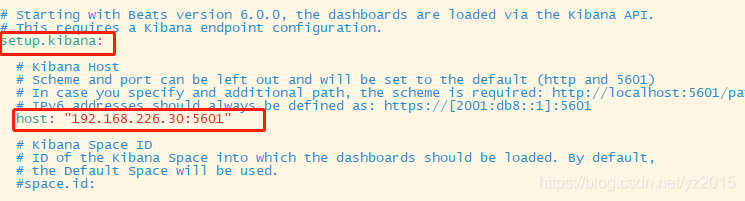
4.1 配置安装

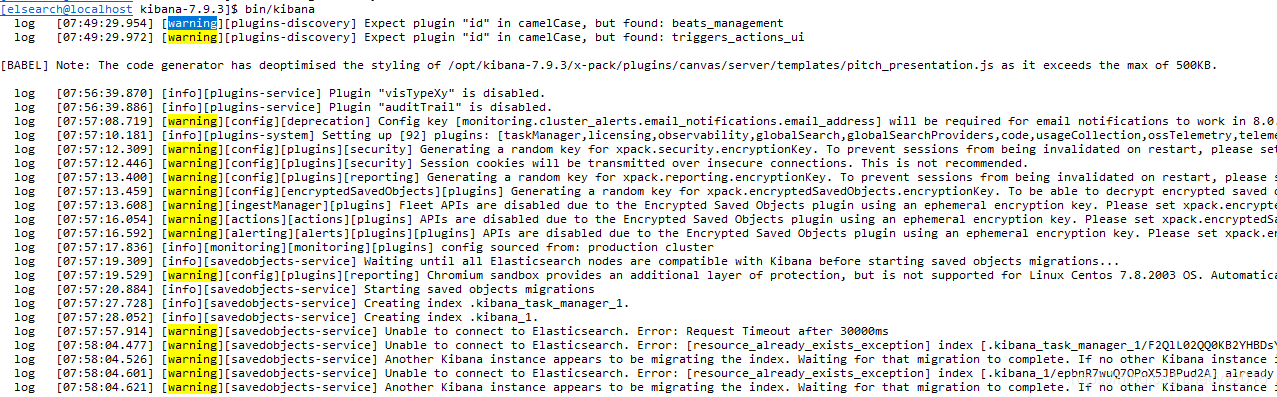
xpack.security.encryptionKey: "something_at_least_32_characters" # 任意32位字符串
xpack.reporting.encryptionKey: "something_at_least_32_characters" # 任意32位字符串
xpack.encryptedSavedObjects.encryptionKey: "something_at_least_32_characters" # 任意32位字符串
xpack.reporting.capture.browser.chromium.disableSandbox: false # 关掉沙箱

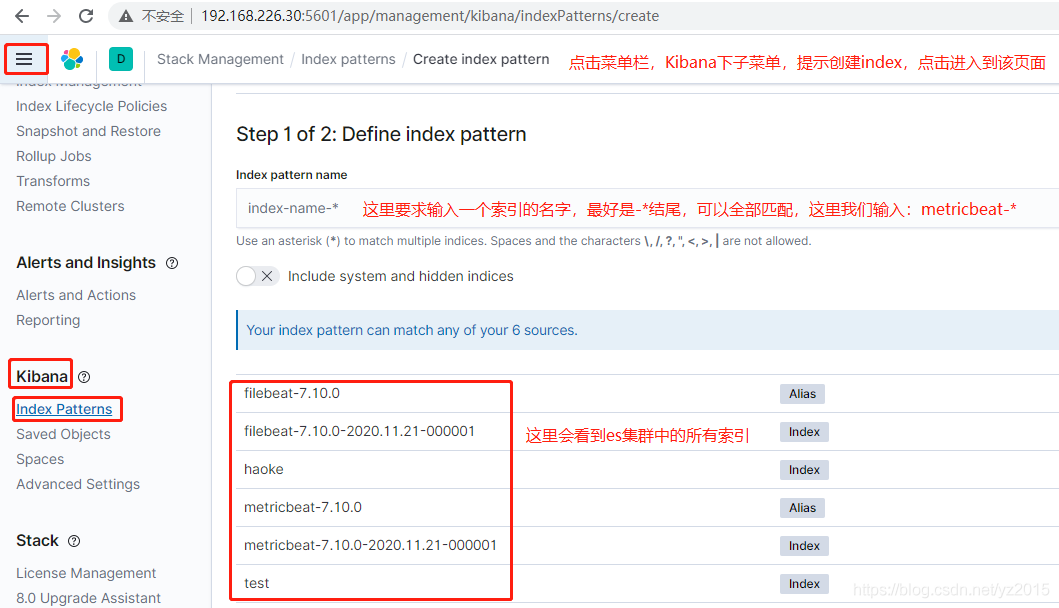

创建索引之后,稍等一会儿就可以在仪表盘看到性能指标的数据:
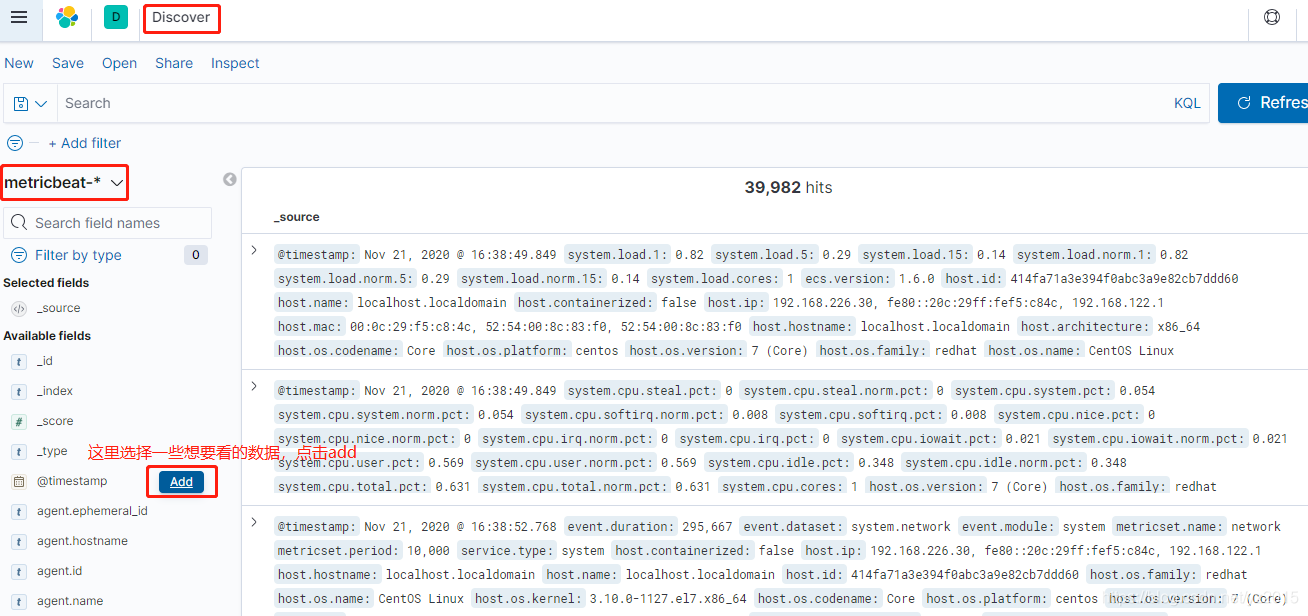
我随便添加了几个,太多了,这里就是将es中的数据可视化的一个操作


重新将metricbeat运行起来: ./metricbeat -e 让它不断地产生数据。
在kibana中点击仪表盘

这些就是刚刚安装好的仪表盘

找到 [Metricbeat System] Host Services Overview ,点进去就可以看到系统的一些数据信息
边栏推荐
- 【Go实战基础】gin 高效神器,如何将参数绑定到结构体
- Cloud computing in my eyes - PAAS (platform as a service)
- Chrome浏览器插件-Fatkun安装和介绍
- Mysql安装时mysqld.exe报`应用程序无法正常启动(0xc000007b)`
- "Redis source code series" learning and thinking about source code reading
- Jd.com interviewer asked: what is the difference between using on or where in the left join association table and conditions
- Gocv split color channel
- Win10 uses docker to pull the redis image and reports an error read only file system: unknown
- 深入剖析JVM是如何执行Hello World的
- 十年开发经验的程序员告诉你,你还缺少哪些核心竞争力?
猜你喜欢

概率还不会的快看过来《统计学习方法》——第四章、朴素贝叶斯法
![[staff] the lines and spaces of the staff (the nth line and the nth space in the staff | the plus N line and the plus N space on the staff | the plus N line and the plus N space below the staff | the](/img/dc/c0ea188ef353ded86759dbe9b29df3.jpg)
[staff] the lines and spaces of the staff (the nth line and the nth space in the staff | the plus N line and the plus N space on the staff | the plus N line and the plus N space below the staff | the

Hengyuan cloud_ Can aiphacode replace programmers?

数构(C语言)——第四章、矩阵的压缩存储(下)

微服务实战|Eureka注册中心及集群搭建
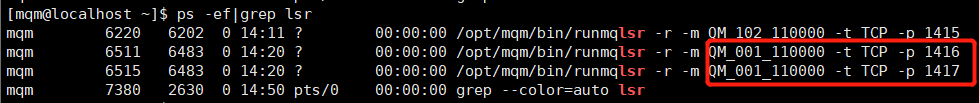
The channel cannot be viewed when the queue manager is running

我服了,MySQL表500W行,居然有人不做分区?
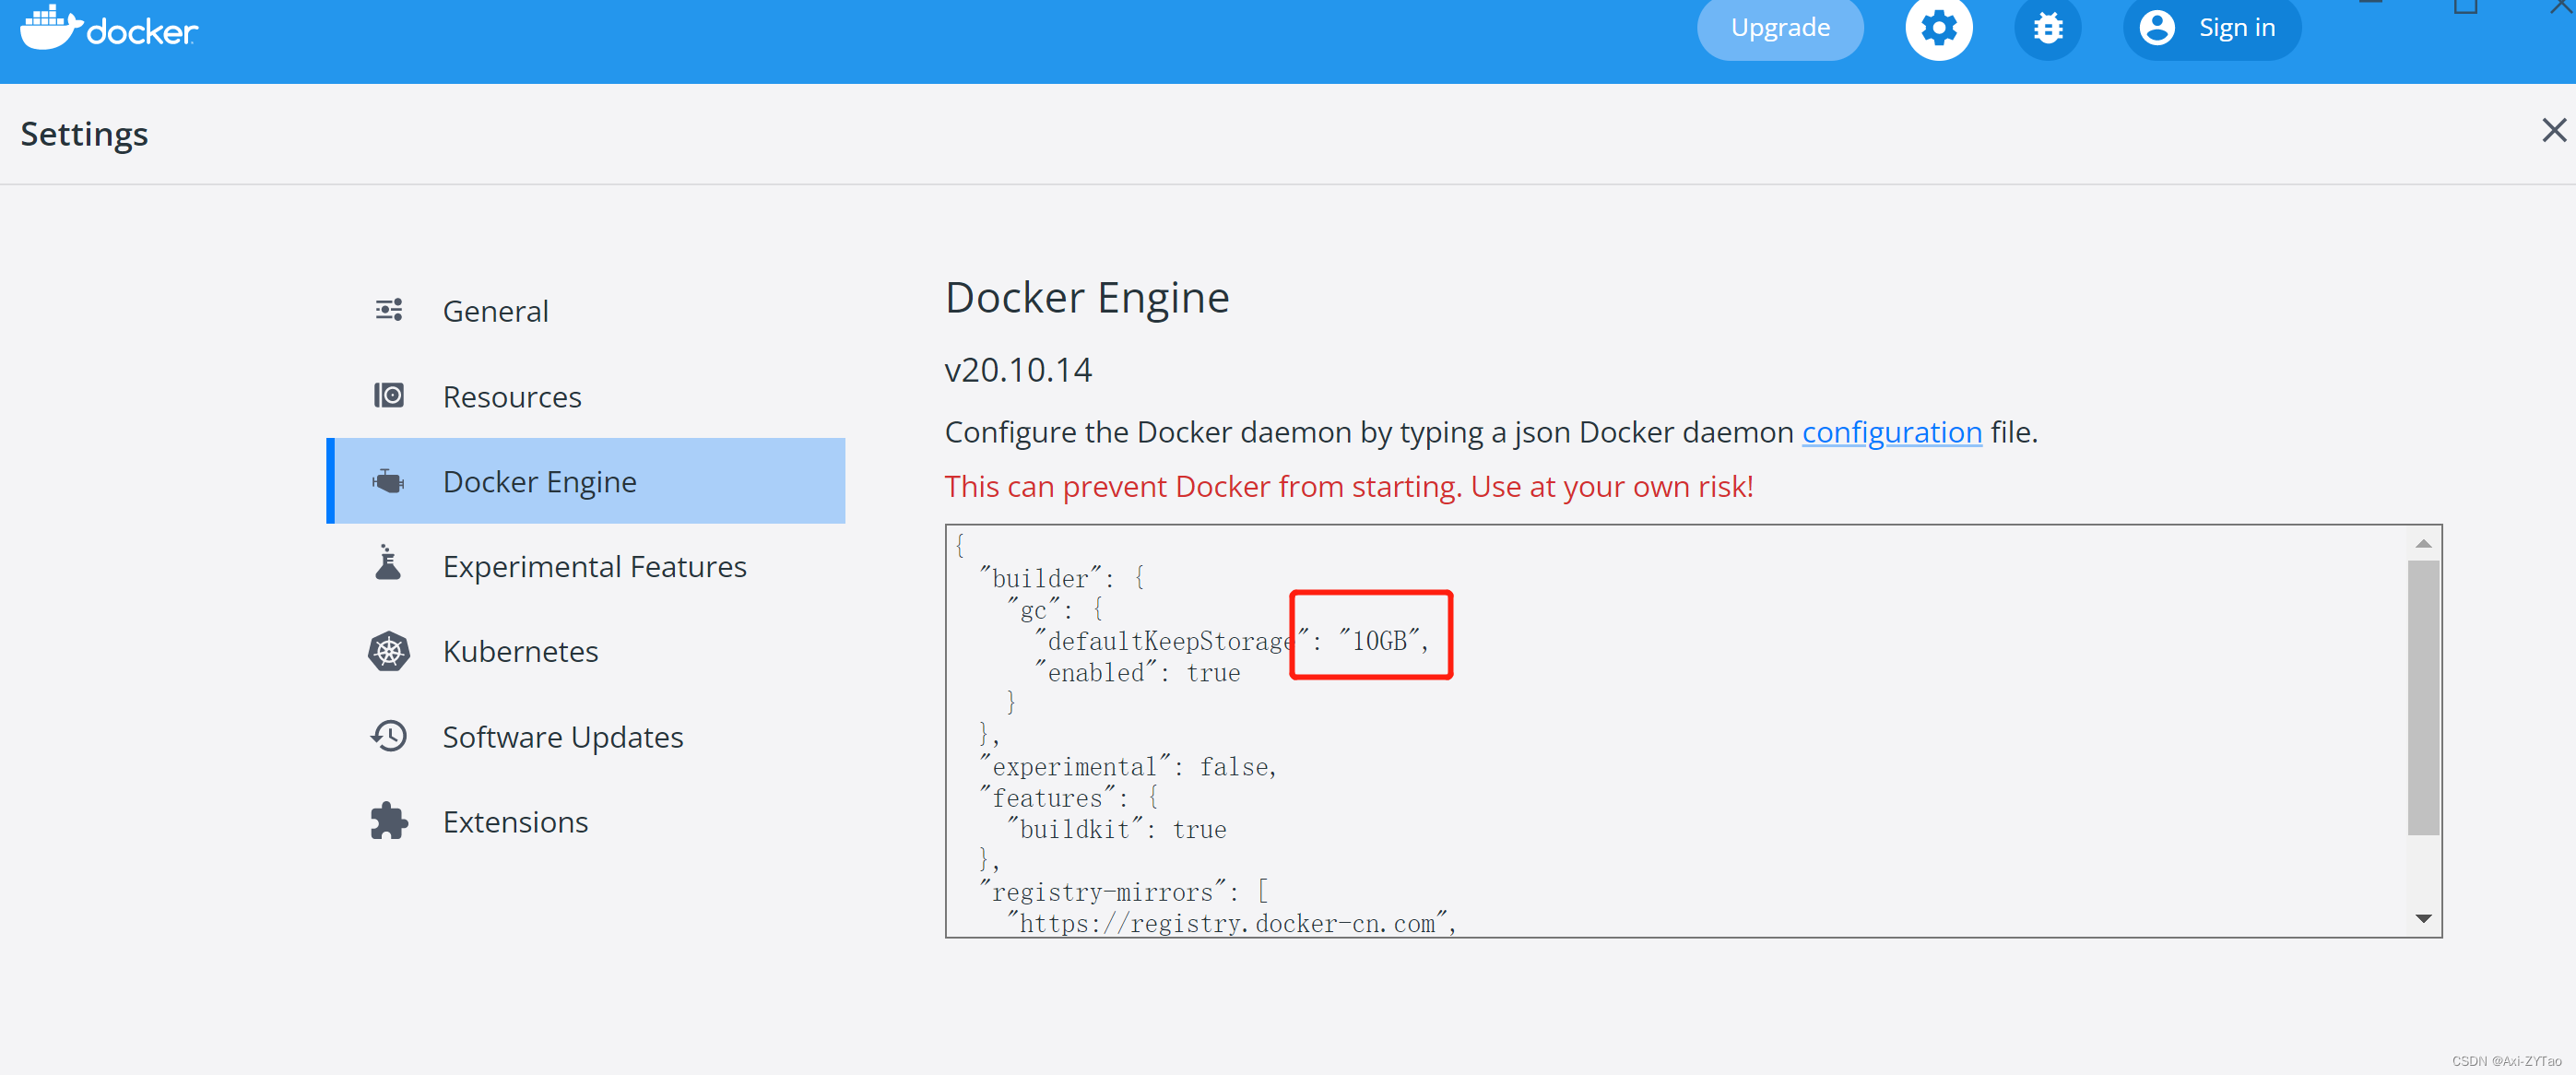
Win10 uses docker to pull the redis image and reports an error read only file system: unknown

2022/2/13 summary

Matplotlib剑客行——布局指南与多图实现(更新)
随机推荐
Use of libusb
Image transformation, transpose
概率还不会的快看过来《统计学习方法》——第四章、朴素贝叶斯法
Webflux responsive programming
DTM distributed transaction manager PHP collaboration client V0.1 beta release!!!
Data type case of machine learning -- using data to distinguish men and women based on Naive Bayesian method
gocv opencv exit status 3221225785
盘点典型错误之TypeError: X() got multiple values for argument ‘Y‘
【Go实战基础】gin 如何获取 GET 和 POST 的请求参数
Cloudreve自建云盘实践,我说了没人能限制得了我的容量和速度
[go practical basis] how can gin get the request parameters of get and post
Redis installation and deployment (windows/linux)
QT -- how to set shadow effect in QWidget
Win10 uses docker to pull the redis image and reports an error read only file system: unknown
ORA-12514问题解决方法
机器学习之数据类型案例——基于朴素贝叶斯法,用数据辩男女
CSDN Q & A_ Evaluation
京东高级工程师开发十年,编写出:“亿级流量网站架构核心技术”
【Go实战基础】gin 如何验证请求参数
2022/2/14 summary