当前位置:网站首页>seaborn笔记:可视化统计关系(散点图、折线图)
seaborn笔记:可视化统计关系(散点图、折线图)
2022-08-01 21:47:00 【UQI-LIUWJ】
0 导入库
import numpy as np
import pandas as pd
import matplotlib.pyplot as plt
import seaborn as sns
sns.set_theme(style="darkgrid")
1 散点图
演示数据集
tips = sns.load_dataset("tips")
#导入一个数据集
1.0 基础用法
以下两种方式几乎是等价的
1.0.1 scatterplot
sns.scatterplot(x='total_bill',y='tip',data=tips)
#绘制散点图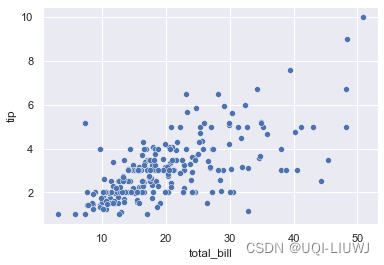
1.0.2 relplot
sns.relplot(x="total_bill", y="tip", data=tips)
1.1 使用另外一列作为label
1.1.1 离散label
sns.scatterplot(x='total_bill',y='tip',data=tips,
                hue='smoker')
1.1.2 连续label
sns.scatterplot(x='total_bill',y='tip',data=tips,
hue='size') 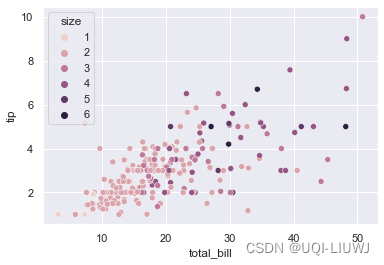
1.2 使用另外一列作为不同标记的指示
sns.scatterplot(x='total_bill',y='tip',data=tips,hue='smoker',
                style='smoker')
1.2.1 hue和style不一定需要同一列
sns.scatterplot(x='total_bill',y='tip',data=tips,hue='smoker',
style='sex') 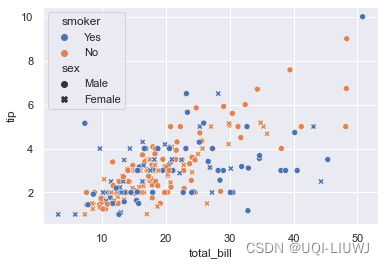
1.3 控制散点的大小
sns.scatterplot(x='total_bill',y='tip',data=tips,
                size='size')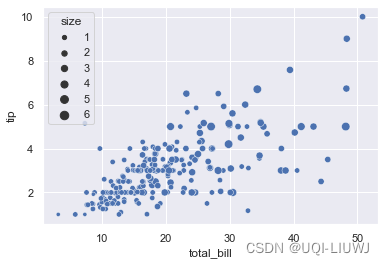
1.3.1 控制散点大小的范围
sns.scatterplot(x='total_bill',y='tip',data=tips,
    size='size',
    sizes=(1,1000))
1.4 根据语义分割子图
sns.relplot(x='total_bill',y='tip',data=tips,hue='smoker',
col='sex') 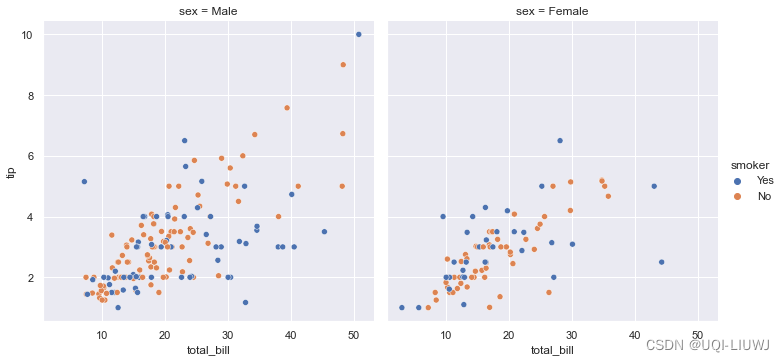
2 折线图
2.0 数据
df = pd.DataFrame(dict(time=np.arange(500),
                       value=np.random.randn(500).cumsum()))
df
2.1 基本使用方法
下面两种方式类似
sns.relplot(x="time", y="value", kind="line", data=df)
sns.lineplot(x="time", y="value", data=df)
2.2 lineplot 事先排序x
因为 lineplot() 假设我们需要做的事情是将 y 绘制为 x 的函数,所以默认行为是在绘图之前按 x 值对数据进行排序。 但是,可以禁用此功能:
df2 = pd.DataFrame(dict(time=np.random.randn(500).cumsum(),
                       value=np.random.randn(500).cumsum()))
df2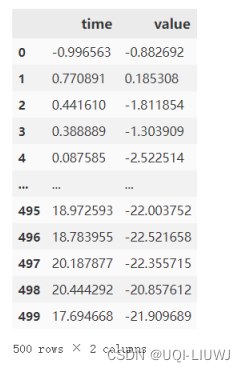
sns.lineplot(x="time", y="value", data=df2)
sns.lineplot(x="time", y="value", data=df2,
            sort=False)
3 聚合和表示不确定性
更复杂的数据集将对 同一个x 变量进行多次测量。 seaborn 的默认行为是通过绘制平均值和平均值周围的 95% 置信区间来聚合每个 x 值的多次测量值:
3.1 数据
fmri = sns.load_dataset("fmri")
fmri
可以看到一个timepoine会有多个signal的值。
3.1.1 绘制置信区间(默认)
sns.lineplot(x="timepoint", y="signal", data=fmri)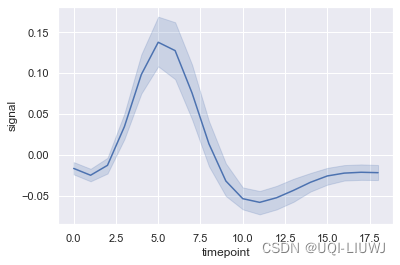
3.1.2 不绘制置信区间
sns.lineplot(x="timepoint", y="signal", data=fmri,
            ci=None)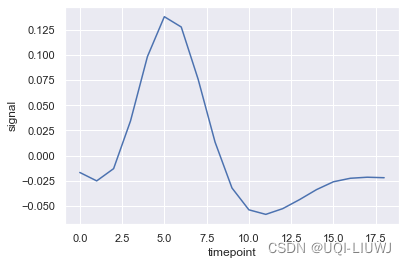
3.1.3 绘制标准差区间
sns.lineplot(x="timepoint", y="signal", data=fmri,
                                        ci='sd')
3.2 带有不同语义的plot
sns.lineplot(x="timepoint", y="signal", data=fmri,
             hue='event')
3.3 带有不同线条形状
sns.lineplot(x="timepoint", y="signal", data=fmri,
             hue='event',style='region')
3.3.1 标记各个点
sns.lineplot(x="timepoint", y="signal", data=fmri,hue='event',style='region',
markers=True) 
3.4 根据语义分割子图
sns.relplot(x="timepoint", y="signal", hue="subject",kind="line", data=fmri,
            col="region", row="event");
边栏推荐
- 基于php在线音乐网站管理系统获取(php毕业设计)
- kubernetes CoreDNS全解析
- 作业8.1 孤儿进程与僵尸进程
- C expert programming
- Mini Program--Independent Subcontracting & Subcontracting Pre-download
- Raspberry Pi information display small screen, display time, IP address, CPU information, memory information (C language), four-wire i2c communication, 0.96-inch oled screen
- Delicious this year
- Getting Started Database Days4
- 19 Lectures on Disassembly of Multi-merchant Mall System Functions - Invoice Management on the Platform
- HCIP---企业网的架构
猜你喜欢

365天挑战LeetCode1000题——Day 046 生成每种字符都是奇数个的字符串 + 两数相加 + 有效的括号

【C语言实现】最大公约数的3种求法

HCIP---Multiple Spanning Tree Protocol related knowledge points
Kubernetes第零篇:认识kubernetes

scikit-learn no moudule named six

SOM网络1:原理讲解
可视化——Superset使用
Upload markdown documents to blog garden
render-props and higher order components
作业8.1 孤儿进程与僵尸进程
随机推荐
render-props and higher order components
Spark practice questions + answers
程序员必备的 “ 摸鱼神器 ” 来了 !
SOM Network 2: Implementation of the Code
小程序--独立分包&分包预下载
还在纠结报表工具的选型么?来看看这个
MySQL related knowledge
作业8.1 孤儿进程与僵尸进程
Lecture 3: Several common table field data types in MySQL database
Raspberry Pi information display small screen, display time, IP address, CPU information, memory information (C language), four-wire i2c communication, 0.96-inch oled screen
今日睡眠质量记录74分
Scala practice questions + answers
WEB 渗透之文件类操作
365 days challenge LeetCode1000 questions - Day 046 Generate a string with odd number of each character + add two numbers + valid parentheses
Shell编程之条件语句
【建议收藏】ヾ(^▽^*)))全网最全输入输出格式符整理
高等代数_证明_矩阵的行列式为特征值之积, 矩阵的迹为特征值之和
HCIP---多生成树协议相关知识点
Appendix A printf, varargs and stdarg a. 2 use varargs. H to realize the variable argument list
shell programming conventions and variables