当前位置:网站首页>Unity performance optimization reading notes - explore performance issues -profiler (2.1)
Unity performance optimization reading notes - explore performance issues -profiler (2.1)
2022-07-04 12:20:00 【Five kernel sesame cake】
The author talked a lot .. About the importance of finding problems and locating root causes . I'll skip it here
The main contents of this chapter are as follows :
1 How to use profiler Get running data
2 How to analyze profiler Analyze the performance bottleneck of data
3 How to analyze performance problems and locate root causes
Then I introduced profiler The function of ,profiler The functions of each subsystem of are as follows :
1 see cpu Consume
2 About rendering and gpu Basis and details of
3 Memory application and overall consumption
4 Sound resource / Data usage
5 Network messaging and operational utilization
6 Video playback utilization
7 About ui Fundamentals and details of performance
8 Global illumination data
Then the author introduces two ways of observing performance , One is to use monitoring tools , One is to benchmark .
The detection tool can well observe the internal implementation of the program , Function calling behavior , And how the memory is applied for and other running data . But when you start looking for performance problems, you use detection tools , It's not a good way , Because the detection tool itself will have some performance consumption . When compiling games in development mode , Additional compilation options will be enabled , Cause the system to call some special events . These events will be profiler Record and save . This will result in additional cpu And memory consumption . If it's in editor Perform performance test on , Things will get worse . because editor You also need to render some additional windows and handle background tasks . Especially in large projects , Use profiler It may lead to different performance of the application . The timing of event generation and the change of asynchronous invocation will lead to some exceptions . This is in use profiler Some costs that must be paid when performing performance troubleshooting , So it's using profiler Pay special attention to this point when .
Before starting to analyze each line of code , It is best to run on the test equipment first , Under specific test samples , Get some preliminary operation data . The test sample can be playing a game for a few seconds , Play of transition animation , Or play games in some levels . Objective To get a general user experience , And carefully observe when the performance gets worse , These problems sometimes need further analysis .
This process is often called benchmarking . The indicators we need to pay attention to are FPS,CPU Operating condition ,CPU and GPU And so on . These are better performance indicators .
After benchmarking , And when in-depth analysis is needed , It can be used profiler Performance testing . And try to test as many models as possible to obtain operation data . And don't use editor To test , Because there will be additional performance consumption .
Here's a hint , Sometimes I find editor On the contrary, the running index of the real machine is better . as a result of editor Will cache some sound effects ,prefab Data like this , It will run faster .
In conclusion, it is , First run it on the real machine to see if there is a performance bottleneck , And then in Profiler Find and locate the problem on .Development Build There will be additional performance consumption , use Profiler There will be some differences between the viewed data and the actual data . And try not to Ediotr Perform performance test on , because Editor It also has performance consumption .
边栏推荐
- Lvs+kept highly available cluster
- OSI model notes
- [Yunju entrepreneurial foundation notes] Chapter II entrepreneur test 10
- Reptile learning winter vacation series (2)
- Customized version of cacti host template
- Tableau makes data summary after linking the database, and summary exceptions occasionally occur.
- C language compilation process
- QQ group collection
- [Yunju entrepreneurial foundation notes] Chapter II entrepreneur test 17
- [solve the error of this pointing in the applet] SetData of undefined
猜你喜欢

Process communication and thread explanation
Foreach (system.out:: println) usage
Single spa, Qiankun, Friday access practice
Experiment 7. IPv6

Star leap plan | new projects are continuously being recruited! MSR Asia MSR Redmond joint research program invites you to apply!
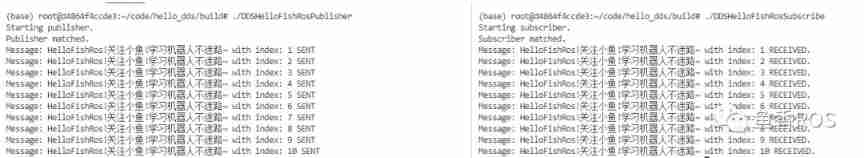
Here, the DDS tutorial you want | first experience of fastdds - source code compilation & Installation & Testing
Day01 preliminary packet capture
(2021-08-20) web crawler learning 2
OSI seven layer reference model
(August 9, 2021) example exercise of air quality index calculation (I)
随机推荐
Alibaba cloud server connection intranet operation
Anti clockwise rotation method of event arrangement -- PHP implementation
2021 annual summary - it seems that I have done everything except studying hard
Detailed explanation of classic process synchronization problems
Experiment 7. IPv6
How to create a new virtual machine
Xiaobing · beauty appraisal
Iframe to only show a certain part of the page
Openssl3.0 learning 20 provider KDF
Leetcode: 408 sliding window median
CSDN documentation specification
[Yunju entrepreneurial foundation notes] Chapter II entrepreneur test 8
IO stream ----- open
LxC shared directory addition and deletion
SSH principle and public key authentication
How to judge the advantages and disadvantages of low code products in the market?
About the use of URL, href, SRC attributes
Guava ImmutableSet. Builder source code analysis, shift original code, complement code, reverse code review
2021-08-09
[Yunju entrepreneurial foundation notes] Chapter II entrepreneur test 14