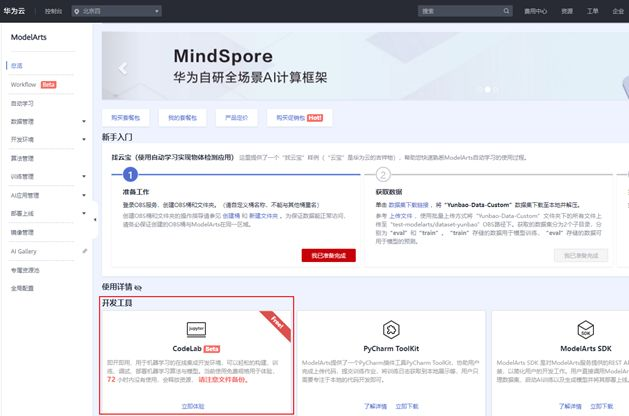
当前位置:网站首页>Example explanation: move graph explorer to jupyterlab
Example explanation: move graph explorer to jupyterlab
2022-07-01 18:53:00 【InfoQ】

One 、 Prepare before use
1. Huawei cloud account
2. OBS Object storage service
3. GES Figure Engine Services
4. Get call GES Business API Required parameters
Two 、 Use GES4Jupyter Connect GES service
import moxing as mox
mox.file.copy('obs://obs-aigallery-zc/GES/ges4jupyter/beta/ges4jupyter.py', 'ges4jupyter.py')
mox.file.copy('obs://obs-aigallery-zc/GES/ges4jupyter/beta/ges4jupyter.html', 'ges4jupyter.html')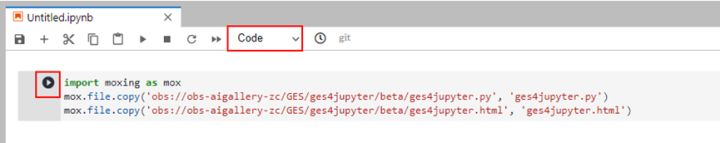
from ges4jupyter import GESConfig, GES4Jupyter, read_csv_config
eip = ''
project_id = ''
graph_name = ''
iam_url = ''
user_name = ''
password = ''
domain_name = ''
project_name = ''
port = 80
eip, project_id, graph_name, iam_url, user_name, password, domain_name, project_name, port = read_csv_config('cn_north_4_graph.csv')
config = GESConfig(eip, project_id, graph_name,
 iam_url = iam_url,
 user_name = user_name,
 password = password,
 domain_name = domain_name,
 project_name = project_name,
 port = port)
ges_util = GES4Jupyter(config, True);- Is used to construct API Parameters of :eip,projectId,graph_name, port These four parameters are involved in the construction of the business face request url.eip And graph_name The two parameters are easy to obtain in drawing creation ,port The parameter defaults to 80, When safe mode is turned on, it is 443, About projectId, Refer to the official website of the graph engine - Get the project id, Get items from the graph console according to the region to which the graph belongs id.
- Used when requesting API Pre acquisition token Parameters of :iam_url, user_name, password, domain_name,project_name,GES4Jupyter These four parameters will be used to get token, And then in use api To authenticate , For relevant parameters, please refer to : Huawei graphics engine documentation - Business API Authentication and call GES Service business API Acquisition of relevant parameters

print(' Start creating point index :')
job_id = ges_util.build_vertex_index()
job_result = ges_util.get_job(job_id)
if 'errorCode' not in job_result:
 for i in range(100):
 if job_result['status'] == 'success':
 break
 else:
 time.sleep(1)
 job_result = ges_util.get_job(job_id)
print(' Point index creation completed ')
print(' Start creating edge index :')
job_id = ges_util.build_edge_index()
job_result = ges_util.get_job(job_id)
if 'errorCode' not in job_result:
 for i in range(100):
 if job_result['status'] == 'success':
 break
 else:
 time.sleep(1)
 job_result = ges_util.get_job(job_id)
print(' Edge index creation completed ')ges_util.cypher_query("call dbms.parameter('needNodeIndex', false)");
ges_util.cypher_query("call dbms.parameter('needEdgeIndex', false)");
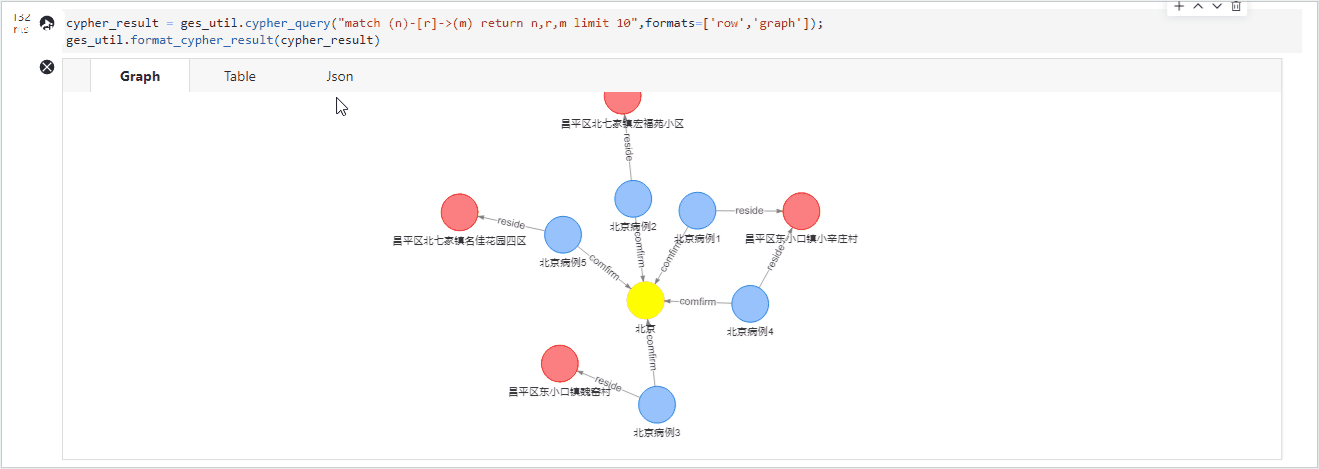
3、 ... and 、 Use GES4Jupyter Call the business interface and visualize it
cypher_result = ges_util.cypher_query("match (n)-[r]->(m) return n,r,m limit 10",formats=['row','graph']);
ges_util.format_cypher_result(cypher_result)
gremlin_result = ges_util.gremlin_query("g.V().outE().bothV().path().limit(2)");
ges_util.format_gremlin_result(gremlin_result)
result = ges_util.path_query({
 "repeat": [
 {
 "operator": "bothV",
 "vertex_filter": {
 "property_filter": {
 "leftvalue": {
 "id": ""
 },
 "predicate": "NOTIN",
 "rightvalue": {
 "value": [" Beijing "]
 }
 }
 }
 }
 ],
 "until": [
 {
 "vertex_filter": {
 "property_filter": {
 "leftvalue": {
 "id": ""
 },
 "predicate": "=",
 "rightvalue": {
 "value": [" mesozoic-cenozoic "]
 }
 }
 }
 }
 ],
 "times": 5,
 "queryType": "Tree",
 "vertices": [" Beijing case 2"]
 })
ges_util.format_path_query(result)
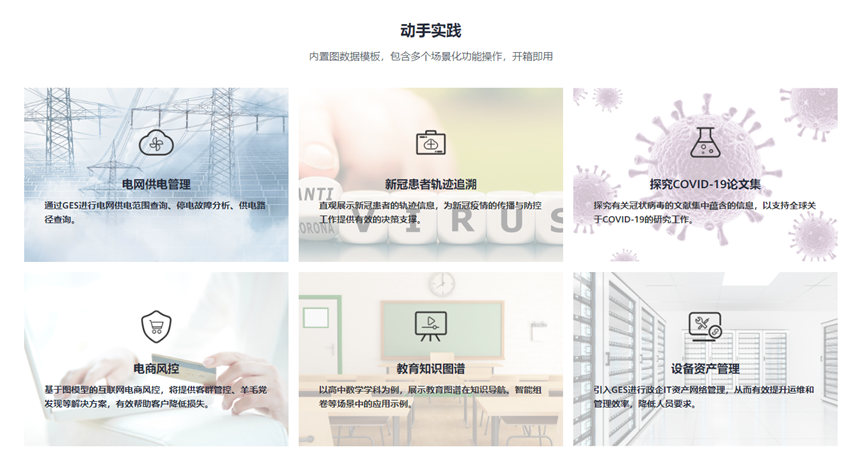
Four 、 There are more cases available on the official website of the graph engine GES4Jupyter Hands on experience
边栏推荐
- Vidéos courtes recommandées chaque semaine: méfiez - vous de la confusion entre « phénomène » et « problème »
- Memo - about C # generating barcode
- Lumiprobe 双功能交联剂丨Sulfo-Cyanine5 双-NHS 酯
- Introduction to easyclick database
- Usage and underlying implementation principle of PriorityQueue
- Write it down once Net travel management background CPU Explosion Analysis
- Solution: you can ping others, but others can't ping me
- Using OpenSSL encryption to rebound shell traffic
- Write an open source, convenient and fast database document query and generation tool with WPF
- 摄像头的MIPI接口、DVP接口和CSI接口[通俗易懂]
猜你喜欢

研究了11种实时聊天软件,我发现都具备这些功能…

斯坦福、Salesforce|MaskViT:蒙面视觉预训练用于视频预测

LeetCode-21合并两个有序链表

1. "Create your own NFT collections and publish a Web3 application to show them." what is NFT

How does factor analysis calculate weights?

Write an open source, convenient and fast database document query and generation tool with WPF

Lumiprobe bifunctional crosslinker sulfo cyanine 5 bis NHS ester

Search 2D matrix 2
![[source code analysis] model parallel distributed training Megatron (5) -- pipestream flush](/img/c0/25c1b96cc56fbd0231d32214d66718.jpg)
[source code analysis] model parallel distributed training Megatron (5) -- pipestream flush

实现一个Prometheus exporter
随机推荐
Find all missing numbers in the array
1380. Lucky number in matrix / 1672 Total assets of the richest customers
搭建一个通用监控告警平台,架构上需要有哪些设计
Principal component calculation weight
3、《创建您自己的NFT集合并发布一个Web3应用程序来展示它们》在本地铸造 NFT
540. Single element in ordered array / 1684 Count the number of consistent strings
Solution: you can ping others, but others can't ping me
6款红黄黑榜摄像头评测:谁最安全?谁画质好?从此让你不再踩雷
解决方案:可以ping别人,但是别人不能ping我
[source code analysis] NVIDIA hugectr, GPU version parameter server - (1)
app发版后的缓存问题
Vidéos courtes recommandées chaque semaine: méfiez - vous de la confusion entre « phénomène » et « problème »
每周推薦短視頻:警惕“現象”與“問題”相互混淆
About enterprise middle office planning and it architecture microservice transformation
2、《创建您自己的NFT集合并发布一个Web3应用程序来展示它们》启动并运行您的本地环境
摄像头的MIPI接口、DVP接口和CSI接口[通俗易懂]
磁盘的基本知识和基本命令
Leetcode-128 最长连续序列
AI training speed breaks Moore's law; Song shuran's team won the RSS 2022 Best Paper Award
R语言使用epiDisplay包的aggregate函数将数值变量基于因子变量拆分为不同的子集,计算每个子集的汇总统计信息