当前位置:网站首页>利用plot_surface命令绘制复杂曲面入门详解
利用plot_surface命令绘制复杂曲面入门详解
2022-08-02 14:10:00 【杨老头软工】
一、引言
在三维几何图形中,经常需要绘制复杂的曲面,例如封闭的空间曲面。本文以绘制由平面z=1,旋转抛物面z=x^2 + y^2和抛物柱面y=2x围成的封闭曲面为例,详细讲解利用Python命令plot_surface绘制复杂曲面的过程。
二、绘制封闭的曲面
1、首先绘制旋转抛物面z=x^2 + y^2
考虑旋转抛物面函数的定义域是圆域,因此使用极坐标来表示该图形的横坐标和纵坐标,让得到的图形在视觉上更好看一些。
具体的步骤为:
1)首先建立图形窗口,并规定使用三维坐标系
2)确定极径和极角的网格坐标
3)根据直角坐标和极坐标的关系得到旋转抛物面上的横坐标、坐标轴和竖坐标
4)利用plot_surface函数绘制旋转抛物面
5)增加每个坐标轴的标签,确定三维图形的视角
参考代码如下:
import matplotlib.pyplot as plt
import numpy as np
import math

fig = plt.figure()             #建立图形窗口
ax = fig.gca( projection = '3d' )  #使用三维坐标
theta = np.arange( 0, 2 * math.pi, 0.05 )
rou  = np.arange( 0, 1, 0.005 )
T, R = np.meshgrid( theta, rou ) #生成极角和极径的网格坐标
Xp = R * np.cos(T)   #根据极坐标计算横坐标
Yp = R * np.sin(T)    #根据极坐标计算纵坐标
Zp = Xp**2 + Yp**2  #把横坐标和纵坐标代入旋转抛物面函数得到竖坐标
ax.plot_surface( Xp, Yp, Zp, cstride = 1, rstride = 2, edgecolor = 'b' )  #绘制旋转抛物面
ax.set_xlabel( 'x' )
ax.set_ylabel( 'y' )
ax.set_zlabel( 'z' )
ax.view_init( 20, 45 )
上述代码运行结果为: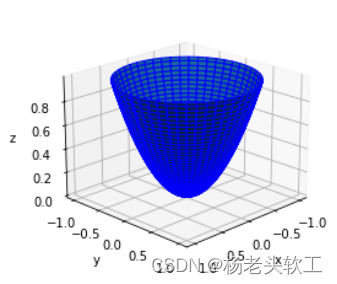
2、绘制抛物柱面y=x^2
有了上面绘制旋转抛物面的经验,此处直接上代码。
fig = plt.figure()   #建立图形窗口
ax = fig.gca( projection = '3d' )  #三维坐标系
Xc, Zc = np.meshgrid( np.arange(-1, 1, 0.005), np.arange(0, 1, 0.005 ) )#自变量网格坐标
Yc = Xc**2
ax.plot_surface( Xc, Yc, Zc, cstride = 1, rstride = 2, edgecolor = 'y' )#绘图
ax.set_xlabel( 'x' )
ax.set_ylabel( 'y' )
ax.set_zlabel( 'z' )
ax.view_init( 20, 45 )
上述代码运行结果为: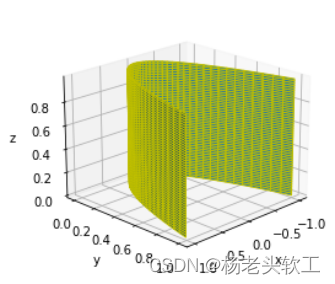
3、绘制与旋转抛物面具有相同定义域的平面z=1
有了上面绘制旋转抛物面的经验,此处直接上代码。
fig = plt.figure()              #建立图形窗口
ax = fig.gca( projection = '3d' )  #三维坐标系
[ m, n ] = np.shape( Xp )
Zf = np.ones( Xp.shape )
ax.plot_surface( Xp, Yp, Zf, cstride = 1, rstride = 2, edgecolor = 'r' )
ax.set_xlabel( 'x' )
ax.set_ylabel( 'y' )
ax.set_zlabel( 'z' )
ax.view_init( 20, 45 )
上述代码运行结果为: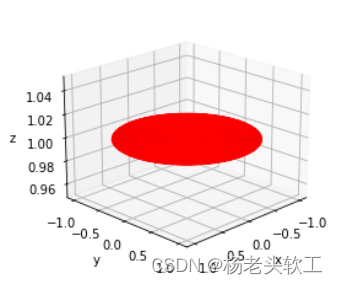
4、把上述代码融合到一块运行就可以得到下面的图形: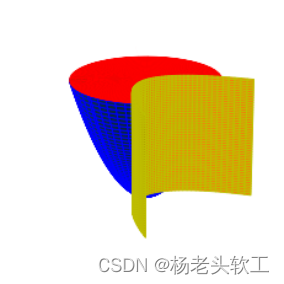
注意:需要把绘制抛物柱面和平面代码中如下两条语句删除
fig = plt.figure()              #建立图形窗口
ax = fig.gca( projection = '3d' )  #三维坐标系
5、删除每个图形上多余的图元
从上图可以看出,结果不尽人意,如果能够去掉各曲面多余的部分,则可以得到比较好看的封闭曲面。因此讲采用下面的代码来分别删除选择抛物面、抛物柱面和平面的多余数据,只需要令多余图元对应的竖坐标分量值为None即可。
1)删除抛物柱面多余的数据(本方法效率比较低)
[ mc, nc ] = np.shape( Xc )
for i in range( mc ):
    for j in range( nc ):
        if Zc[ i, j ] < Xc[ i, j ] * Xc[ i, j ] + Yc[ i, j ] * Yc[ i, j ]:
            Zc[ i, j ] = None
      ```
2)删除选择抛物面和平面多余的数据(本方法效率比较低)
```python
[ m, n ] = np.shape( Xp )
Zf = np.ones( Xp.shape )
for i in range( m ):
    for j in range( n ):
        if Yp[ i, j ] < Xp[ i, j ] * Xp[ i, j ]:
            Zf[ i, j ] = None
            Zp[ i, j ] = None
这样就可以得到如下视觉效果较好的图形: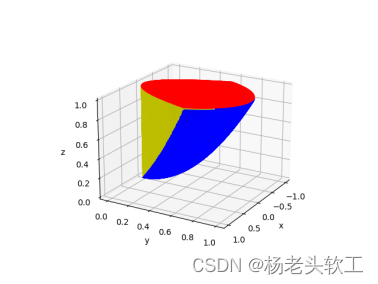
6、完整的绘制封闭曲面的代码
import matplotlib.pyplot as plt
import numpy as np
import math
#建立图形窗口
fig = plt.figure()
ax = fig.gca( projection = '3d' )#Axes3D( fig )

#旋转抛物面 Paraboloid 的图形数据
theta = np.arange( 0, math.pi, 0.01 )
rou   = np.arange( 0, 1, 0.01 )
T, R = np.meshgrid( theta, rou )
Xp = R * np.cos(T)
Yp = R * np.sin(T)
Zp = Xp**2 + Yp**2

#抛物柱面 Parabolic Cylinder 的图形数据
Xc, Zc = np.meshgrid( np.arange(-1, 1, 0.01), np.arange(0, 1, 0.01 ) )
Yc = Xc**2
[ mc, nc ] = np.shape( Xc )
#删除抛物柱面多余的数据
for i in range( mc ):
    for j in range( nc ):
        if Zc[ i, j ] < Xc[ i, j ] * Xc[ i, j ] + Yc[ i, j ] * Yc[ i, j ]:
            Zc[ i, j ] = None

#平面 flat surface 的图形数据
Zf = np.ones( Xp.shape )
[ m, n ] = np.shape( Xp )
#删除平面和旋转抛物面多余的数据
for i in range( m ):
    for j in range( n ):
        if Yp[ i, j ] < Xp[ i, j ] * Xp[ i, j ]:
            Zf[ i, j ] = None
            Zp[ i, j ] = None
#绘图
ax.plot_surface( Xc, Yc, Zc, cstride = 1, rstride = 1, edgecolor = 'y' )
ax.plot_surface( Xp, Yp, Zp, cstride = 1, rstride = 1, edgecolor = 'b' )
ax.plot_surface( Xp, Yp, Zf, cstride = 1, rstride = 1, edgecolor = 'r' )
ax.set_xlabel( 'x' )
ax.set_ylabel( 'y' )
ax.set_zlabel( 'z' )
ax.view_init( 20, 30 )
边栏推荐
猜你喜欢
随机推荐
系统线性、时不变、因果判断
TypeScript 快速进阶
Actual combat Meituan Nuxt +Vue family bucket, server-side rendering, mailbox verification, passport authentication service, map API reference, mongodb, redis and other technical points
How to update Win11 sound card driver?Win11 sound card driver update method
【系统设计与实现】基于flink的分心驾驶预测与数据分析系统
How to solve Win11 without local users and groups
Win7遇到错误无法正常开机进桌面怎么解决?
Win10 cannot directly use photo viewer to open the picture
source /build/envsetup.sh和lunch)
Win10 can't start WampServer icon is orange solution
STM32LL库——USART中断接收不定长信息
【我的电赛日记(完结)---2021全国大学生电子设计竞赛全国一等奖】A题:信号失真度测量装置
FP6293电池升压5V-12V大电流2APWM模式升压方案
cmake配置libtorch报错Failed to compute shorthash for libnvrtc.so
PyTorch②---transforms结构及用法、常见的Transforms
PHY6222蓝牙5.2支持MESH组网M0内核超低功耗
Impressions of Embrace Jetpack
Binder机制(下篇)
win10无法直接用照片查看器打开图片怎么办
推开机电的大门《电路》(一):电压,电流,参考方向
