当前位置:网站首页>Common network state detection and analysis tools
Common network state detection and analysis tools
2022-07-03 13:49:00 【yolo_ yyh】
Catalog
netcat(nc)
abbreviation nc, go by the name of “ Swiss Army knife ”, Use nc-h View help documents .
ncat Many parameters are related to nc identical , The difference is nc It's plaintext transmission , Lack of Authentication , and ncat It makes up for these shortcomings .
The main role :
1、telnet Remote login
2、 Port scanning
3、 Transmitting text messages
4、 Transfer files and directories
5、 Encrypt the transfer file
Network state detection tool
ifconfig and ip
Ifconfig and ip Used to view network configuration :
The output indicators of the two are basically the same , Only the display format is different ,ip It has richer functions and easier interfaces .
Output contents include : The status flag of the network interface 、MTU size 、IP、 subnet 、MAC Address and network packet statistics .
There are several indicators closely related to network performance that need attention :
(1) The status flag of the network interface :ifconfig In the output RUNNING perhaps ip In the output LOWER_UP, Indicates that the physical network is connected , If you can't see them , Usually, the network cable may be unplugged ;
(2) The number of bytes sent and received by the network 、 Number of packages 、 The number of errors and packet loss , especially TX and RX Part of the errors、dropped、overruns Equal index , If not for 0, It usually means that there is a network I/O problem .
netstat and ss
Both are used to view sockets 、 Network interface and routing table information ,ss And netstat The output of is similar , however ss Better performance .
netstat The grammar format is netstat [ Options ].
Output contents include : Socket state 、 Receiving queue 、 Sending queue 、 Local address 、 Remote address 、 process PID And process name, etc .
Among them, the receiving queue needs special attention (Recv-Q) And send queue (Send-Q), The two values should usually be 0, If the 0, It indicates that there is the accumulation of network packets , But in different socket States , They have different meanings .
netstat The commonly used options are :
| Parameters | meaning |
|---|---|
| -a or –all | Show... In all connections Socket; |
| -A< Network type > or –< Network type > | List the relevant addresses in the connection of this network type ; |
| -c or –continuous | Keep listing network status ; |
| -C or —cache | Display the cache information of router configuration ; |
| -e or –extend | Display other network related information ; |
| -F or –fib | Show FIB; |
| -g or –groups | Display the group members list of multi broadcast function ; |
| -h or –help | Online Help ; |
| -i or –interfaces | Display the web interface information form ; |
| -l or –listening | Shows the server in the monitor Socket; |
| -M or –masquerade | Show fake network connections |
| -n or –numeric | Use it directly ip Address , Instead of going through the domain name server ; |
| -N or –netlink or –symbolic | Displays the symbolic connection name of the network hardware peripheral ; |
| -o or –timers | Display timer ; |
| -p or —programs | Display in use Socket Program identification code and program name ; |
| -r or –route | Show Routing Table; |
| -s or —statistice | Display network work information statistics ; |
| -t or –tcp | Show TCP The connection status of the transport protocol ; |
| -u or –udp | Show UDP The connection status of the transport protocol ; |
| -v or –verbose | Display during execution of instructions ; |
| -V or –version | Display version information ; |
| -w or –raw | Show RAW The connection status of the transport protocol |
| -x or –unix | And the effect of this parameter is specified "-A unix" Parameters are the same ; |
| –ip or –inet | And the effect of this parameter is specified "-A inet" Parameters are the same |
netstat The main uses are :
(1) View port services :netstat -antp | grep 22
among -a Parameter indicates that all ports are displayed ;-n It means to use directly ip Address , Not through the domain name server ;-t Parameters indicate display TCP The port of the transmission protocol ;-p Indicates that the display is in use socket Program identification code and program name ;
(2) Find out the port where the program runs 
(3) Display network statistics 
(4) Show routing information 
Network packet capturing tool
tcpdump and Wireshark It is a commonly used network packet capturing and analysis tool , among tcpdump Only the command line format is supported ,Wireshark Besides being able to grab bags , Provides a graphical interface and summary analysis tools , When analyzing complex network scenarios , More applicable . When actually analyzing network performance , First use tcpdump Grab the bag , Reuse Wireshark analysis , It's also a common method .
tcpdump
Grammar format :
tcpdump [ -DenNqvX ] [ -c count ] [ -F file ] [ -i interface ] [ -r file ][ -s snaplen ] [ -w file ] [ expression ]
Common options and filter expressions :

Wireshark
Can be tcpdump The captured network packets are saved in a file , use Wireshark open .
$ tcpdump -nn host 93.184.216.34 -w web.pcap
Open the interface as follows :
Wireshark The display format is more regular and clear , You can also view the details of network packets at each layer of the protocol stack :
In the menu bar, click Statistics -> Flow Graph, then , In the pop-up interface Flow type choice TCP Flows, You can see it more clearly , The whole process TCP The execution of the flow : This is similar to the three handshakes and four waves I have learned , But all of them only wave their hands three times , Because the server handle ACK and FIN The merge was sent together .
Other common tools
sar
sar(System ActivityReporter System activity report ) Is currently the Linux One of the most comprehensive system performance analysis tools on , The activities of the system can be reported from many aspects , Include : Reading and writing of documents 、 Usage of system calls 、 disk I/O、CPU efficiency 、 Memory usage 、 Process activities and IPC Related activities, etc .
nslookup
nslookup Used for query DNS The record of , Check whether domain name resolution is normal , Used to diagnose network problems in case of network failure .
dstat
dstat Is a replaceable vmstat、iostat、netstat、ifstat These command tools , It's an all-round system information statistics tool .
Use dstat Will be displayed CPU、 disk I/O、 The overall usage of network and memory resources and the number of interrupts and context interrupts are two key system indicators , Take network resources as an example ,dstat It can also output some key indicators about the network :
$ dstat –tcp
------tcp-sockets-------
lis act syn tim clo
27 38 0 0 0
27 38 0 0 0
The meaning of these indicators is :
(1)Lis : Indicates that you are listening (Listen) The number of connections to the state ;
(2)Act: Indicates that you are connected (ESTABLISHED) The number of connections to the state ;
(3)Syn: The number of connections in the three handshake stage , If the index is too large , It often means that there are a lot of TCP New connection request ;
(4)Tim: be in TIME-WAIT The number of connections to the state ;
(5)Clo: be in CLOSE-WAIT The number of connections to the state , If there are too many items , It often means that the application exists bug, No initiative to call close() To close these connections .
边栏推荐
- [développement technologique - 24]: caractéristiques des technologies de communication Internet des objets existantes
- PhpMyAdmin stage file contains analysis traceability
- 服务器硬盘冷迁移后网卡无法启动问题
- JS 将伪数组转换成数组
- Resource Cost Optimization Practice of R & D team
- Golang - command line tool Cobra
- User and group command exercises
- Field problems in MySQL
- Which securities company has the lowest Commission for opening an account online? I want to open an account. Is it safe for the online account manager to open an account
- [bw16 application] instructions for firmware burning of Anxin Ke bw16 module and development board update
猜你喜欢

Internet of things completion -- (stm32f407 connects to cloud platform detection data)
![[understanding by chance-37]: the structure of human sensory system determines that human beings are self-centered](/img/06/b71b505c7072d540955fda6da1dc1b.jpg)
[understanding by chance-37]: the structure of human sensory system determines that human beings are self-centered

挡不住了,国产芯片再度突进,部分环节已进到4nm

Several common optimization methods matlab principle and depth analysis
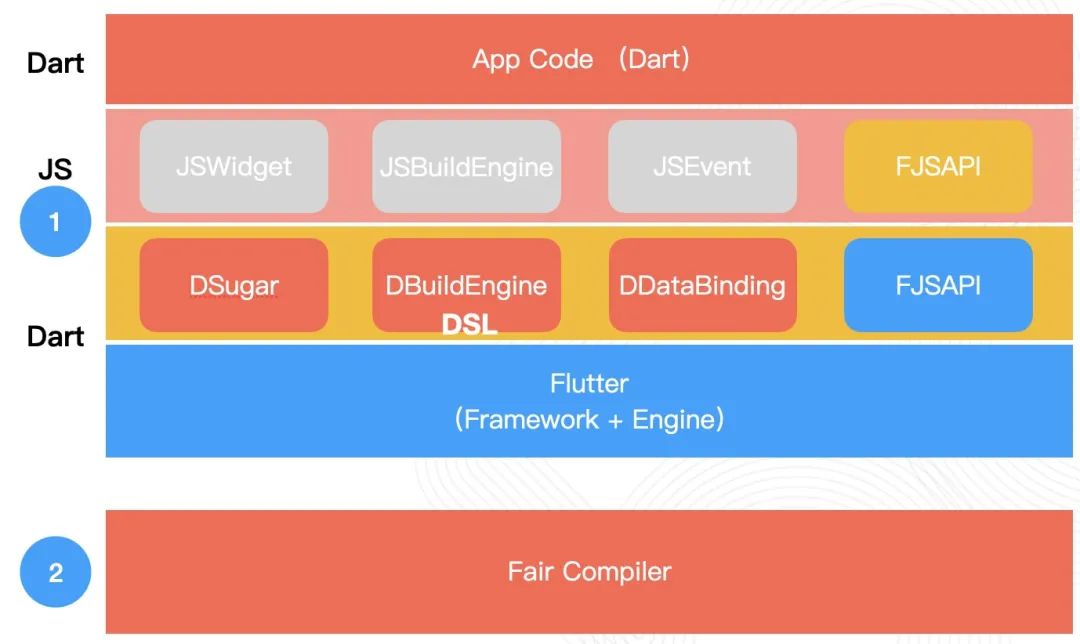
Flutter动态化 | Fair 2.5.0 新版本特性

Complete DNN deep neural network CNN training with tensorflow to complete image recognition cases

Can newly graduated European college students get an offer from a major Internet company in the United States?
物联网毕设 --(STM32f407连接云平台检测数据)
Richview trvstyle liststyle list style (bullet number)

AI 考高数得分 81,网友:AI 模型也免不了“内卷”!
随机推荐
Multi table query of MySQL - multi table relationship and related exercises
Heap structure and heap sort heapify
栈应用(平衡符)
Use docker to build sqli lab environment and upload labs environment, and the operation steps are provided with screenshots.
Complete deep neural network CNN training with tensorflow to complete picture recognition case 2
Richview trvstyle liststyle list style (bullet number)
[机缘参悟-37]:人感官系统的结构决定了人类是以自我为中心
HALCON联合C#检测表面缺陷——HALCON例程autobahn
Another industry has been broken by Chinese chips. No wonder the leading analog chip companies in the United States have cut prices and sold off
MySQL functions and related cases and exercises
SQL Injection (GET/Select)
顺序表(C语言实现)
Error running 'application' in idea running: the solution of command line is too long
Mobile phones and computers can be used, whole people, spoof code connections, "won't you Baidu for a while" teach you to use Baidu
RichView TRVStyle ListStyle 列表样式(项目符号编号)
CVPR 2022 | interpretation of 6 excellent papers selected by meituan technical team
树的深入和广度优先遍历(不考虑二叉树)
This math book, which has been written by senior ml researchers for 7 years, is available in free electronic version
Field problems in MySQL
Start signing up CCF C ³- [email protected] chianxin: Perspective of Russian Ukrainian cyber war - Security confrontation and sanctions g