当前位置:网站首页>TensorBoard可视化处理案例简析
TensorBoard可视化处理案例简析
2022-07-03 12:45:00 【海宝7号】
https://tensorflow.google.cn/tensorboard?hl=zh-cn
TensorBoard 提供机器学习实验所需的可视化功能和工具:
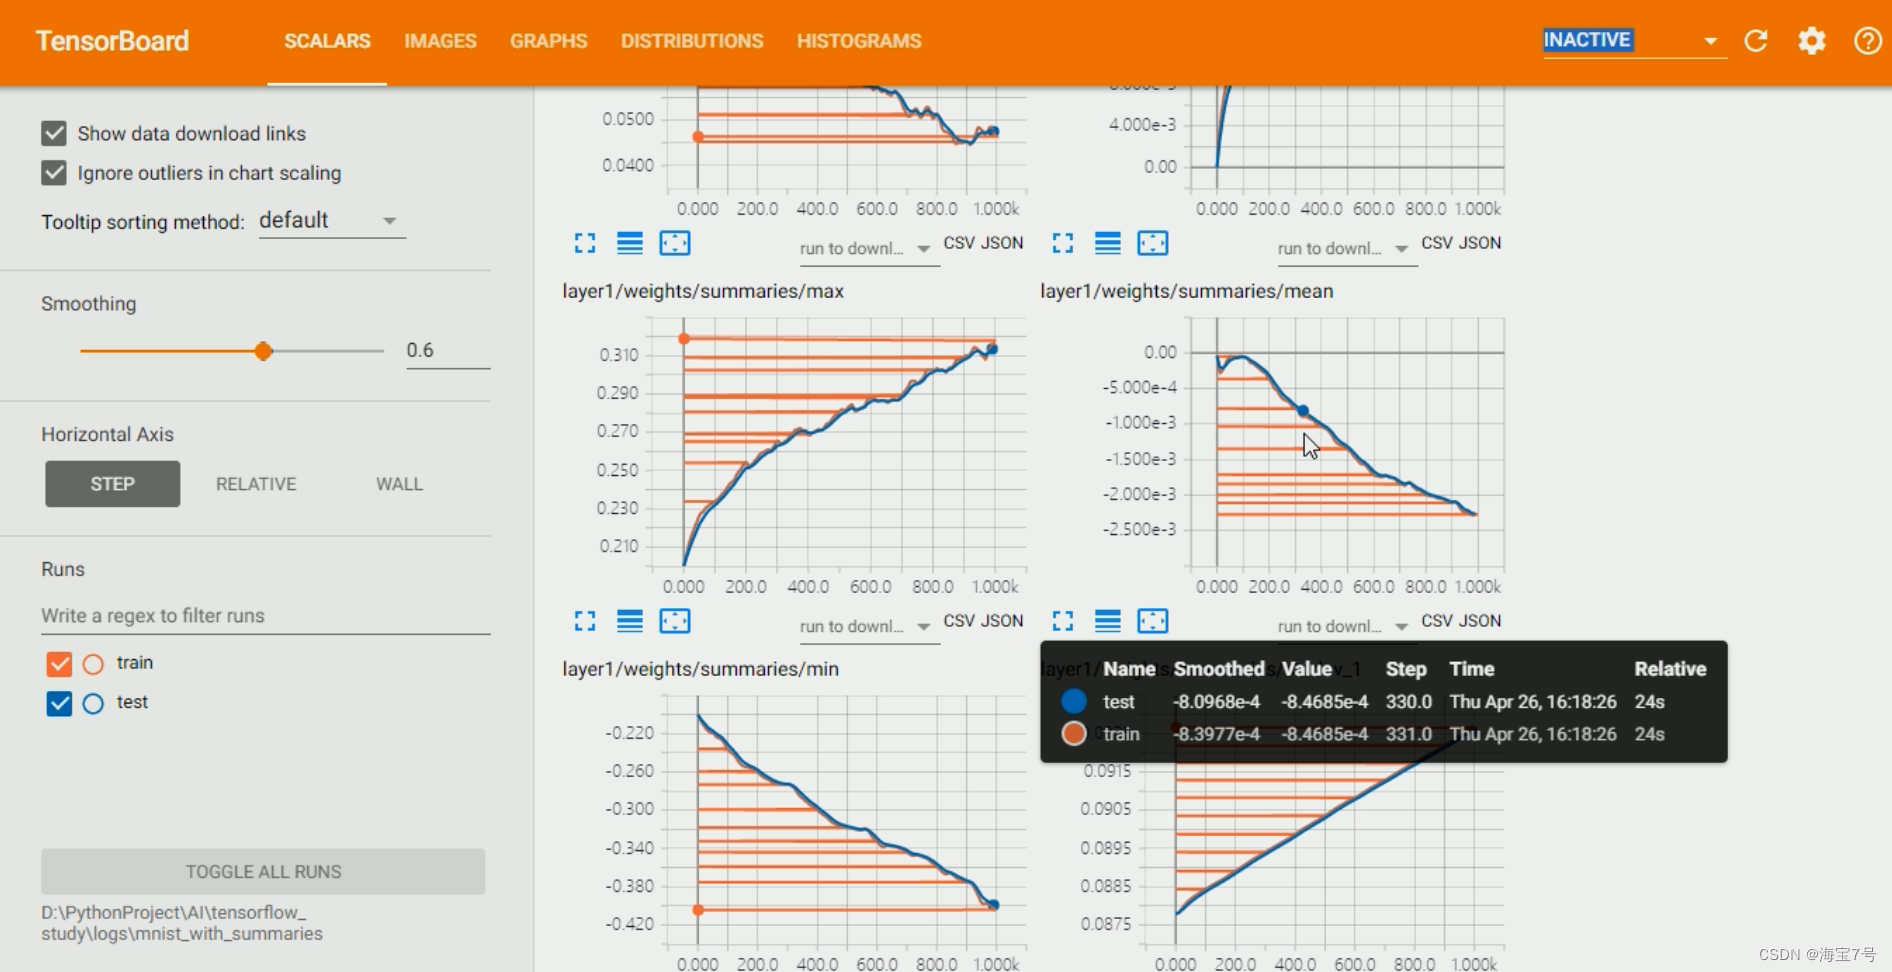
跟踪和可视化损失及准确率等指标
可视化模型图(操作和层)
查看权重、偏差或其他张量随时间变化的直方图
将嵌入投射到较低的维度空间
显示图片、文字和音频数据
剖析 TensorFlow 程序
以及更多功能
TensorBoard是一个独立的包(不是pytorch中的),这个包的作用就是可视化您模型中的各种参数和结果。
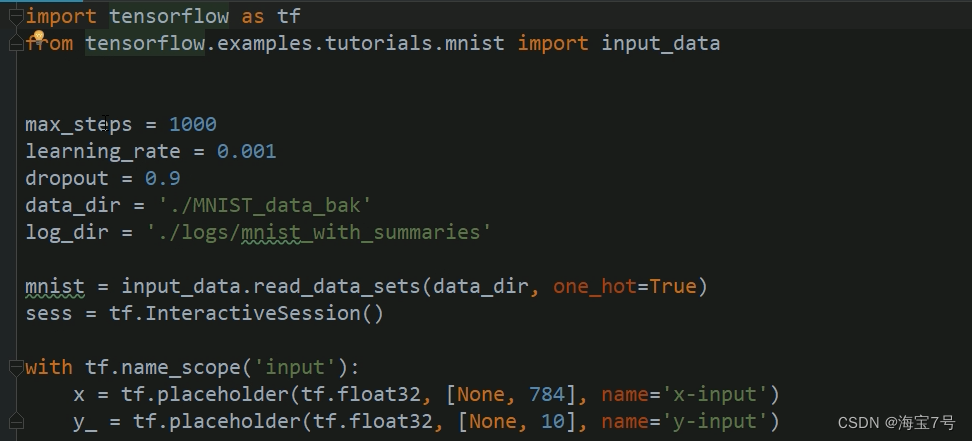
代码附上:
import tensorflow as tf
from tensorflow.examples.tutorials.mnist import input_data


max_steps = 1000
learning_rate = 0.001
dropout = 0.9
data_dir = './MNIST_data_bak'
log_dir = './logs/mnist_with_summaries'

mnist = input_data.read_data_sets(data_dir, one_hot=True)
sess = tf.InteractiveSession()

with tf.name_scope('input'):
    x = tf.placeholder(tf.float32, [None, 784], name='x-input')
    y_ = tf.placeholder(tf.float32, [None, 10], name='y-input')

with tf.name_scope('input_reshape'):
    # 784维度变形为图片保持到节点
    # -1 代表进来的图片的数量、28,28是图片的高和宽,1是图片的颜色通道
    image_shaped_input = tf.reshape(x, [-1, 28, 28, 1])
    tf.summary.image('input', image_shaped_input, 10)


# 定义神经网络的初始化方法
def weight_variable(shape):
    initial = tf.truncated_normal(shape, stddev=0.1)
    return tf.Variable(initial)


def bias_variable(shape):
    initial = tf.constant(0.1, shape=shape)
    return tf.Variable(initial)


# 定义Variable变量的数据汇总函数,我们计算出变量的mean、stddev、max、min
# 对这些标量数据使用tf.summary.scalar进行记录和汇总
# 使用tf.summary.histogram直接记录变量var的直方图数据
def variable_summaries(var):
    with tf.name_scope('summaries'):
        mean = tf.reduce_mean(var)
        tf.summary.scalar('mean', mean)
        with tf.name_scope('stddev'):
            stddev = tf.sqrt(tf.reduce_mean(tf.square(var - mean)))
        tf.summary.scalar('stddev', stddev)
        tf.summary.scalar('max', tf.reduce_max(var))
        tf.summary.scalar('min', tf.reduce_min(var))
        tf.summary.histogram('histogram', var)


# 设计一个MLP多层神经网络来训练数据
# 在每一层中都对模型数据进行汇总
def nn_layer(input_tensor, input_dim, output_dim, layer_name, act=tf.nn.relu):
    with tf.name_scope(layer_name):
        with tf.name_scope('weights'):
            weights = weight_variable([input_dim, output_dim])
            variable_summaries(weights)
        with tf.name_scope('biases'):
            biases = bias_variable([output_dim])
            variable_summaries(biases)
        with tf.name_scope('Wx_plus_b'):
            preactivate = tf.matmul(input_tensor, weights) + biases
            tf.summary.histogram('pre_activations', preactivate)
        activations = act(preactivate, name='activation')
        tf.summary.histogram('activations', activations)
        return activations


# 我们使用刚刚定义的函数创建一层神经网络,输入维度是图片的尺寸784=28*28
# 输出的维度是隐藏节点数500,再创建一个Dropout层,并使用tf.summary.scalar记录keep_prob
# 然后使用nn_layer定义神经网络输出层,其输入维度为上一层隐含节点数500,输出维度为类别数10
# 同时激活函数为全等映射identity,暂时不使用softmax
hidden1 = nn_layer(x, 784, 500, 'layer1')

with tf.name_scope('dropout'):
    keep_prob = tf.placeholder(tf.float32)
    tf.summary.scalar('dropout_keep_probability', keep_prob)
    dropped = tf.nn.dropout(hidden1, keep_prob)

y = nn_layer(dropped, 500, 10, 'layer2', act=tf.identity)

# 使用tf.nn.softmax_cross_entropy_with_logits()对前面的输出层的结果进行Softmax
# 处理并计算交叉熵损失cross_entropy,计算平均的损失,使用tf.summary.scalar进行统计汇总
with tf.name_scope('cross_entropy'):
    diff = tf.nn.softmax_cross_entropy_with_logits(logits=y, labels=y_)
    with tf.name_scope('total'):
        cross_entropy = tf.reduce_mean(diff)
tf.summary.scalar('cross_entropy', cross_entropy)


# 下面使用Adam优化器对损失进行优化,同时统计预测正确的样本数并计算正确率accuracy,汇总
with tf.name_scope('train'):
    train_step = tf.train.AdamOptimizer(learning_rate).minimize(cross_entropy)
with tf.name_scope('accuracy'):
    with tf.name_scope('correct_prediction'):
        correct_prediction = tf.equal(tf.argmax(y, 1), tf.argmax(y_, 1))
    with tf.name_scope('accuracy'):
        accuracy = tf.reduce_mean(tf.cast(correct_prediction, tf.float32))

tf.summary.scalar('accuracy', accuracy)

# 因为我们之前定义了太多的tf.summary汇总操作,逐一执行这些操作太麻烦,
# 使用tf.summary.merge_all()直接获取所有汇总操作,以便后面执行
merged = tf.summary.merge_all()
# 定义两个tf.summary.FileWriter文件记录器再不同的子目录,分别用来存储训练和测试的日志数据
train_writer = tf.summary.FileWriter(log_dir + '/train', sess.graph)
test_writer = tf.summary.FileWriter(log_dir + '/test')
# 同时,将Session计算图sess.graph加入训练过程,这样再TensorBoard的GRAPHS窗口中就能展示
# 整个计算图的可视化效果,最后初始化全部变量
tf.global_variables_initializer().run()


# 定义feed_dict函数,如果是训练,需要设置dropout,如果是测试,keep_prob设置为1
def feed_dict(train):
    if train:
        xs, ys = mnist.train.next_batch(100)
        k = dropout
    else:
        xs, ys = mnist.test.images, mnist.test.labels
        k = 1.0
    return {
    x: xs, y_: ys, keep_prob: k}


# 执行训练、测试、日志记录操作
# 创建模型的保存器
saver = tf.train.Saver()
for i in range(max_steps):
    if i % 10 == 0:
        summary, acc = sess.run([merged, accuracy], feed_dict=feed_dict(False))
        test_writer.add_summary(summary, i)
        print('Accuracy at step %s: %s' % (i, acc))
    else:
        if i % 100 == 99:
            run_options = tf.RunOptions(trace_level=tf.RunOptions.FULL_TRACE)
            run_metadata = tf.RunMetadata()
            summary, _ = sess.run([merged, train_step], feed_dict=feed_dict(True))
            train_writer.add_run_metadata(run_metadata, 'step%03d' % i)
            train_writer.add_summary(summary, 1)
            saver.save(sess, log_dir + 'model.ckpt', i)
            print('Adding run metadata for', i)
        else:
            summary, _ = sess.run([merged, train_step], feed_dict=feed_dict(True))
            train_writer.add_summary(summary, i)

train_writer.close()
test_writer.close()
训练过程
高级使用操作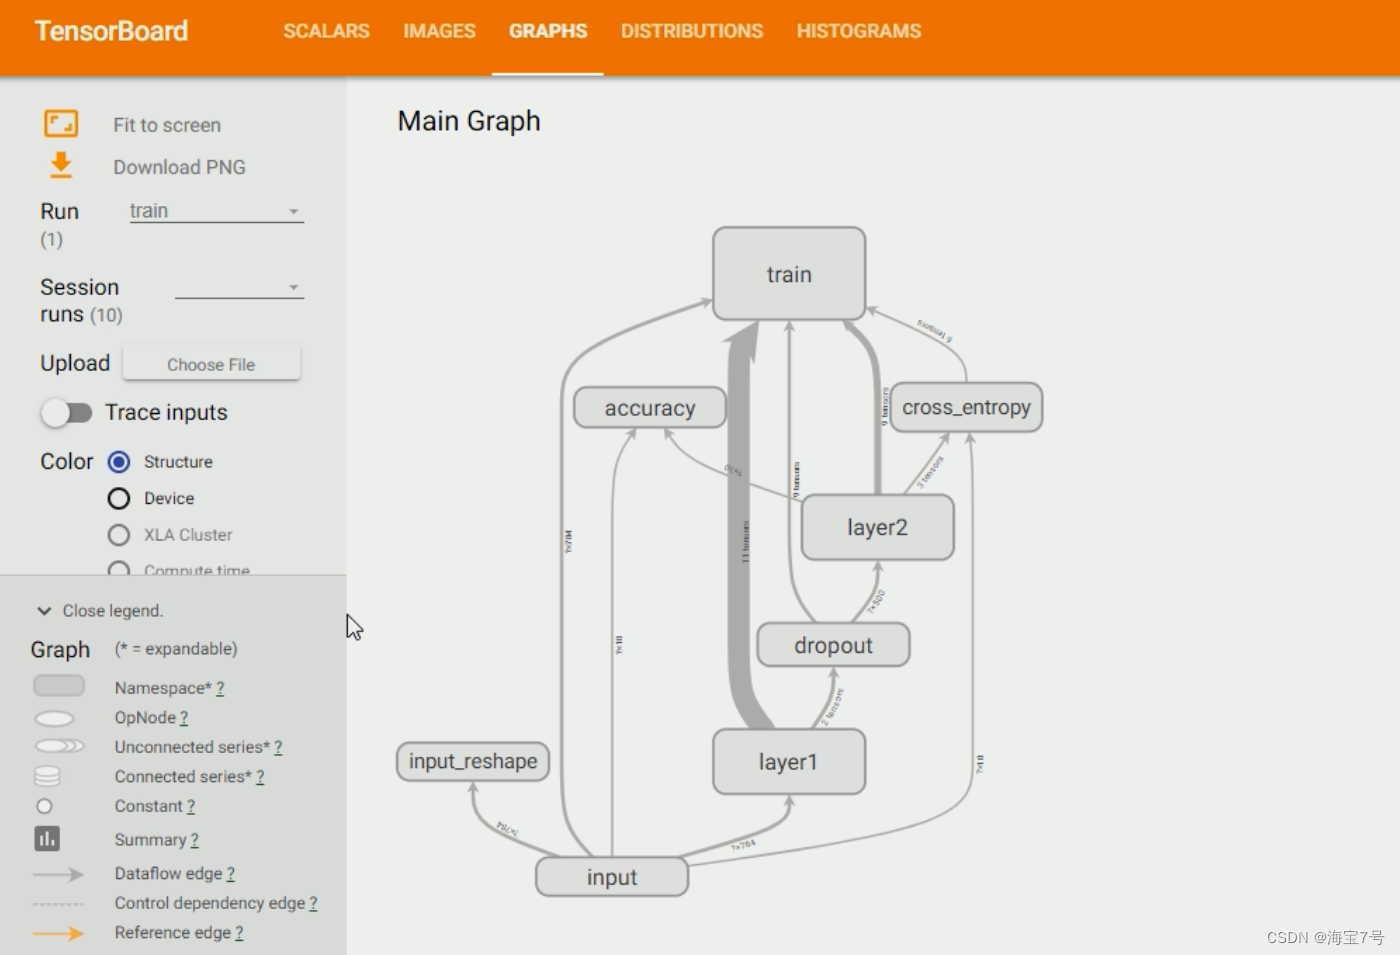
个人觉得,还是需要自学,或者是有一个引路人大佬,不然上手过程还有后续的处理比较麻烦。
TensorBoard可视化工具简单教程参考
https://blog.csdn.net/qq_41573860/article/details/106674370
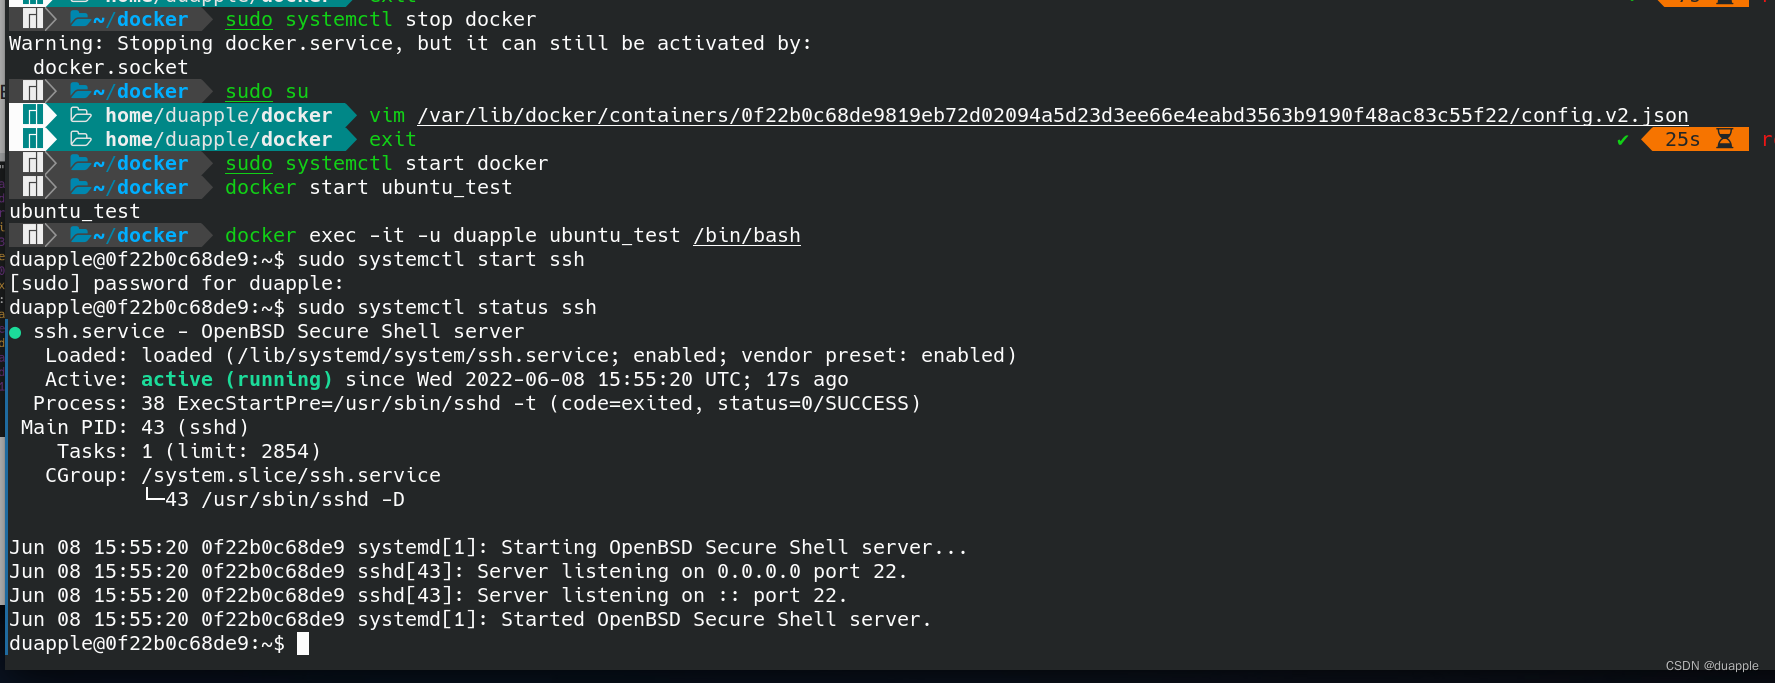
远程tensorboard
由于条件所限,通常在进行深度学习时都是在远处的服务器上进行训练的,利用SSH的方向隧道技术,将服务器上的端口数据转发到本地对应的端口,然后就能在本地方法服务器上的日志数据了。
参考:https://blog.csdn.net/zhaokx3/article/details/70994350
边栏推荐
- 35道MySQL面试必问题图解,这样也太好理解了吧
- Flick SQL knows why (10): everyone uses accumulate window to calculate cumulative indicators
- Ubuntu 14.04 下开启PHP错误提示
- Useful blog links
- 2022-01-27 redis cluster brain crack problem analysis
- 服务器硬盘冷迁移后网卡无法启动问题
- Detailed explanation of multithreading
- Flink SQL knows why (13): is it difficult to join streams? (next)
- Fabric.js 更换图片的3种方法(包括更换分组内的图片,以及存在缓存的情况)
- Flink SQL knows why (19): the transformation between table and datastream (with source code)
猜你喜欢
Flink SQL knows why (7): haven't you even seen the ETL and group AGG scenarios that are most suitable for Flink SQL?

Internet of things completion -- (stm32f407 connects to cloud platform detection data)

2022-02-09 survey of incluxdb cluster
Flink SQL knows why (12): is it difficult to join streams? (top)

Libuv库 - 设计概述(中文版)
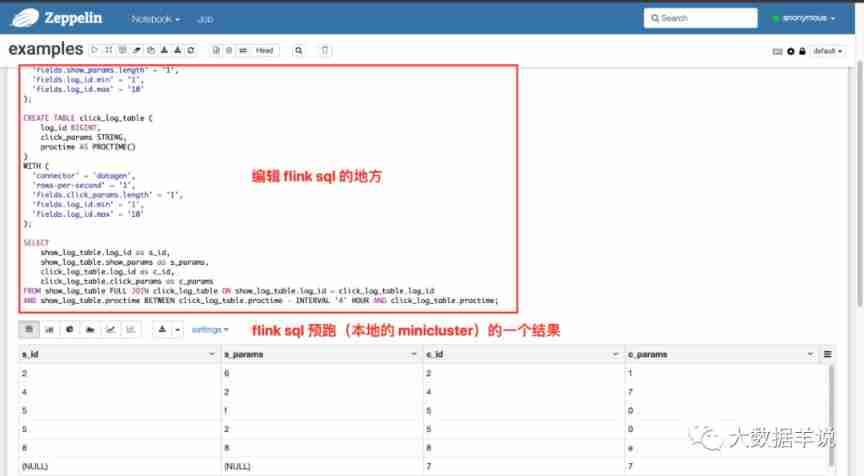
Flink SQL knows why (17): Zeppelin, a sharp tool for developing Flink SQL
Solve system has not been booted with SYSTEMd as init system (PID 1) Can‘t operate.

MySQL functions and related cases and exercises

2022-02-11 heap sorting and recursion

道路建设问题
随机推荐
Libuv库 - 设计概述(中文版)
Can newly graduated European college students get an offer from a major Internet company in the United States?
PowerPoint 教程,如何在 PowerPoint 中将演示文稿另存为视频?
Elk note 24 -- replace logstash consumption log with gohangout
Fabric.js 更换图片的3种方法(包括更换分组内的图片,以及存在缓存的情况)
编程内功之编程语言众多的原因
PowerPoint tutorial, how to save a presentation as a video in PowerPoint?
Start signing up CCF C ³- [email protected] chianxin: Perspective of Russian Ukrainian cyber war - Security confrontation and sanctions g
The shortage of graphics cards finally came to an end: 3070ti for more than 4000 yuan, 2000 yuan cheaper than the original price, and 3090ti
Flink SQL knows why (17): Zeppelin, a sharp tool for developing Flink SQL
AI 考高数得分 81,网友:AI 模型也免不了“内卷”!
The difference between session and cookie
PowerPoint 教程,如何在 PowerPoint 中將演示文稿另存為視頻?
Sword finger offer 16 Integer power of numeric value
MapReduce实现矩阵乘法–实现代码
服务器硬盘冷迁移后网卡无法启动问题
Road construction issues
Servlet
sitesCMS v3.1.0发布,上线微信小程序
The difference between stratifiedkfold (classification) and kfold (regression)