当前位置:网站首页>R language principal component PCA, factor analysis, clustering analysis of regional economy analysis of Chongqing Economic Indicators
R language principal component PCA, factor analysis, clustering analysis of regional economy analysis of Chongqing Economic Indicators
2022-07-07 04:42:00 【Extension Research Office】
Link to the original text :http://tecdat.cn/?p=27515
The source of the original text is : The official account of the tribal public
Establish the economic index development system of Chongqing , Take Chongqing One hour economic circle As a sample , Use factor analysis method for empirical analysis , Based on the relevant evaluation theories and methods , This paper extracts the economic scale 、 Per capita development level 、 Economic development potential 、3 Main factors , from 2 Chongqing statistical yearbook selection 8 The index system composed of the following indicators is of great significance to Chongqing 38 Analyze the eight indicators of the basic situation of economic development of districts and counties , Based on the main factor score matrix, Chongqing 38 Districts and counties Cluster analysis . It turns out that : According to the comprehensive score , It can be seen that Yuzhong District ranks the top three in terms of social and economic development level of all districts and counties 、 Yubei District 、 Jiulongpo District , The three lowest scores are in Wushan County 、 Wuxi County 、 Chengkou county , Combined with the overall analysis, we can see that Yuzhong District 、 Jiulongpo District is better in terms of overall economic scale and construction industry , The economic strength of the surrounding areas of Chongqing is poor , The investment environment is not good , Especially the lack of architecture , So that the economic development is relatively weak , In any way, the economic strength of Yuzhong District is the best among all districts and counties in Chongqing .
Establishment of evaluation indicators
Evaluate the level of economic development between regions , An appropriate index system must be established . Considering the complexity of regional economic indicators 、 Diversity and operability , On this basis, this paper establishes a relatively complete set of regional economic evaluation index system that is easy to be quantitatively analyzed , Reflect the characteristics of regional economic development from different angles .
The index system established in this paper includes 8 Indicators , From the economic scale 、 Per capita development level 、 Economic development potential and other aspects to reflect the characteristics of regional economic development . The specific indicators are as follows :
Gross Regional Product ( Ten thousand yuan )(X1)
Total retail sales of consumer goods ( Ten thousand yuan )(X2)
Total industrial output value ( Ten thousand yuan )(X3)
Total output value of construction industry ( Ten thousand yuan )(X4)
High tech GDP ( Ten thousand yuan )(X5)
Investment in fixed assets of the whole society ( Ten thousand yuan )(X6)
Per capita disposable income ( element )(X7)
GDP per capita ( element )(X8)
Application of factor analysis in Regional Economic Research
Factor analysis model and its steps
Factor analysis is a technique of data simplification . It studies the internal dependencies between many variables , Explore the basic structure of observation data , And use a few hypothetical variables to represent its basic data structure . These hypothetical variables can reflect the main information of many original variables . The original variable is an observable explicit variable , Hypothetical variables are unobservable potential variables , It's called a factor . set up p A variable , Then the mathematical model of factor analysis can be expressed as :
![]()
call ![]() For the public factor , Is an unobservable variable , Their coefficients are called factor loads . Is a special factor , Can't be before m Part of a common factor . The steps of factor analysis are as follows :
For the public factor , Is an unobservable variable , Their coefficients are called factor loads . Is a special factor , Can't be before m Part of a common factor . The steps of factor analysis are as follows :
(1) Standardize raw data , Still recorded as X;(2) Establish the correlation coefficient matrix R;(3) Solve the characteristic equation , Calculate the eigenvalues and eigenvectors , When the cumulative contribution rate is not less than 85% when , extract k Three principal components replace the original m Indicators , Calculate the factor load matrix A;(4) Yes A Perform maximum orthogonal rotation Exchange ;(5) Name and explain the main factors . To sort , Then calculate the score of each main factor , Take the contribution rate as the weight , Calculate the comprehensive factor score for the weighting .
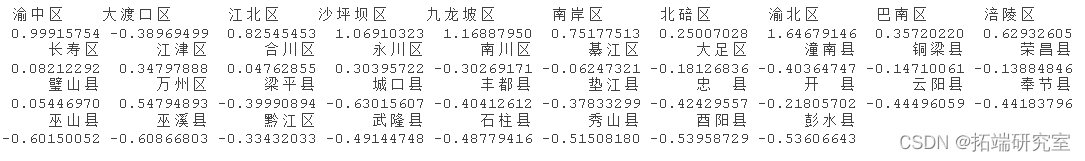
Sample selection and data source
This paper selects Chongqing 38 Districts and counties were analyzed as samples , The aim is to explore how to base on R Factor analysis and cluster analysis methods of statistical software study regional economic development . The specific data are as follows :
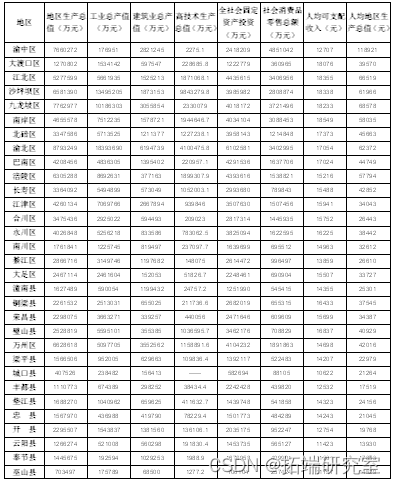
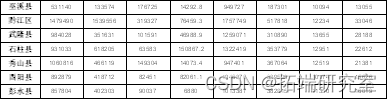
Data analysis process
Enter the original data R In software , Select regional GDP ( Ten thousand yuan )(X1)、 Total retail sales of consumer goods ( Ten thousand yuan )(X2)、 Total industrial output value ( Ten thousand yuan )(X3)、 Total output value of construction industry ( Ten thousand yuan )(X4)、 High tech GDP ( Ten thousand yuan )(X5)、 Investment in fixed assets of the whole society ( Ten thousand yuan )(X6)、 Per capita disposable income ( element )(X7)、 GDP per capita ( element )(X8).
Before factor analysis , We observe the correlation coefficient matrix , And use KMO and Bartlett’s Test Check whether the data is suitable for factor analysis . Then do descriptive analysis Analysis-factor-description Get the initial common factor variance 、 factor 、 Characteristic values and percentages and cumulative percentages explained by each factor . The analysis results are as follows :
coebaltt(COR,)#Bartlett Spherical inspection
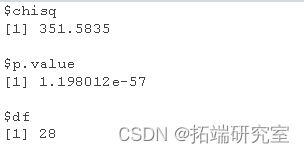
Bartlett Sphericity test of p value ( Significance probability value sig)<0.05, Indicates that it has passed the inspection , The distribution can be approximately normal , Therefore, factor analysis can be carried out .
sreeot(PCA,type="lines")

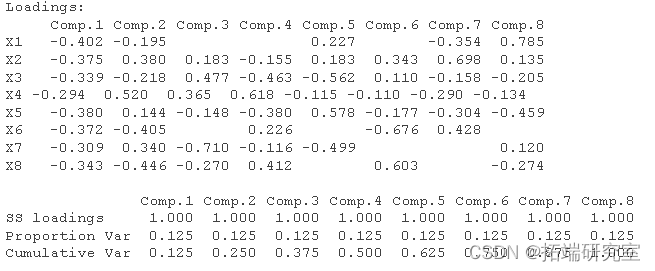
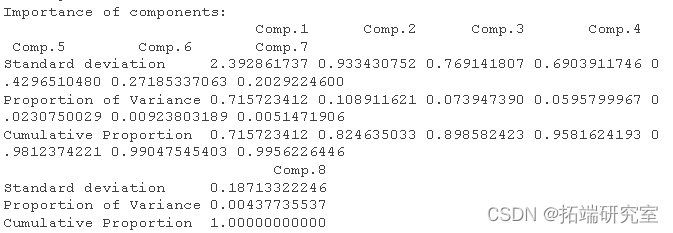
It can be concluded from the table , extract 3 The cumulative variance contribution rate of factors has reached 89.854%>86%, The loss of information is only 10.146%, From 4 The contribution rate of variance of all factors is lower than 5%, So choose 3 The effect of factor analysis with common factors is ideal ; It can be seen from the gravel diagram in the figure that 4 Factors start , The eigenvalue difference changes little , in summary : When the characteristic value is greater than 0.5 Under the condition of , The three factors extracted can pass the test and be well described 8 Indicators , So before extraction 3 An eigenvalue is used to establish the factor load matrix .
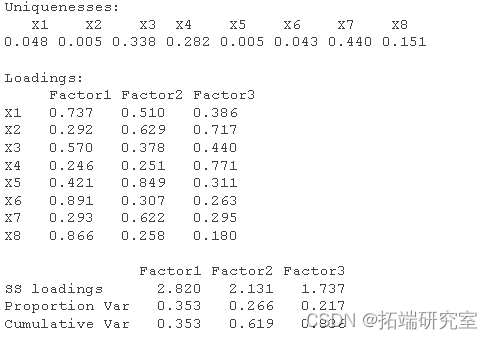
The table shows the initial factor load matrix , F1、F2、F3 As the first 、 second 、 The third common factor . The mathematical purpose of factor analysis is not only to find out common factors and group variables , It is more important to know the meaning of each common factor , For further analysis , If the meaning of each common factor is unclear , It is not convenient to explain the actual background . Because the factor load matrix is not unique , Therefore, the factor load matrix should be rotated . The purpose is to simplify the structure of the factor load matrix , Make the square value of each column or row of the load matrix to 0 and 1 Polarization . There are three main orthogonal rotation methods . The fourth power maximum method 、 Variance maximization method and equivalent maximization method .
Therefore, factor rotation is required , Make the contribution of factors to variables reach the effect of polarization . Therefore, the orthogonal rotation method of maximizing variance is adopted , Make each variable produce a higher load on a certain factor , The load of other factors is small , Thus, the factor load matrix after rotation is obtained , As shown in the following table :
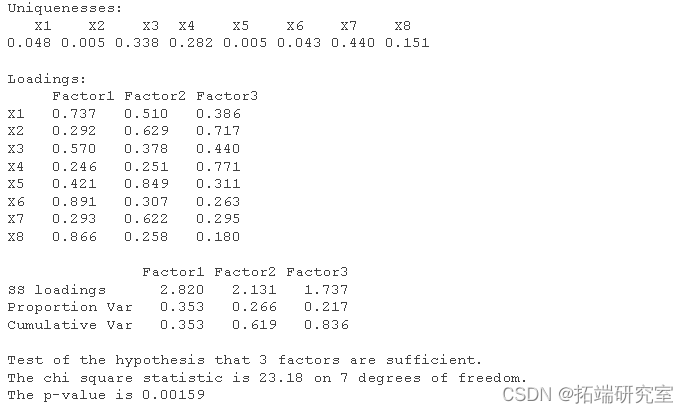
It can be seen from the table and the rotated factor graph , The ability to interpret the original data through the rotated common factor is improved , Expressed as a common factor F1 stay X1( Gross Regional Product ),X6( Investment in fixed assets of the whole society ) and X8( GDP per capita ) The load values on the are very large . Therefore, we can establish the first public factor as the factor of comprehensive economic strength , Macroscopically, it reflects the overall situation of the regional economic development scale , The higher the score on this factor , It shows that the overall situation of urban economic development is better .
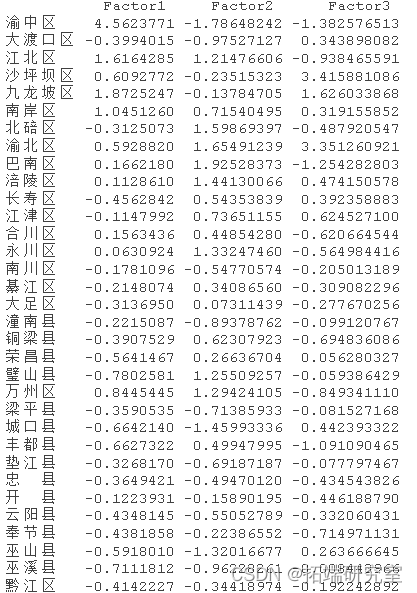
Use the variance contribution rate of each common factor to calculate the comprehensive score , And calculate the comprehensive score = factor 1 The variance contribution rate of * factor 1 Score of + factor 2 The variance contribution rate of * factor 2 Score of + factor 3 The variance contribution rate of * factor 3 Score of . Arrange the data in descending order according to the comprehensive score , The partial factor scores and comprehensive scores obtained are shown in the figure below :

Result discussion
Score based on the above factors , We can draw 2012 Chongqing in 38 The economic development of the districts and counties is as follows :
1、 According to economic strength factor F1 Score greater than 1 Yuzhong District in turn 、 Yubei District 、 Jiulongpo District 、 Jiangbei District and Wanzhou District , The scores are 4.4211、1.8967、1.7808、1.201、1.2804. Explain the overall scale of the economy and the construction industry , Yuzhong District 、 Yubei District 、 Jiulongpo 、 Jiangbei District and Wanzhou District are in Chongqing 38 Among the districts and counties, it is the best , Large scale , The strongest economy , The future is very good , Regions with strong economic development strength .
2、 According to the economic development potential factor F2 Score greater than 1 There are Shapingba District and Yubei District , The scores are 3.7052、3.4396. It shows that it is relatively developed in high technology, science and industry , The investment in fixed assets is the largest , These two areas are in the main city , High degree of opening up , Scientific and technological innovation is better , Have their own industrial development , Has basically formed its own industrial structure , Give full play to their geographical advantages and resource and environmental advantages , Great potential for development .
Cluster analysis based on principal factor scores
Cluster analysis
Cluster analysis is also called group analysis , Is to group data into multiple classes . Objects in the same class have high similarity , Objects of different classes differ greatly . In society economic There are a lot of classification problems in the field , For example, if we investigate the price index of some big cities , And there are many price indexes , There is a price index for agricultural production 、 Service price index 、 Food consumer price index 、 Retail price index of building materials, etc . Because there are many price indexes to be investigated , Usually, these price indexes are classified first . All in all , There are many problems that need to be classified , Therefore, clustering analysis, a useful tool, has attracted more and more attention , It has been widely used in many fields .
The content of cluster analysis is very rich , There is a systematic clustering method 、 Ordered sample clustering method 、 Dynamic clustering 、 Fuzzy clustering method 、 Graph theory clustering method 、 Cluster prediction method, etc ; The most commonly used and successful cluster analysis is systematic clustering , The basic idea of systematic clustering method is to first n Each sample is regarded as a class , Then specify the... Between samples “ distance ” And the distance between classes . Select the two nearest classes and merge them into a new class , Calculate new classes and other classes ( Each current category ) Distance of , Then merge the two nearest classes . such , Reduce one category per merge , Until all samples are classified into one class .
The basic steps of systematic clustering :
1、 Calculation n The distance between two samples .
2、 structure n Classes , Each class contains only one sample .
3、 Merge the two closest classes into a new class .
4、 Calculate the distance between the new class and each current class .
5、 Repeat step 3、4, Merge the two closest classes into a new class , Until all classes are merged into one class .
6、 Draw a cluster pedigree .
7、 Determine the number of classes and classes .
Systematic clustering method :1、 The shortest distance method ;2、 The longest distance method ;3、 Middle distance method ;4、 Barycenter method ;5、 Class average method ;6、 The sum of squares of deviations (Ward Law ).
Based on the main factor score, Chongqing 38 Analysis of economic development of districts and counties , Use the clustering method to select the inter group link method , Calculate the distance and choose the square Euclidean distance , Only standardized data can be processed with standard Zhengtai data . The results are as follows :
rct.st(hc,k = 6, border = "red")
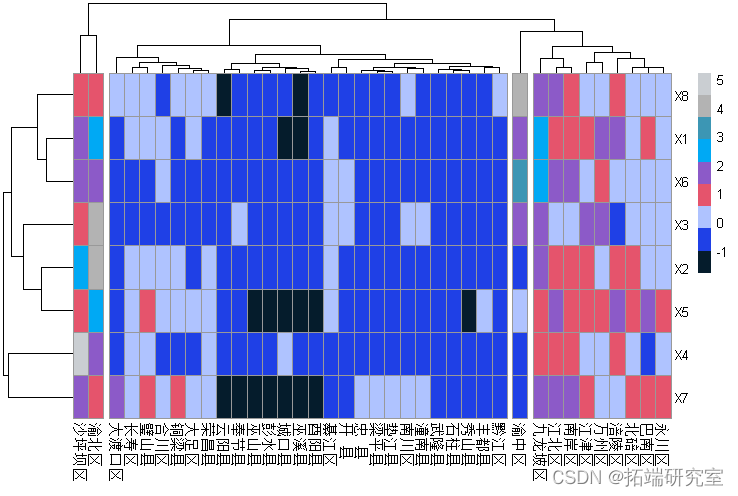
From the tree view , Chongqing districts and counties can be divided into six categories according to the actual situation of economy and strength :
The first category only includes Yuzhong District , Yuzhong District is the central city of Chongqing , It is the political, economic and cultural center of Chongqing 、 Highland of basic education 、 It has special location advantages and prominent strategic position . The current situation of the industrial structure is characterized by the absolute advantage of the tertiary industry , Among them, the financial industry 、 Commerce and intermediary services are the leading industries , It belongs to an area with strong economic development .
The second category only includes Yubei District , Yubei district has successively launched the master plan 65 Square kilometers of Chongqing Science and Technology Industrial Park 、 Chongqing modern agricultural park 、 Eastern Chongqing area for development Projects such as , Named by the municipal government " Chongqing Agricultural Science and Technology Park ", Therefore, the region has made a great contribution to the GDP of high technology , And the investment environment is superior , And most areas have their own central business zone , High degree of opening up , The location advantage is obvious , Reasonable industrial structure , It belongs to an area with strong economic development .

The most popular insights
1.matlab Partial least squares regression (PLSR) And principal component regression (PCR)
3. Principal component analysis (PCA) Basic principles and analysis examples
5. Use LASSO Regression prediction of stock return data analysis
6.r In language lasso Return to ,ridge Ridge return and elastic-net Model
7.r Partial least squares regression in language pls-da Data analysis
边栏推荐
- VM virtual machine operating system not found and NTLDR is missing
- leetcode 53. Maximum subarray maximum subarray sum (medium)
- Web3 社区中使用的术语
- 组织实战攻防演练的5个阶段
- What work items do programmers hate most in their daily work?
- Detect when a tab bar item is pressed
- C#使用西门子S7 协议读写PLC DB块
- Thesis landing strategy | how to get started quickly in academic thesis writing
- Advertising attribution: how to measure the value of buying volume?
- Meaning of 'n:m' and '1:n' in database design
猜你喜欢
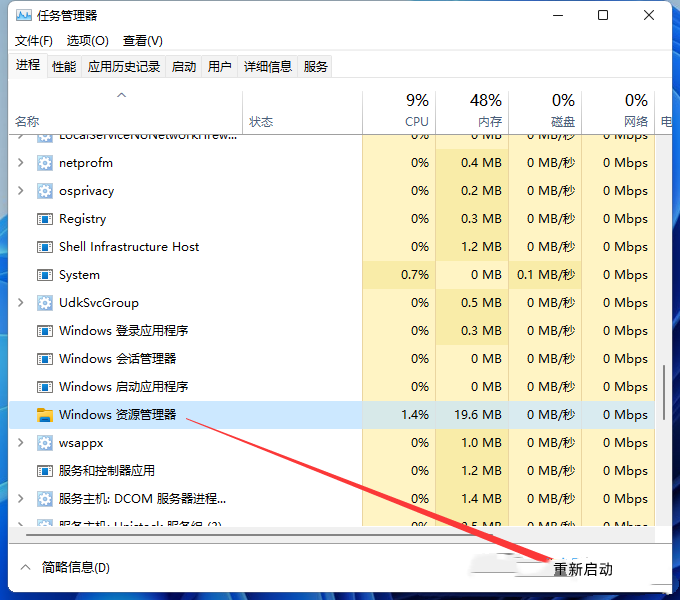
What if the win11 screenshot key cannot be used? Solution to the failure of win11 screenshot key
Programmers go to work fishing, so play high-end!
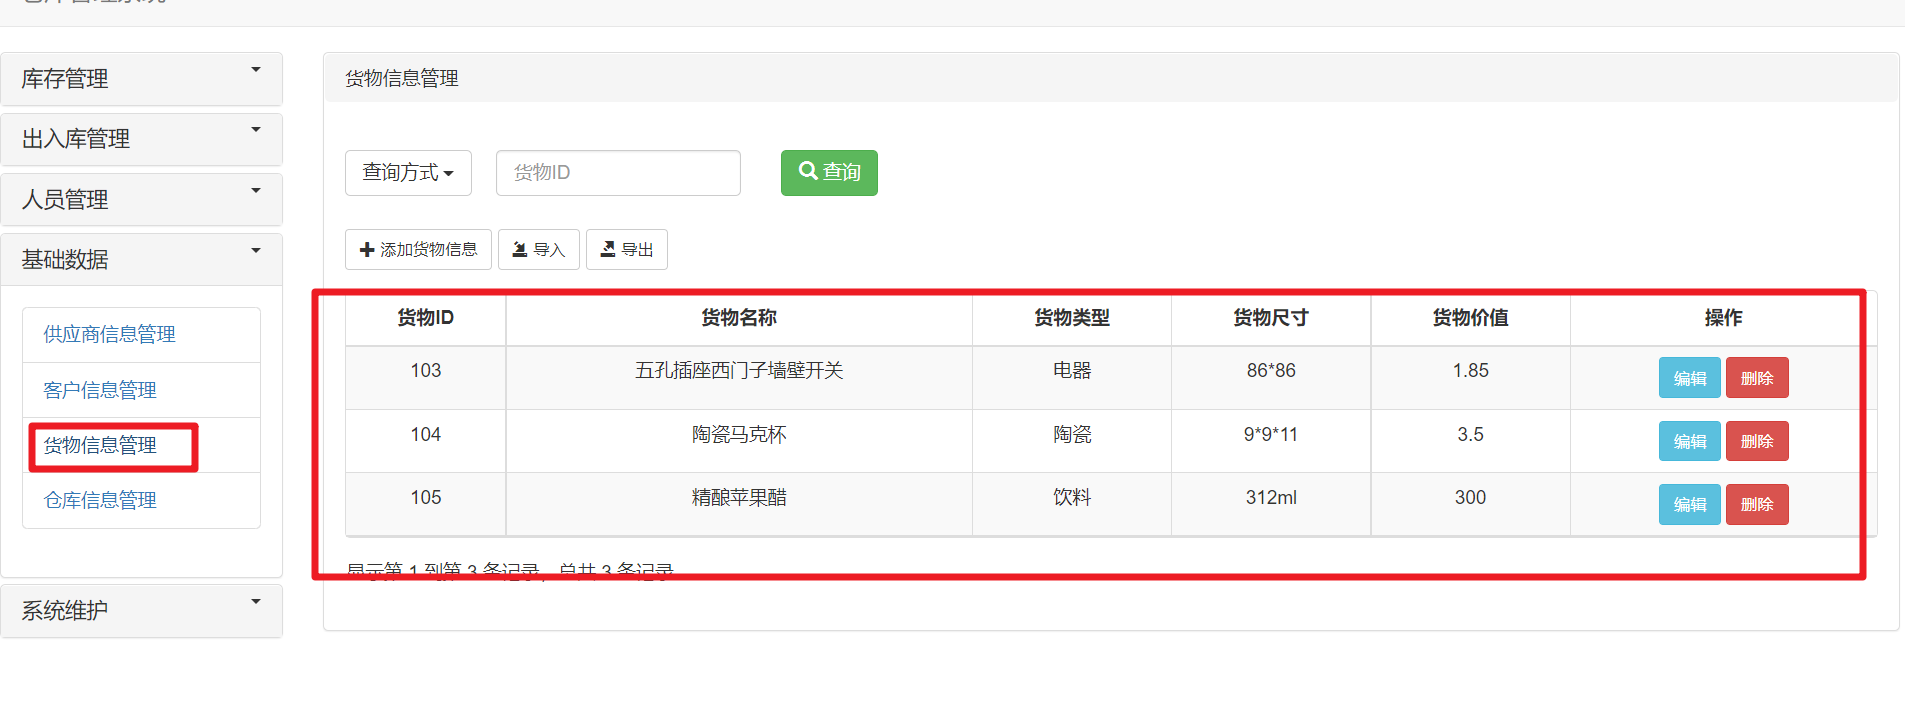
Ssm+jsp realizes the warehouse management system, and the interface is called an elegant interface

计数排序基础思路
Win11图片打不开怎么办?Win11无法打开图片的修复方法

buildroot的根文件系统提示“depmod:applt not found”

九章云极DataCanvas公司获评36氪「最受投资人关注的硬核科技企业」
Network Security Learning - Information Collection

Deeply cultivate the developer ecosystem, accelerate the innovation and development of AI industry, and Intel brings many partners together
![[team learning] [34 issues] scratch (Level 2)](/img/29/8383d753eedcffd874bc3f0194152a.jpg)
[team learning] [34 issues] scratch (Level 2)
随机推荐
Different meat customers joined hands with Dexter to launch different hamburgers in some stores across the country
Thesis landing strategy | how to get started quickly in academic thesis writing
What if win11 pictures cannot be opened? Repair method of win11 unable to open pictures
Up to 5million per person per year! Choose people instead of projects, focus on basic scientific research, and scientists dominate the "new cornerstone" funded by Tencent to start the application
True global ventures' newly established $146million follow-up fund was closed, of which the general partner subscribed $62million to invest in Web3 winners in the later stage
EasyCVR平台接入RTMP协议,接口调用提示获取录像错误该如何解决?
一图看懂!为什么学校教了你Coding但还是不会的原因...
窗口可不是什么便宜的东西
[knife-4j quickly build swagger]
System framework of PureMVC
【数模】Matlab allcycles()函数的源代码(2021a之前版本没有)
What about the collapse of win11 playing pubg? Solution to win11 Jedi survival crash
Ssm+jsp realizes the warehouse management system, and the interface is called an elegant interface
英特尔David Tuhy:英特尔傲腾技术成功的原因
Unit test asp Net MVC 4 Application - unit testing asp Net MVC 4 apps thoroughly
What is JVM? What are the purposes of JVM tuning?
SQL where multiple field filtering
【线段树实战】最近的请求次数 + 区域和检索 - 数组可修改+我的日程安排表Ⅰ/Ⅲ
Case reward: Intel brings many partners to promote the innovation and development of multi domain AI industry
每人每年最高500万经费!选人不选项目,专注基础科研,科学家主导腾讯出资的「新基石」启动申报