当前位置:网站首页>A case study of college entrance examination prediction based on multivariate time series
A case study of college entrance examination prediction based on multivariate time series
2022-07-02 17:08:00 【The way of Python data】
With the help of ARIMA Model , Through modeling and forecasting the admission rate of the college entrance examination in China in previous years , And verify and test the accuracy and feasibility of the model , To apply the model to estimate the future acceptance rate , It is further concluded that 2030 The predicted value of China's college entrance examination admission rate in .
This article is submitted by readers
Author's brief introduction : rational , A junior at Hebei University of science and technology , Focus on deep learning . Like most programmers , He is an optimist , Lots of time debugging code , Full of hope in debugging , Overcome numerous setbacks encountered .
01 Data sources
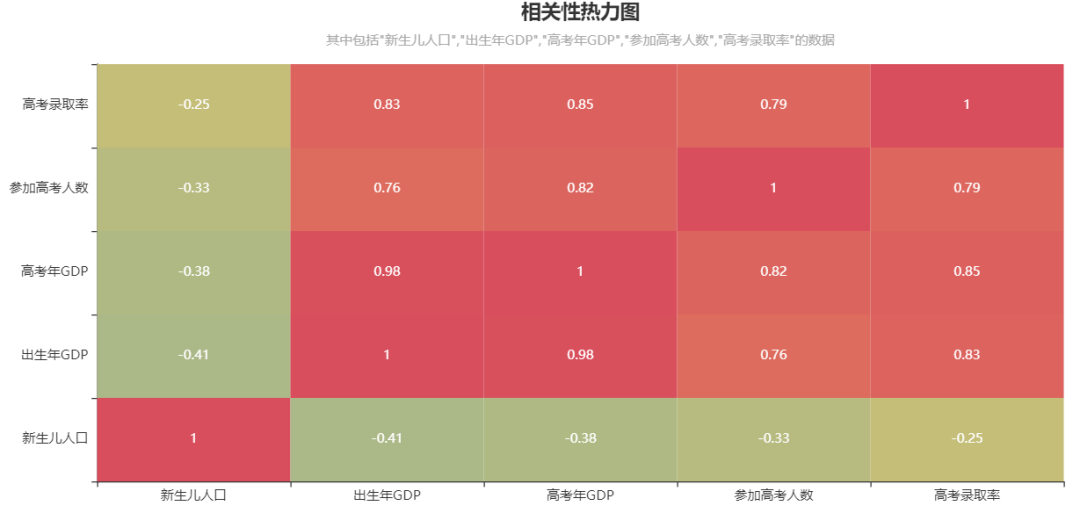
The data used in this paper are from the official website of the world bank (https://data.worldbank.org.cn/) China macroeconomic data set , The current version of the data set consists of 45 That's ok 12 Column , Provided from 1959 - 2021 In Chinese mainland 12 The position and value of each index year . The data set format adopts international common practice , Annual records include numerical records and ratio records , The record contains the time ( World time )、 Population ( ten thousand people )、 amount of money ( Billion dollars )、 Proportion and other indicators , The structure of the data set is shown in the table 1 Shown , chart 1 Painted China 1949 to 2021 Years ago 5 A thermodynamic diagram showing the closeness of the two indicators .
surface 1 World Bank data list (️ Slide to see more )| Year of birth | Kaonian | Newborn population ( Company : ten thousand people ) | University Enrollment Expansion Policy , Boolean variables ,0 It means nothing ,1 Said is | Year of birth GDP( Billion dollars ) | Kaonian GDP( Billion dollars ) | Kaonian GDP Proportion in the world (%) | The number of people taking the college entrance examination ( Company : ten thousand people ) | The number of students admitted to the college entrance examination ( Company : ten thousand people ) | Admission rate of college entrance examination | Gross enrolment ratio in Higher Education | The number of people taking the college entrance examination increased year on year |
|---|---|---|---|---|---|---|---|---|---|---|---|
| 1959 | 1977 | 1635 | 0 | 550 | 1749.4 | 2.39 | 570 | 27 | 4.74 | 1.65 | NaN |
| 1960 | 1978 | 1402 | 0 | 597.2 | 1495.4 | 1.73 | 610 | 40.2 | 6.59 | 2.87 | 0.07 |
| 1961 | 1979 | 949 | 0 | 500.6 | 1782.8 | 2.23 | 468 | 28 | 5.98 | 2.95 | -0.233 |
| 1962 | 1980 | 2451 | 0 | 472.1 | 1911.5 | 2.12 | 333 | 28 | 8.41 | 1.14 | -0.288 |
| 1963 | 1981 | 2934 | 0 | 507.1 | 1958.7 | 1.67 | 259 | 28 | 10.81 | 0.95 | -0.222 |
02 Statistical analysis
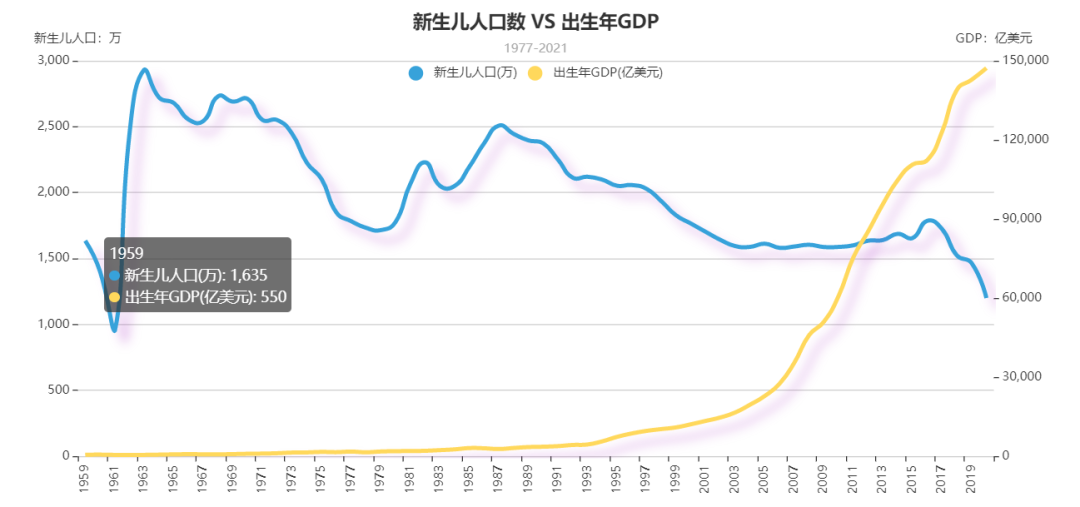
stay 1959 year ~2020 Year of 61 Year , The number of newborns fluctuates greatly ,1987 Years later, the number of newborns showed a monotonic decreasing trend , And 2016 The decline is most obvious after .
year GDP aspect , On the rise ,1993 The change is obvious after years .
Overall, the number of newborns is related to the year of birth GDP There is no obvious relationship , But there is a partial interval negative correlation (1987 After year ).
The admission rate of the college entrance examination is the same as that of that year GDP Pictured 3. Both are on the rise as a whole , It is preliminarily judged that there is a positive correlation between the two .

The number of participants in the college entrance examination and the relevant information : The number of people taking the college entrance examination is increasing year by year , However, the year-on-year growth of the number of people taking the college entrance examination fluctuates greatly , No obvious features , Pictured 4.

Observe the gross enrollment rate of higher education and the current year GDP The global share is shown in the figure 5.

Gross enrolment ratio and global GDP The proportion is on the rise , It is preliminarily judged that there is a positive correlation between the two .
03 Time series prediction of college entrance examination admission rate
Here, , We apply ARIMA Model for college entrance examination admission rate prediction . here ARIMA The model can be clicked to view the details Finally, the time series is predicted ARIMA The model makes it clear .
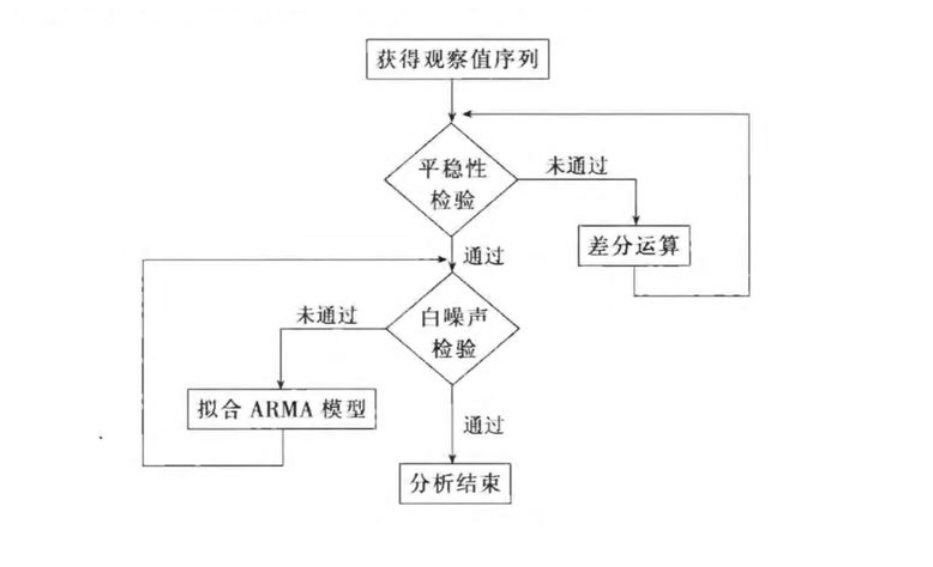
In the application ARIMA The model needs to test the stationarity and white noise of the observation sequence first , Only the stationary non white noise sequence has observation value , The detailed process includes :
3.1
Sequence diagram and autocorrelation diagram of original data of target data
import matplotlib.pyplot as plt
#  Identify target data
tag = data[' Admission rate of college entrance examination ']
from statsmodels.graphics.tsaplots import plot_acf
from statsmodels.graphics.tsaplots import plot_pacf
fig = plt.figure(figsize=(12,4))
ax1 = fig.add_subplot(121)
tag.plot()
plt.title('Sequence diagram')
ax2 = fig.add_subplot(122)
plot_acf(tag,ax=ax2) #  Autocorrelation diagram
plt.show()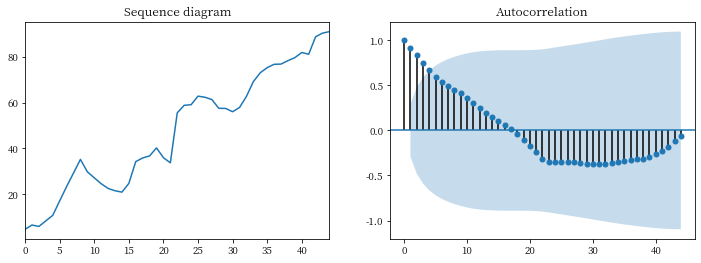
Observe the sequence diagram :
Because the sequence has obvious monotonic increasing trend , It is preliminarily judged to be a non-stationary sequence , And the autocorrelation diagram shows that the autocorrelation coefficient is greater than for a long time 0, It shows that there is a strong long-term correlation between sequences .
Combined with the above process , It is necessary to test the stationarity of the sequence first .
3.2 ADF test ( Unit root test )
#  Stability detection
from statsmodels.tsa.stattools import adfuller as ADF
ADF(tag)
(-0.5482617125015317,
0.882249553115714,
0,
44,
{'1%': -3.5885733964124715,
'5%': -2.929885661157025,
'10%': -2.6031845661157025},
203.98252176030874)Observations ,P The value is 0.882249553115714, Significantly greater than 0.05.
Finally, the sequence is judged as non-stationary sequence .
Because the final judgment of the sequence is non-stationary sequence , Therefore, it is necessary to perform differential processing .
3.3 Differential processing
tag_diff = tag.diff().dropna()
tag_diff.plot()
plt.title('First order sequence diagram')
plt.show()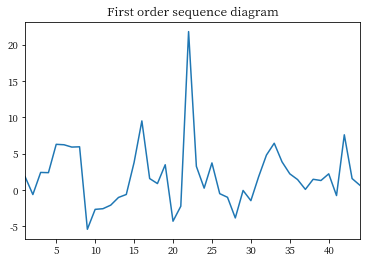
As can be seen from the above figure , The data increase and decrease trend after the first-order difference is relatively stable . But according to the principle of optimization and accuracy , Second order difference processing is required .
##  Second order
tag_diff2 = tag_diff.diff().dropna()
tag_diff2.plot()
plt.title('Second order sequence diagram')
plt.show()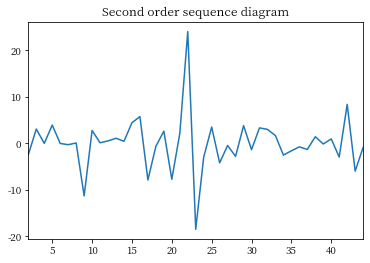
In theory, , The multi-stage difference can better eliminate the uncertain factors in the sequence ,
But the difference will also make the original sequence lose some data , So the order of the difference should be appropriate .
In this paper , After the second-order difference , The sequence trend is relatively stable , Next, draw and analyze the autocorrelation and partial autocorrelation graph of the second-order difference sequence .
#  Partial autocorrelation
fig = plt.figure(figsize=(12,4))
ax1 = fig.add_subplot(121)
plot_acf(tag_diff,ax=ax1)
ax2 = fig.add_subplot(122)
plot_pacf(tag_diff,ax=ax2)
plt.show()
ADF(tag_diff2)(-7.7836768644929695,
8.2881029271227e-12,
1,
41,
{'1%': -3.60098336718852,
'5%': -2.9351348158036012,
'10%': -2.6059629803688282},
202.9415785772855)Observe the results of the two figures ,
Results show , The autocorrelation graph of the sequence after the second-order difference has a strong short-term correlation , And ADF Testing p The value is 8.2881029271227e-12, Significantly less than 0.05, So the second-order difference sequence is a stationary sequence .
Combined with flow chart , White noise test shall be conducted after the stability test . For white noise, please refer to : How to detect random walk and white noise in time series prediction
3.4 White noise test
The inspection results are as follows
#  White noise test
from statsmodels.stats.diagnostic import acorr_ljungbox
acorr_ljungbox(tag_diff2,lags=[6,12,24])
(array([14.16785, 16.24145, 22.69118]),
array([0.02781, 0.18042, 0.53808]))lbvalue: QLB Test statistic
pvalue: QLB Corresponding to the test statistic P value At this point to see P value , That is, the second row of data ( Each column is delay 6、12、24 The test result of step time ):
When lags=6 when , That's delay 6 Step time P The value is 0.02781636 < 0.05, At this time, it can be judged that the sequence is a non white noise sequence , Of observational value .
3.5 application ARIMA Model
from statsmodels.tsa.arima_model import ARIMA
#  Generally, the order does not exceed length/10
pmax = int(len(tag_diff)/10)
qmax = int(len(tag_diff)/10)
bic_matrix = []

for p in range(pmax+1):
   tmp = []

for q in range(qmax+1):
   try:
       tmp.append(ARIMA(tag, (p,1,q)).fit().bic)
   except:
       tmp.append(None)
   bic_matrix.append(tmp)
bic_matrix = pd.DataFrame(bic_matrix)
p,q = bic_matrix.stack().idxmin()  ##  Get the minimum p、q value
##  Due to the second-order difference of the original view data , So here's d The value is  2
model = ARIMA(tag, (p,2,q)).fit()
model.summary2()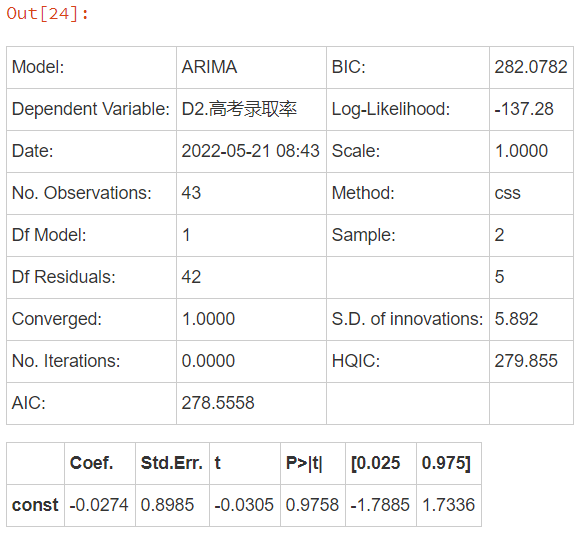
forecast 2030 The college entrance examination admission rate in
print(' forecast 2030 The college entrance examination admission rate in is  ' +
      str(model.forecast(9)[0][-1]) + '%')
forecast 2030 The college entrance examination admission rate in is 95.79511627906977%print(' forecast 2030 The college entrance examination admission rate in is ' +
str(model.forecast(9)[0][-1]) + '%') forecast 2050 The college entrance examination admission rate in is 98.79511627906977%04 Conclusion
ARIMA It is a very popular time series statistical method , It is a differential integration moving average autoregressive model , They are autoregressive (AR) Term refers to lag of the difference sequence , Moving average (MA) Term refers to lag of the error , and I Is the difference fraction used to make the time series stable , Describes the correlation of data points , And consider the difference between the values .
With the help of ARIMA Model , Through modeling and forecasting the admission rate of the college entrance examination in China in previous years , And verify and test the accuracy and feasibility of the model , To apply the model to estimate the future acceptance rate , It is further concluded that 2030 The predicted value of China's college entrance examination admission rate in is 95.795%.( For reference only )
Using the differential integration moving average autoregressive model to mine the key factors that affect the college entrance examination admission rate , However, the differential integration moving average autoregressive model needs the correlation between each index and the college entrance examination , Therefore, the correlation coefficient R The nature of , Get the correlation of each index , establish ARIMA The model needs to test the stationarity and white noise of the observation sequence , Only the stationary non white noise sequence has observation value , Finally, the college entrance examination admission rate is predicted .
边栏推荐
- Understand one article: four types of data index system
- Go zero micro service practical series (VIII. How to handle tens of thousands of order requests per second)
- 移动应用性能工具探索之路
- LeetCode 3. Longest substring without duplicate characters
- 【Leetcode】14. Longest Common Prefix
- Green bamboo biological sprint Hong Kong stocks: loss of more than 500million during the year, tiger medicine and Beijing Yizhuang are shareholders
- 剑指 Offer 21. 调整数组顺序使奇数位于偶数前面
- What will you do after digital IC Verification?
- In MySQL and Oracle, the boundary and range of between and precautions when querying the date
- Penetration tool - intranet permission maintenance -cobalt strike
猜你喜欢

一文看懂:数据指标体系的4大类型
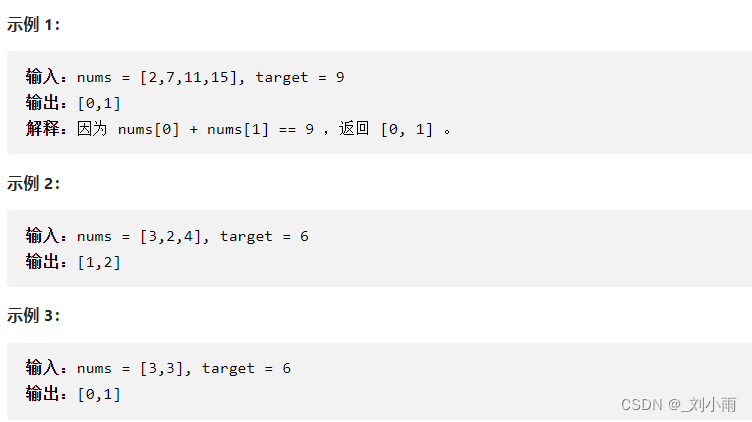
LeetCode 1. Sum of two numbers

Tech Talk 活动预告 | 基于Amazon KVS打造智能视觉产品

Connect Porsche and 3PL EDI cases

使用知行之桥的API端口,提供资源供合作伙伴访问
几行代码搞定RPC服务注册和发现
剑指 Offer 22. 链表中倒数第k个节点

上传代码到远程仓库报错error: remote origin already exists.

寒门再出贵子:江西穷县考出了省状元,做对了什么?
Believe in yourself and finish the JVM interview this time
随机推荐
John blasting appears using default input encoding: UTF-8 loaded 1 password hash (bcrypt [blowfish 32/64 x3])
伟立控股港交所上市:市值5亿港元 为湖北贡献一个IPO
Detailed explanation of @accessories annotation of Lombok plug-in
Dgraph: large scale dynamic graph dataset
pwm呼吸灯
Talk about an experience of job hopping and being rejected
linux安装postgresql + patroni 集群问题
数字IC手撕代码--投票表决器
A few lines of code to complete RPC service registration and discovery
Masa framework - DDD design (1)
871. 最低加油次数
Geoserver: publishing PostGIS data sources
The computer comes with software to make the background color of the picture transparent (matting white background)
Amazon cloud technology community builder application window opens
The poor family once again gave birth to a noble son: Jiangxi poor county got the provincial number one, what did you do right?
基于多元时间序列对高考预测分析案例
2322. 从树中删除边的最小分数(异或和&模拟)
如何与博格华纳BorgWarner通过EDI传输业务数据?
国内比较好的OJ平台[通俗易懂]
社交元宇宙平台Soul冲刺港股:年营收12.8亿 腾讯是股东