当前位置:网站首页>[Presto profile series] timeline use
[Presto profile series] timeline use
2022-07-07 13:09:00 【skyyws】
We are Presto page , Can pass “Splits” Tab view the entire query Timeline Information , As shown below :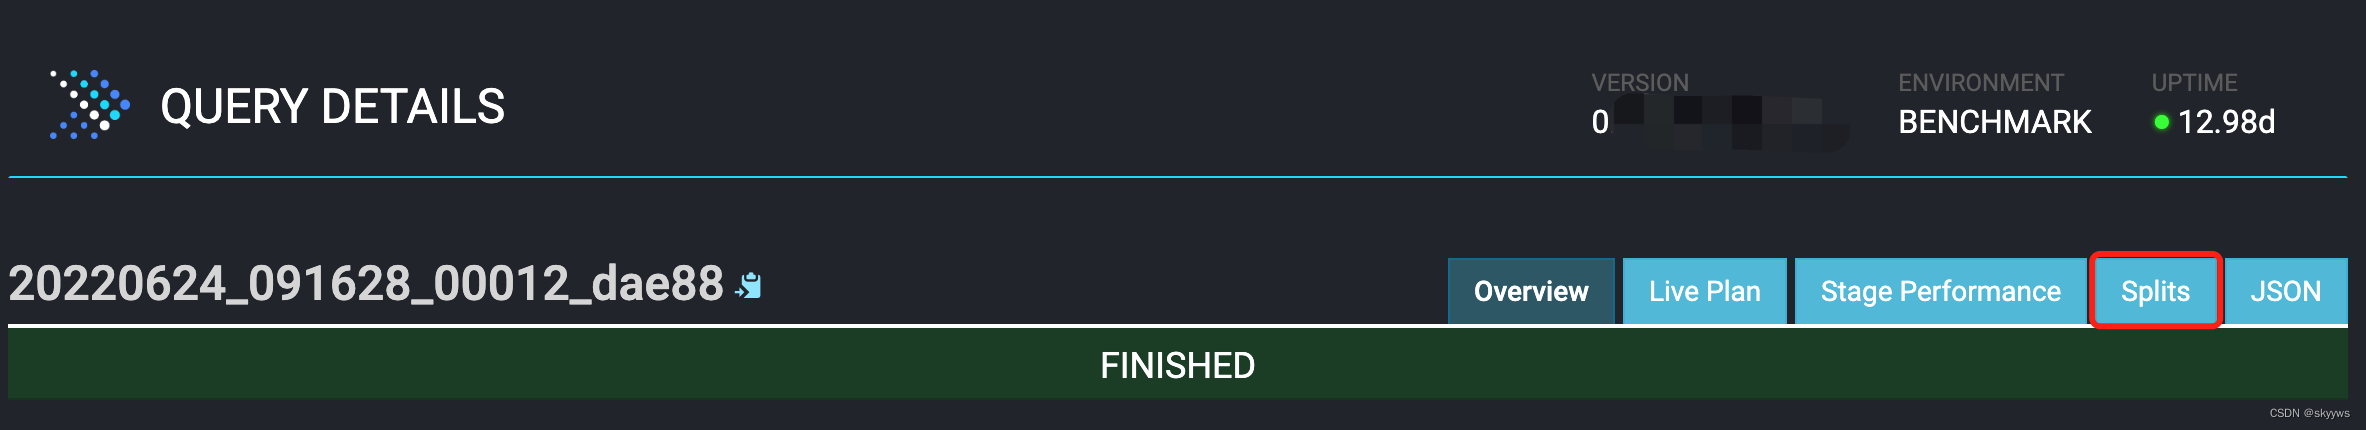
this paper , Let's look at this from the code level Timeline Related content of , And how we can use it to check the bottleneck of a query .
One 、 Code research
Simply speaking , above Timeline The show is stage And task Relevant information . Here we first look at each task Of taskId Information .
1.1 TaskId
We can directly expand a stage, Then you can see the stage All under task Information , As shown below :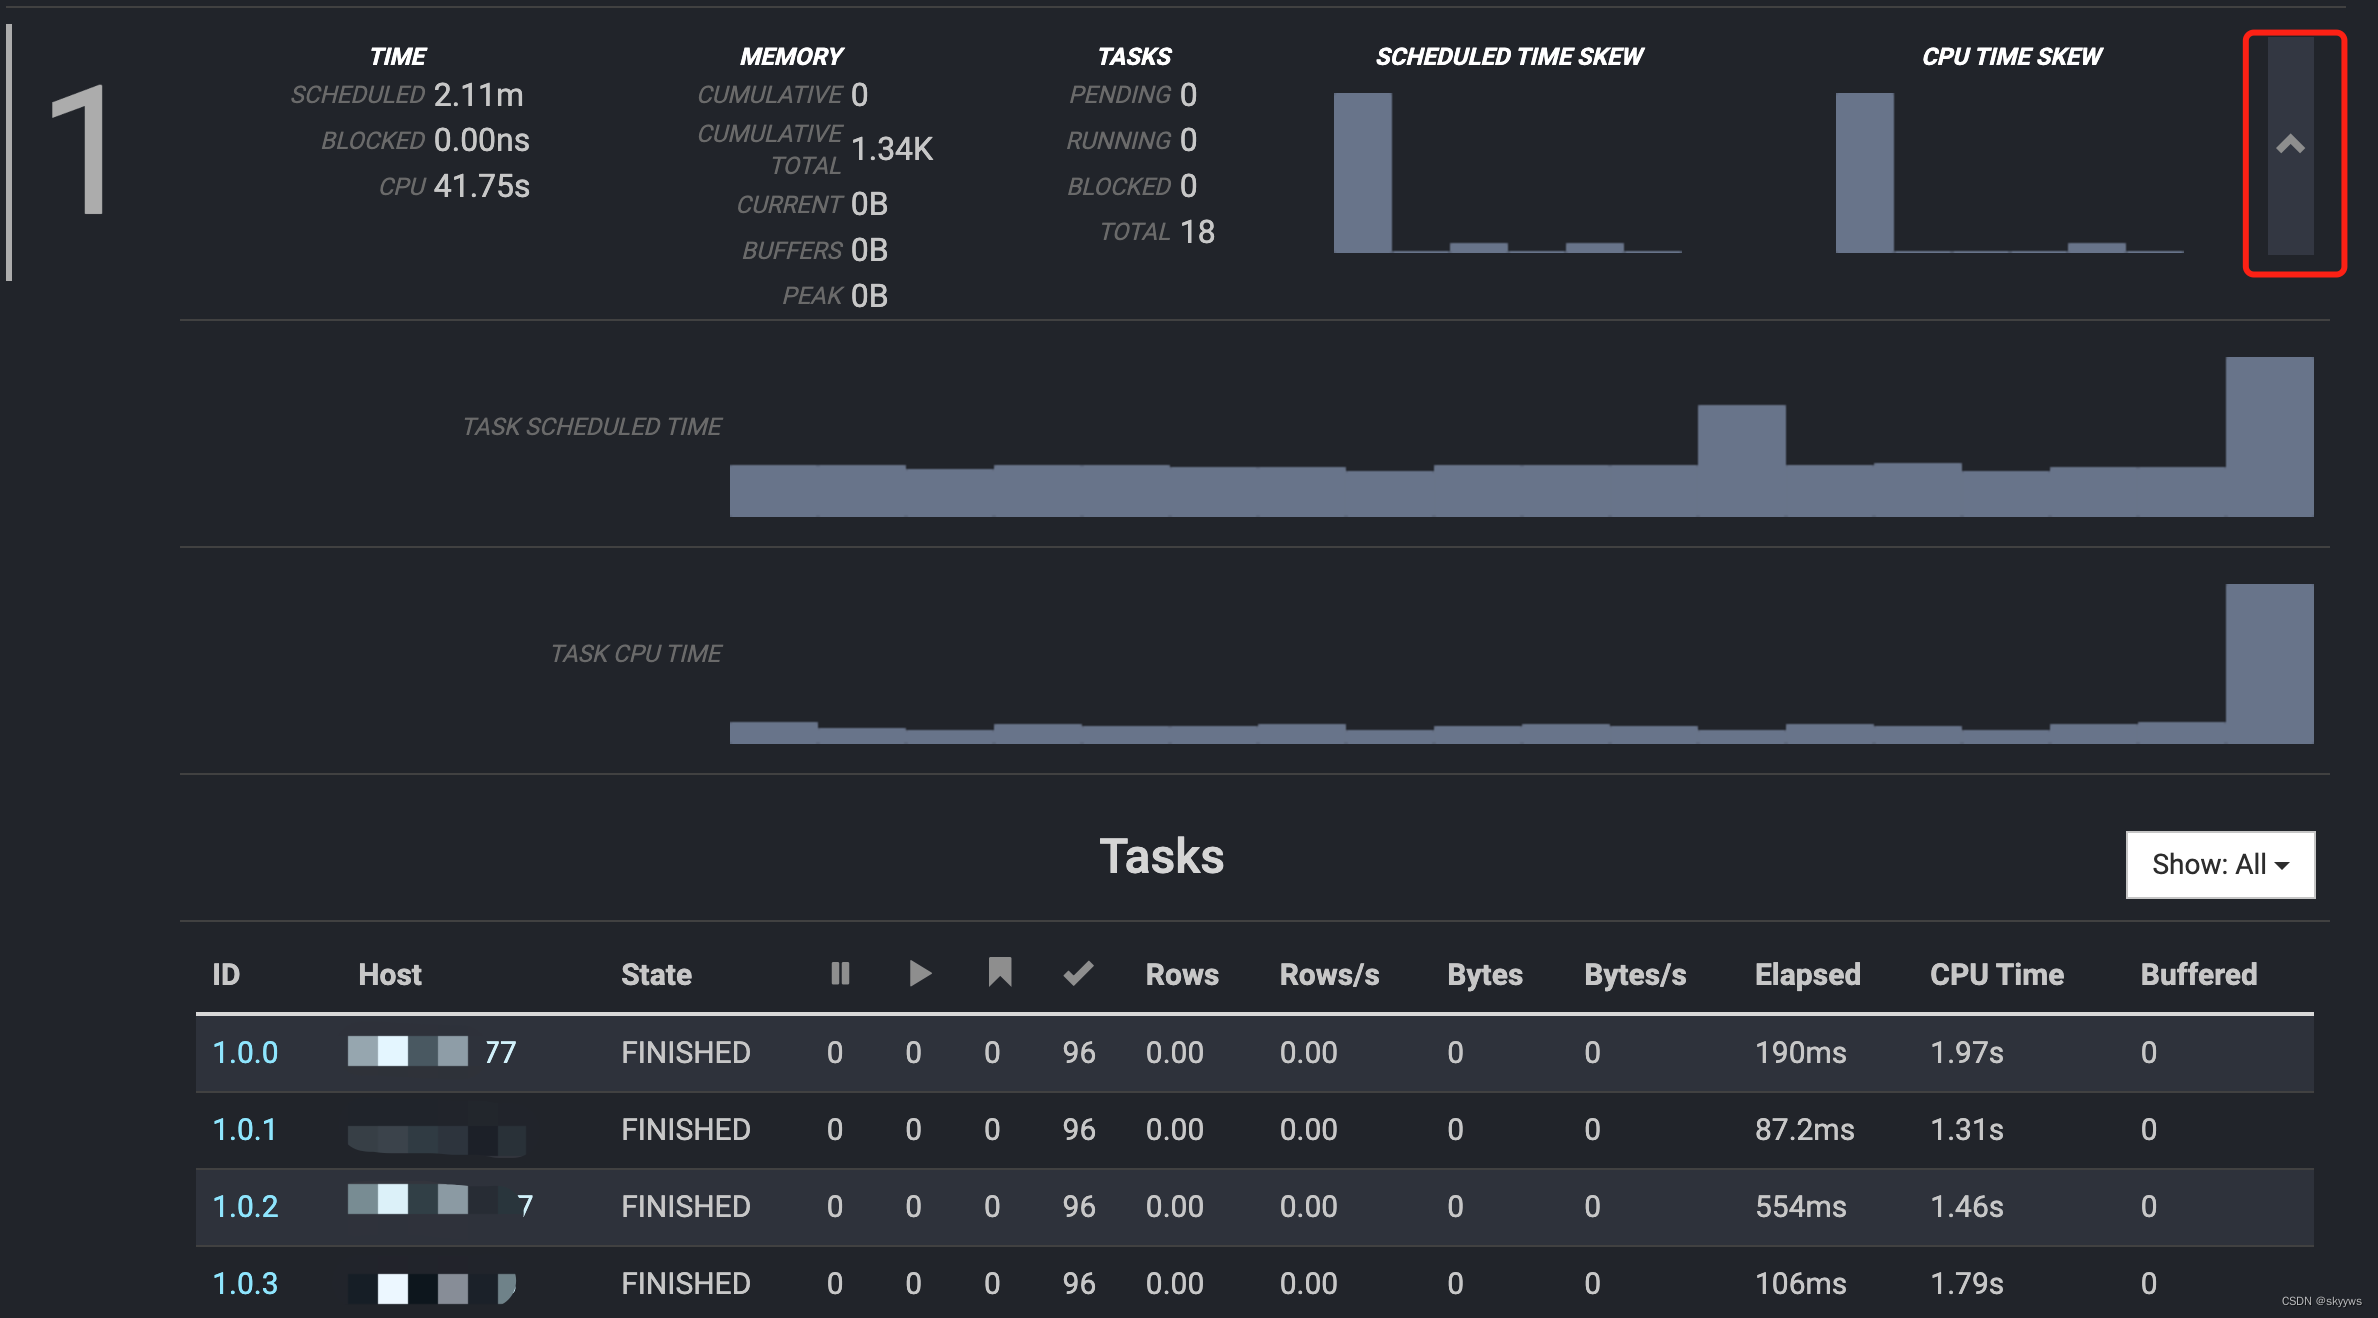
Every task They all have one of their own ID, for example 1.0.2, This is taskId, It mainly consists of two parts :
//SqlStageExecution.java
TaskId taskId = new TaskId(stateMachine.getStageExecutionId(), nextTaskId.getAndIncrement());

SqlStageExecution
-StageExecutionStateMachine stateMachine
--StageExecutionId stageExecutionId
---StageId stageId
---int id
For the top 1.0.2, among stageExecutionId yes 1.0, and nextTaskId yes 2. about stageExecutionId for , among 1 Namely stageId, and 0 It is id.StageExecutionId The relevant code is as follows :
//LegacySqlQueryScheduler.java
List<StageExecutionAndScheduler> sectionStages =
        sectionExecutionFactory.createSectionExecutions(
                session,
                section,
                locationsConsumer,
                bucketToPartition,
                outputBuffers,
                summarizeTaskInfo,
                remoteTaskFactory,
                splitSourceFactory,
                0).getSectionStages();

//SectionExecutionFactory.java
SqlStageExecution stageExecution = createSqlStageExecution(
        new StageExecutionId(stageId, attemptId),
You can see , This id It's a attemptId, The default is 0 At the beginning , Here we temporarily think that this value is 0, The relevant code is no longer expanded in depth .
1.2 Timeline Related members
Timeline The page is mainly composed of js To construct the generated , The relevant code is as follows :
//timeline.html
function renderTimeline(data) {
    function getTasks(stage) {
        return [].concat.apply(
                stage.latestAttemptExecutionInfo.tasks,
                stage.subStages.map(getTasks));
    }
    tasks = getTasks(data.outputStage);
    tasks = tasks.map(function(task) {
        return {
            taskId: task.taskId.substring(task.taskId.indexOf('.') + 1),
            time: {
                create: task.stats.createTime,
                firstStart: task.stats.firstStartTime,
                lastStart: task.stats.lastStartTime,
                lastEnd: task.stats.lastEndTime,
                end: task.stats.endTime,
            },
        };
    });
And each of these variables corresponds to Java Class is as follows :
// As a whole Timeline Input content of
QueryInfo data
-Optional<StageInfo> outputStage
// The final traversal processes each TaskInfo
StageInfo stage
-StageExecutionInfo latestAttemptExecutionInfo
--List<TaskInfo> tasks
// Loop processing outputStage Of subStages Each of the <StageInfo
-List<StageInfo> subStages
// Mainly get taskId Grouping 、 Sort ,stats Some of them time Variables to timeline Exhibition
TaskInfo task
-TaskStats stats
1.3 Timeline Stage
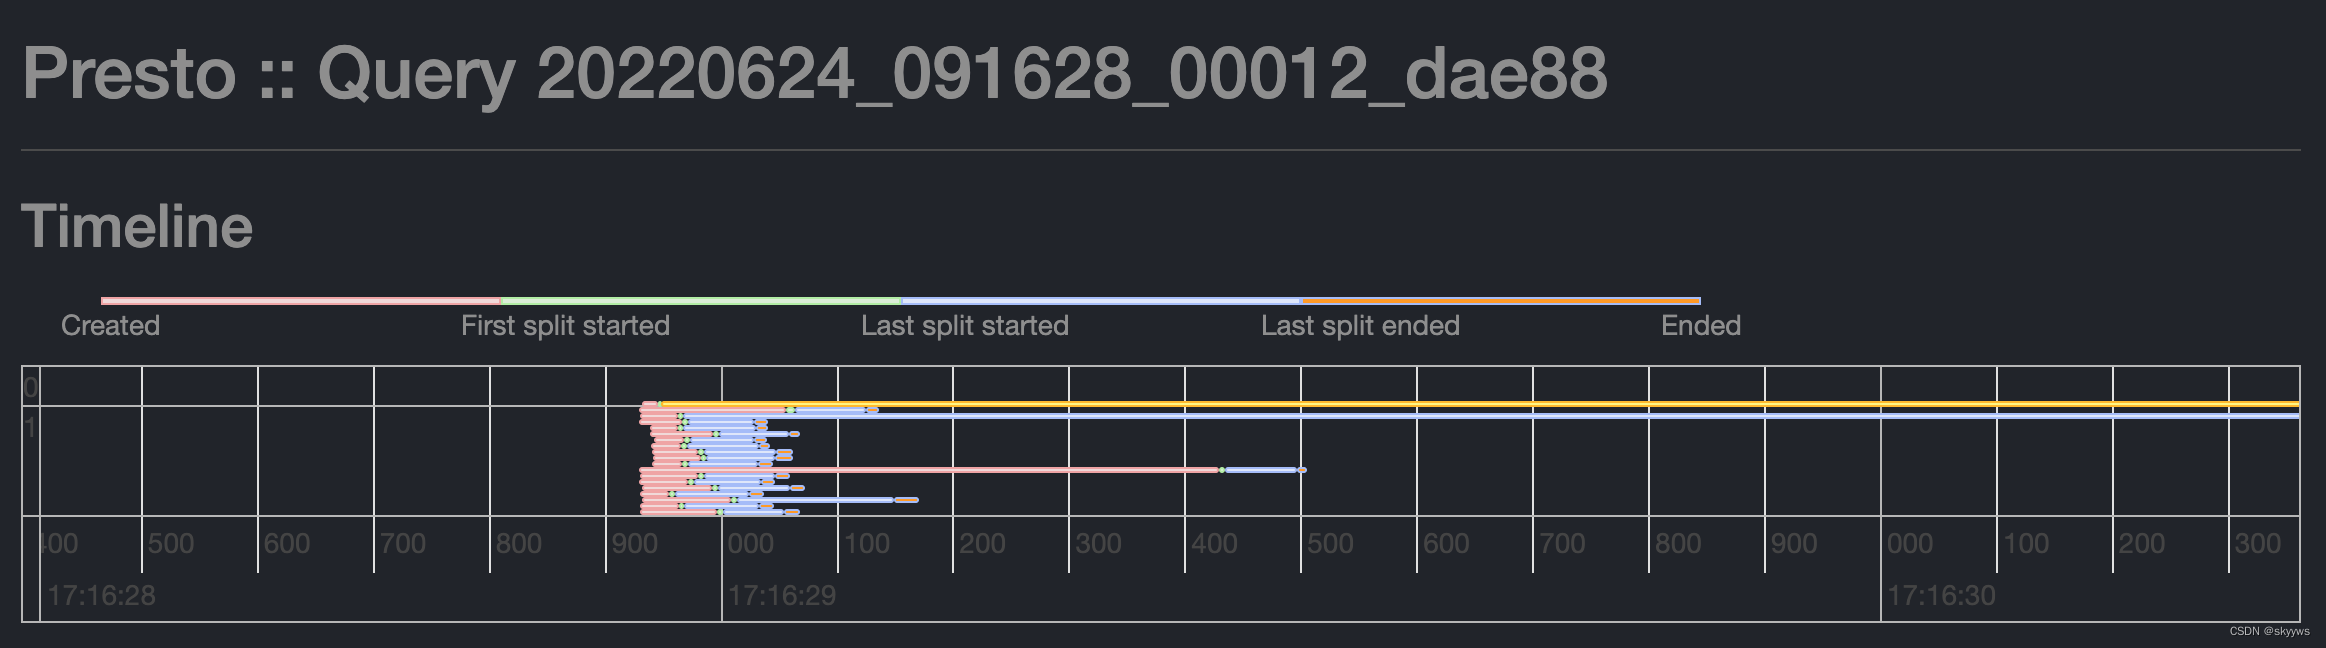
Introducing Timeline Before the construction of , Have a look first timeline Several nodes of , Here we mainly get each task Five stage time points , As shown below :
- Created
- First split started
- Last split started
- Last split ended
- Ended
From the last time point , Between this point in time , Identify with a color , As a stage . There are four stages , As shown below :
- Created -> First split started:red
- First split started -> Last split started:green
- Last split started -> Last split ended:blue
- Last split ended -> Ended:orange
1.4 Timeline structure
The server will use the above variables , And then through js Script to construct the corresponding variables , For page display , The relevant code is as follows :
//renderTimeline(timeline.html)
    var groups = new vis.DataSet();
    var items = new vis.DataSet();
    for (var i = 0; i < tasks.length; i++) {
        var task = tasks[i];
        var stageId = task.taskId.substr(0, task.taskId.indexOf("."));
        var taskNumber = task.taskId.substr(task.taskId.indexOf(".") + 1);
        if (taskNumber == 0) {
            groups.add({
                id: stageId,
                content: stageId,
                sort: stageId,
                subgroupOrder: 'sort',
            });
        }
The first is to get stageId and taskNumber. For example, for 1.0.2, The difference is 1 and 0.2. Handle stage One of the first task when , will stage Information , Add to groups in . Then start to deal with this task All stages of , Take the first stage as an example :
items.add({
    group: stageId,
    start: task.time.create,
    end: task.time.firstStart,
    className: 'red',
    subgroup: taskNumber,
    sort: -taskNumber,
});
The statistics here are task from create To the first split start Time for , And expressed in red . After traversal , be-all task Will be processed and put into items in . So let's see groups and items The specific contents of the two members .
1.4.1 groups member
By directly checking js debug , You can see that groups The content of , As shown below :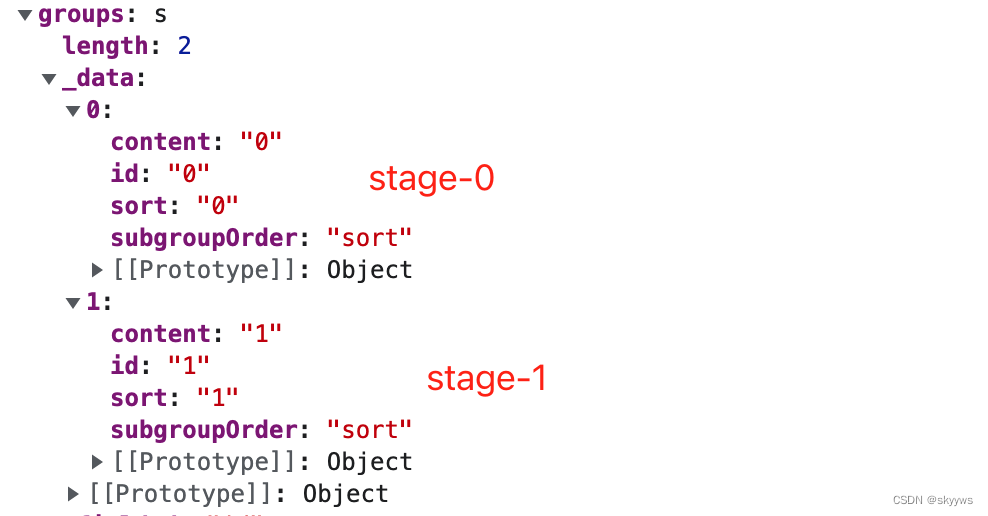
Thus we can see that , This groups The members of are the corresponding stage Of id Information .
1.4.2 items member
By directly checking js debug , You can also see items Information about , As shown below :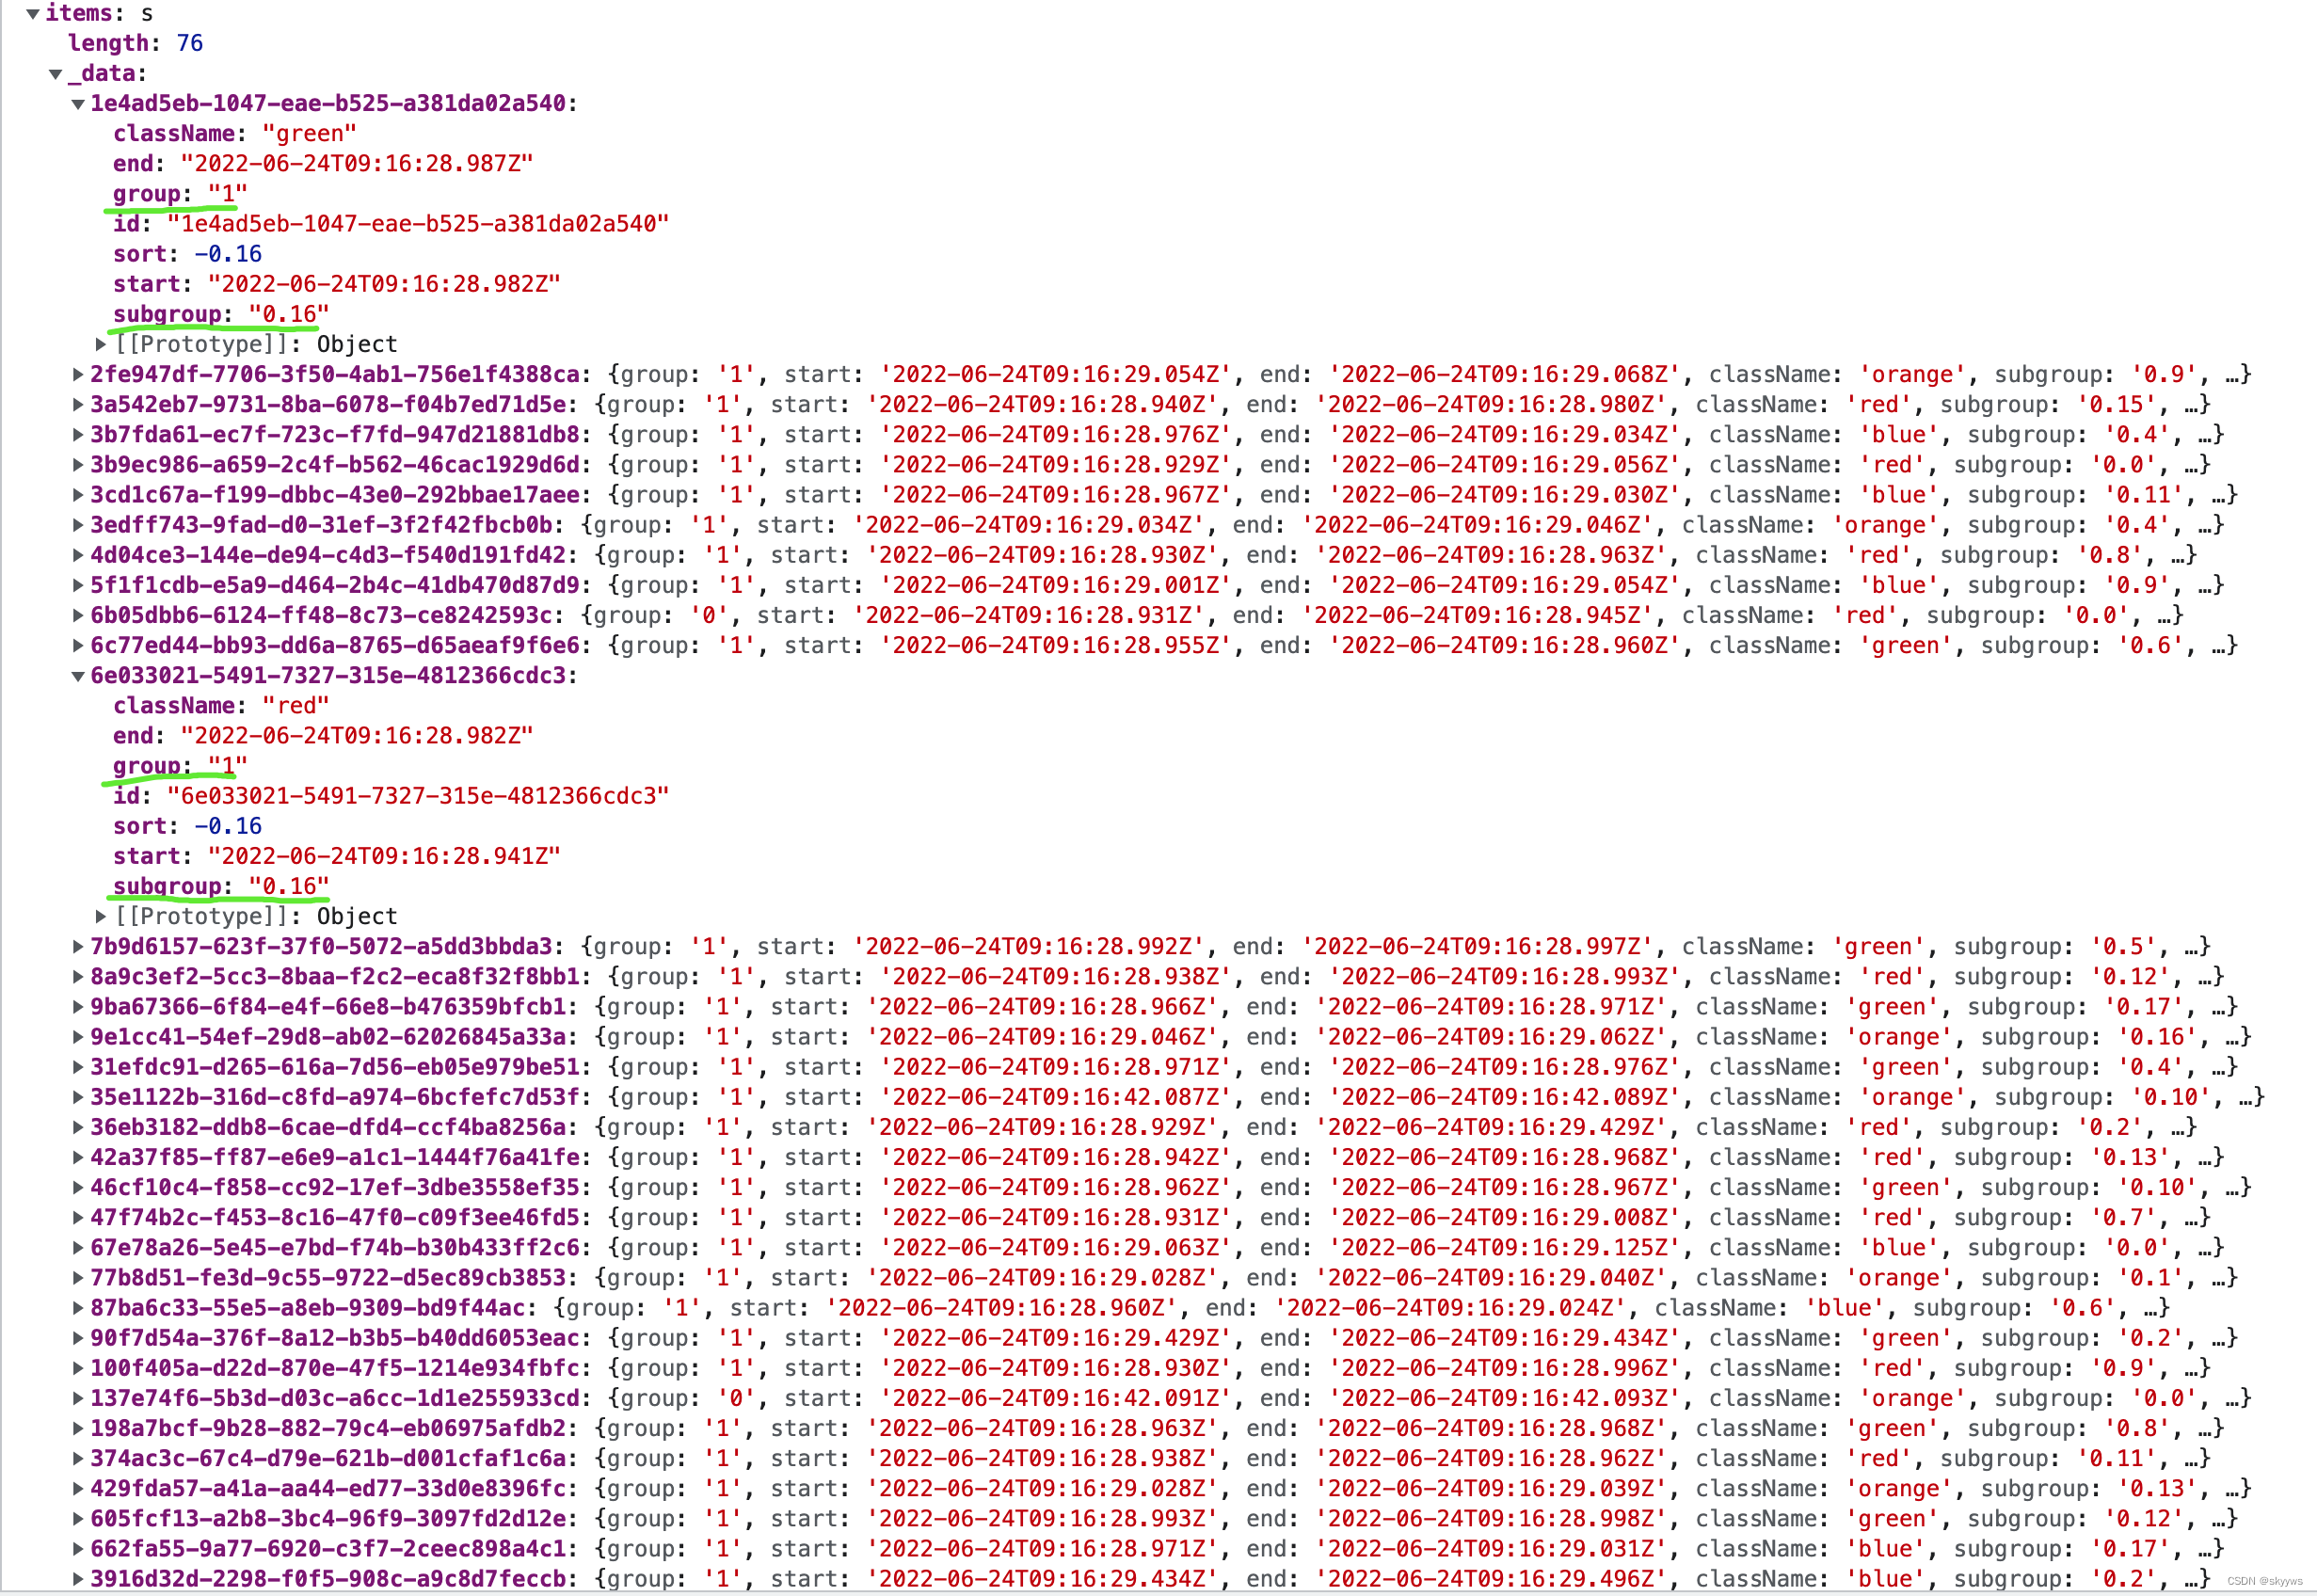
You can see , Every task Each stage of corresponds to a member , for example task 1.0.16, It contains four members , namely group yes 1,subgroup yes 0.16, The corresponding difference is stageId and taskNumber, Of these members className Different , That is, different stages , and sort It is -0.16, Corresponding to the code above -taskNumber.
Two 、Timeline Related information
Introduction after Timeline After the specific content and code implementation , Simply look at this timeline Get what information .
2.1 Check the start and end times
First , You can zoom , To view the overview of the entire implementation plan :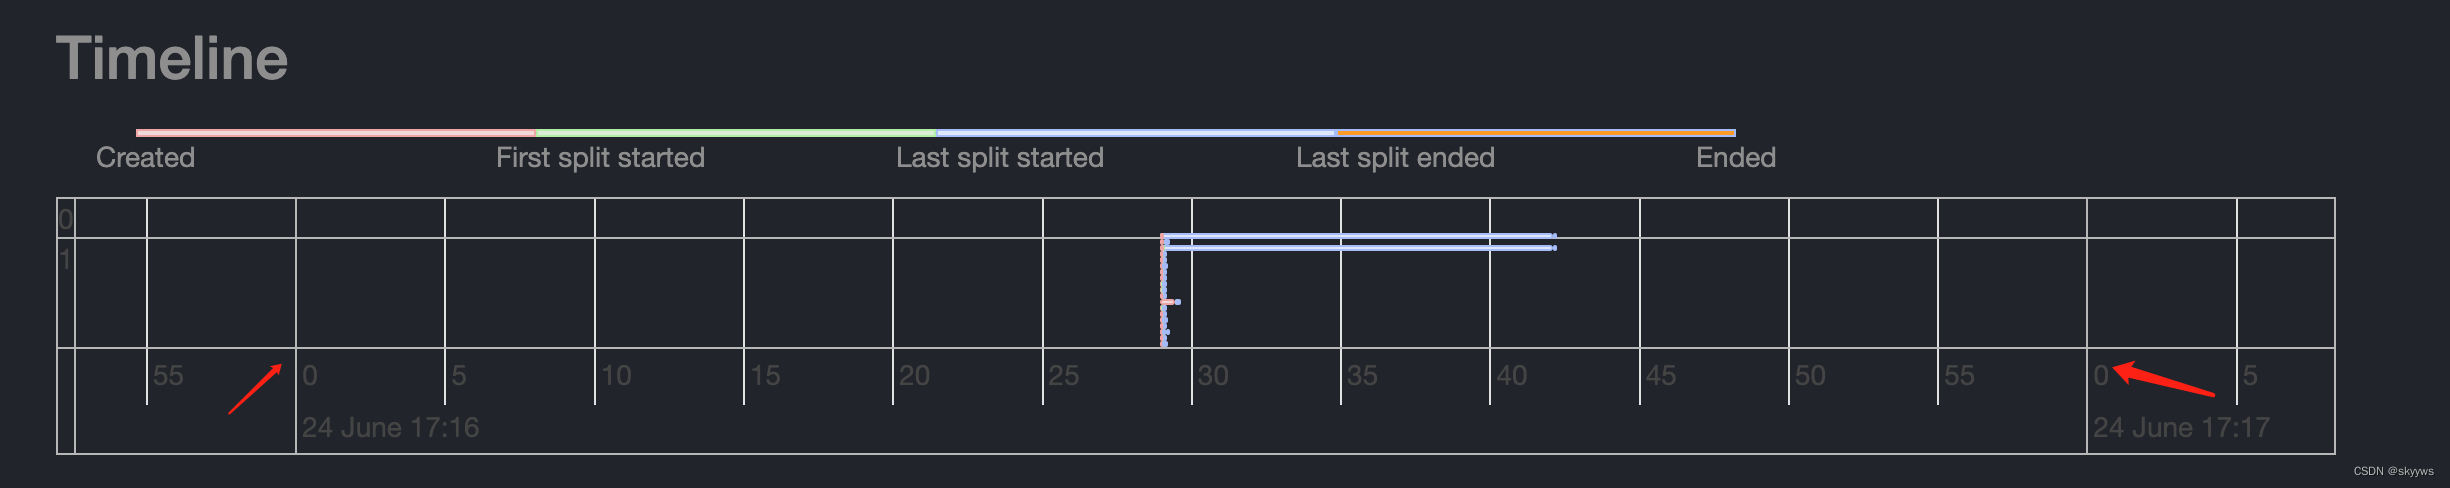
here , Each box represents 5s, Therefore, the time range of the whole query is about :6.24 17:16:25-6.24 17:16:45. If we zoom in again , You can see that :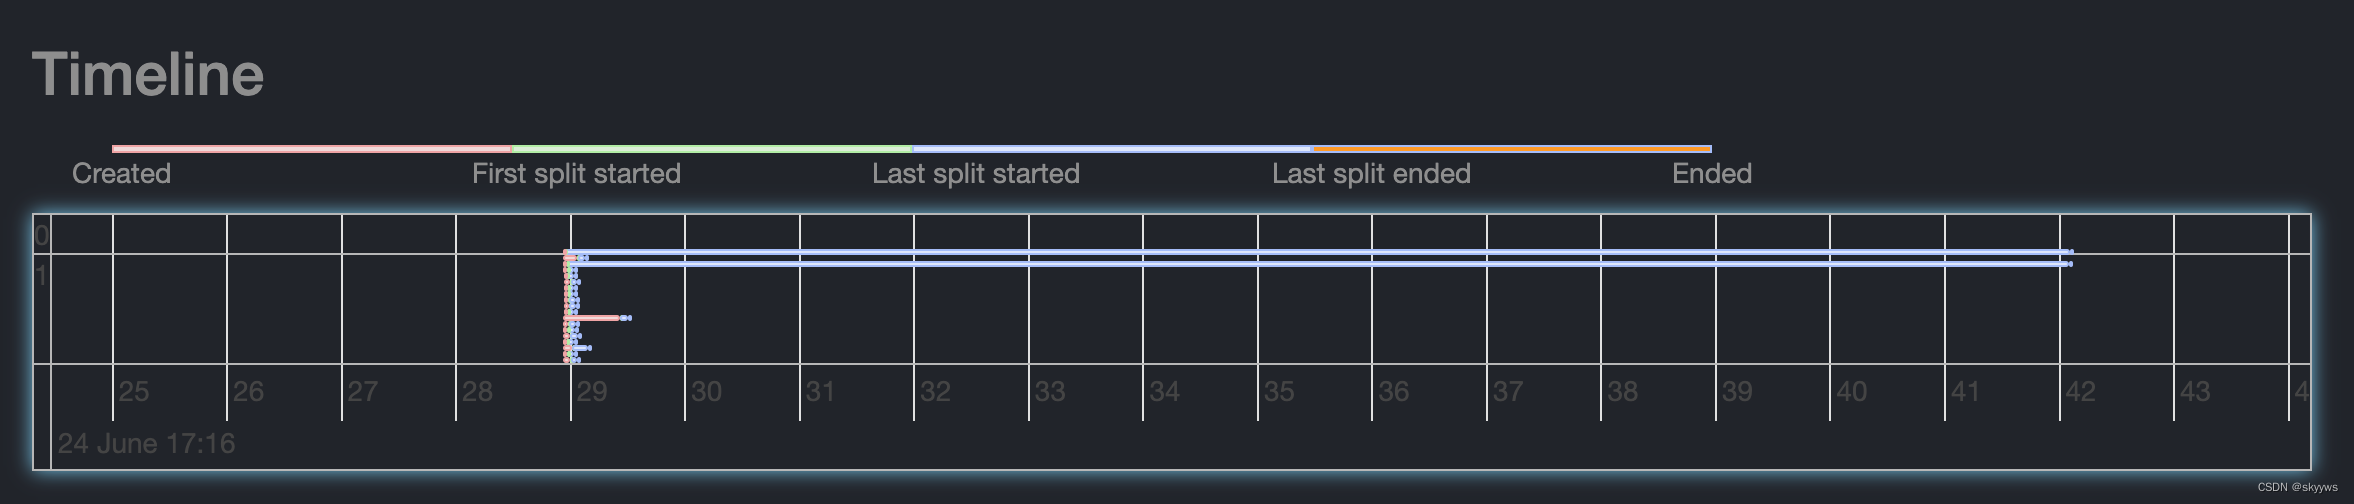
The more precise time interval is :6.24 17:16:28-6.24 17:16:43. Keep zooming in , Then double-click the mouse , Drag the whole timeline, You can see more accurate time :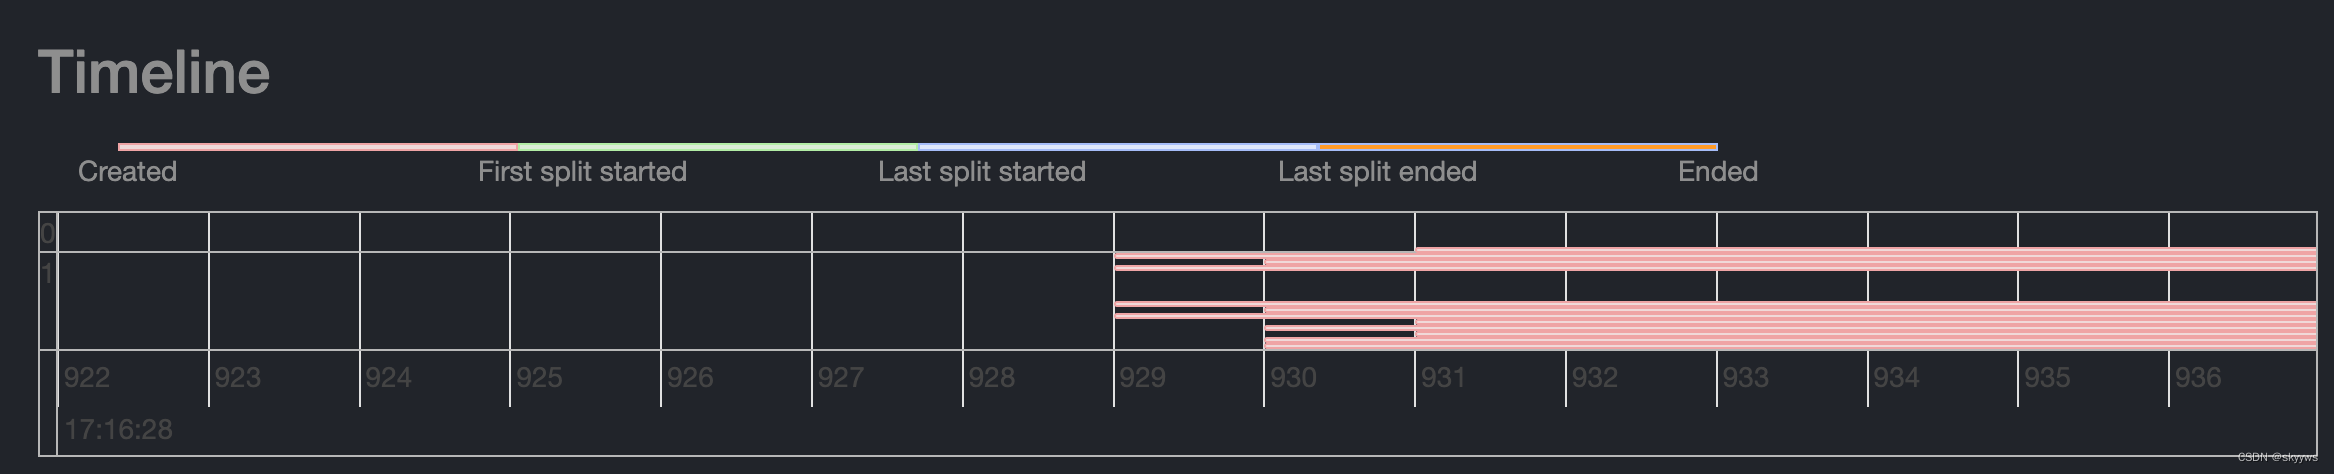
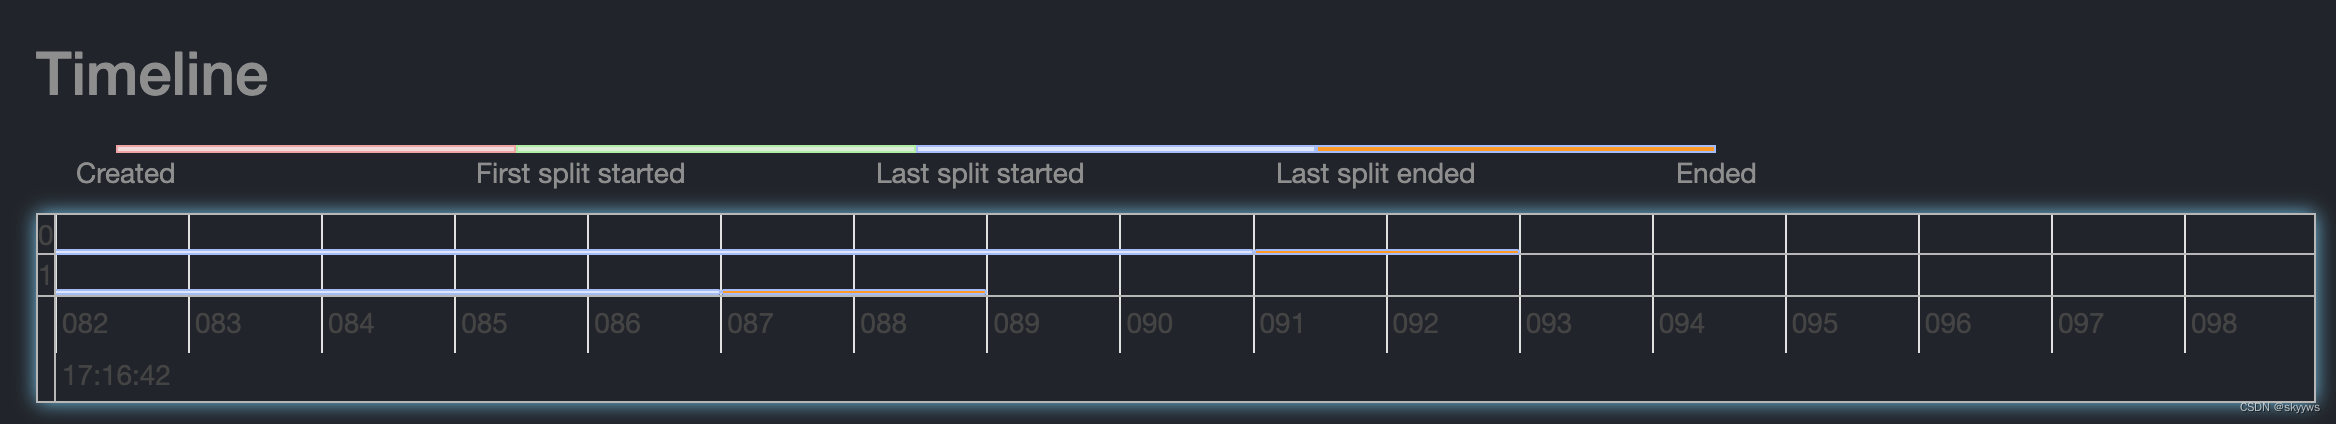
Now you can see that , The starting time is :6.24 17:16:28.929, And the end time is :6.24 17:16:42.093, So the duration of the whole query is about 13.164s, And overview Is basically the same as :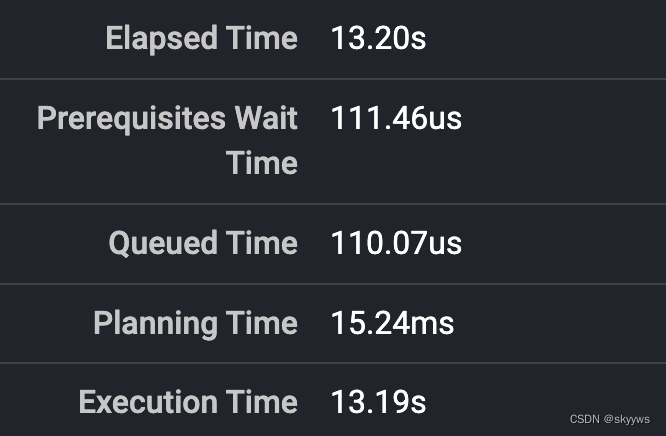
2.2 see Stage grouping
The second important function , It's about looking at stage Information .Timeline Each line inside represents a task, I'll talk about it in detail . First of all task according to stage Group sort , The order is according to stageId On going . We can see through the vertical coordinates stage Information :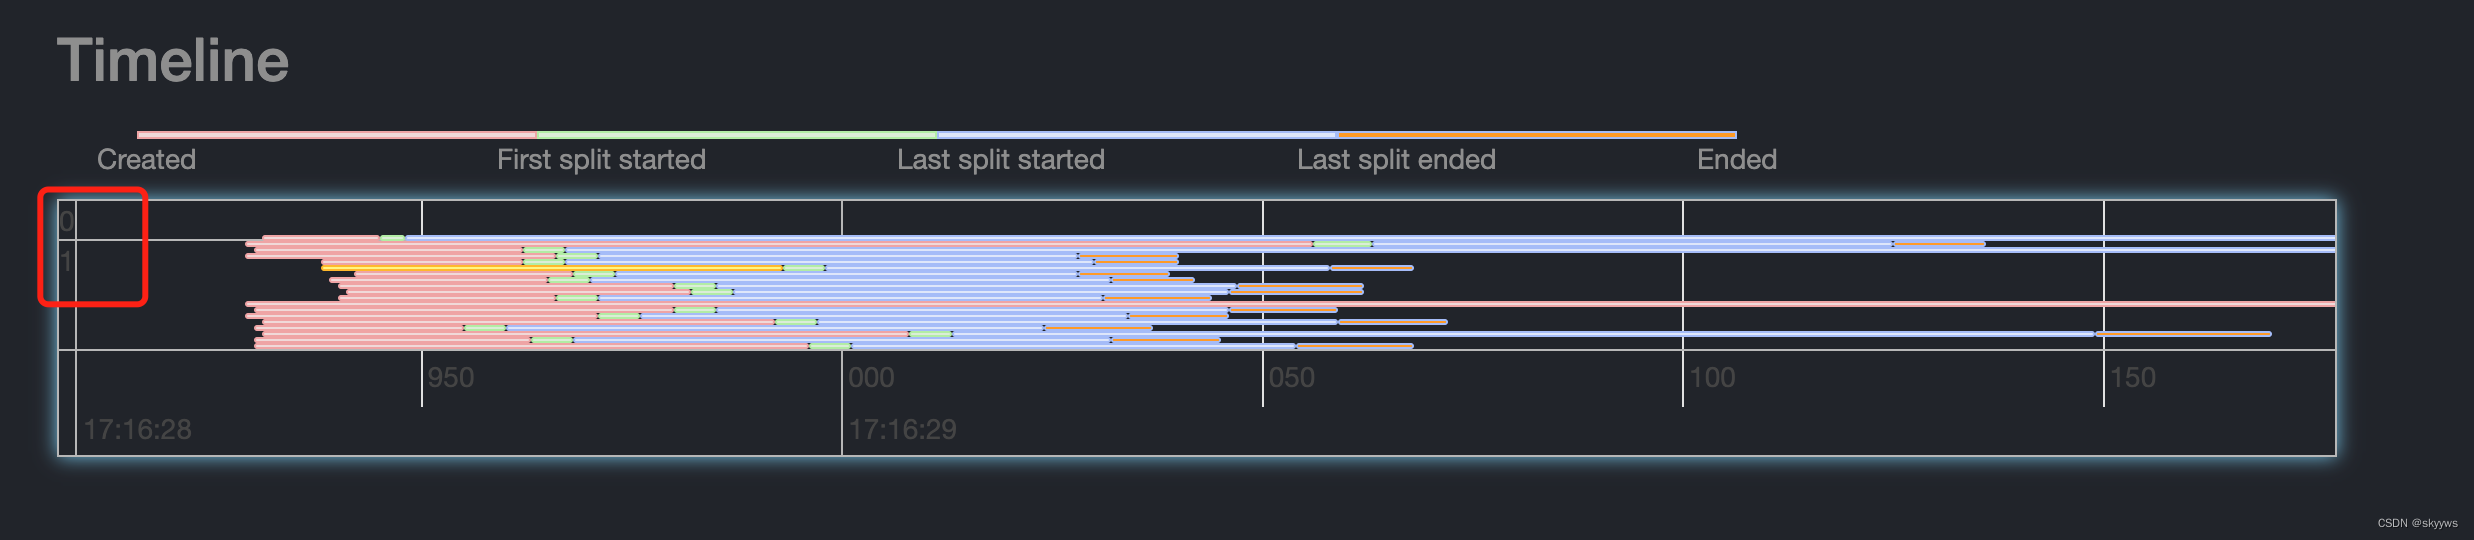
You can see , above timeline There are two stage, Namely 0 and 1. So we can easily see stage The quantity and each of them stage Of task Number .
2.3 see Stage Of task
We can also go through timeline Look at each task Time consuming information . We continue with the above timeline For example , The integrity of this query task The information is as follows :
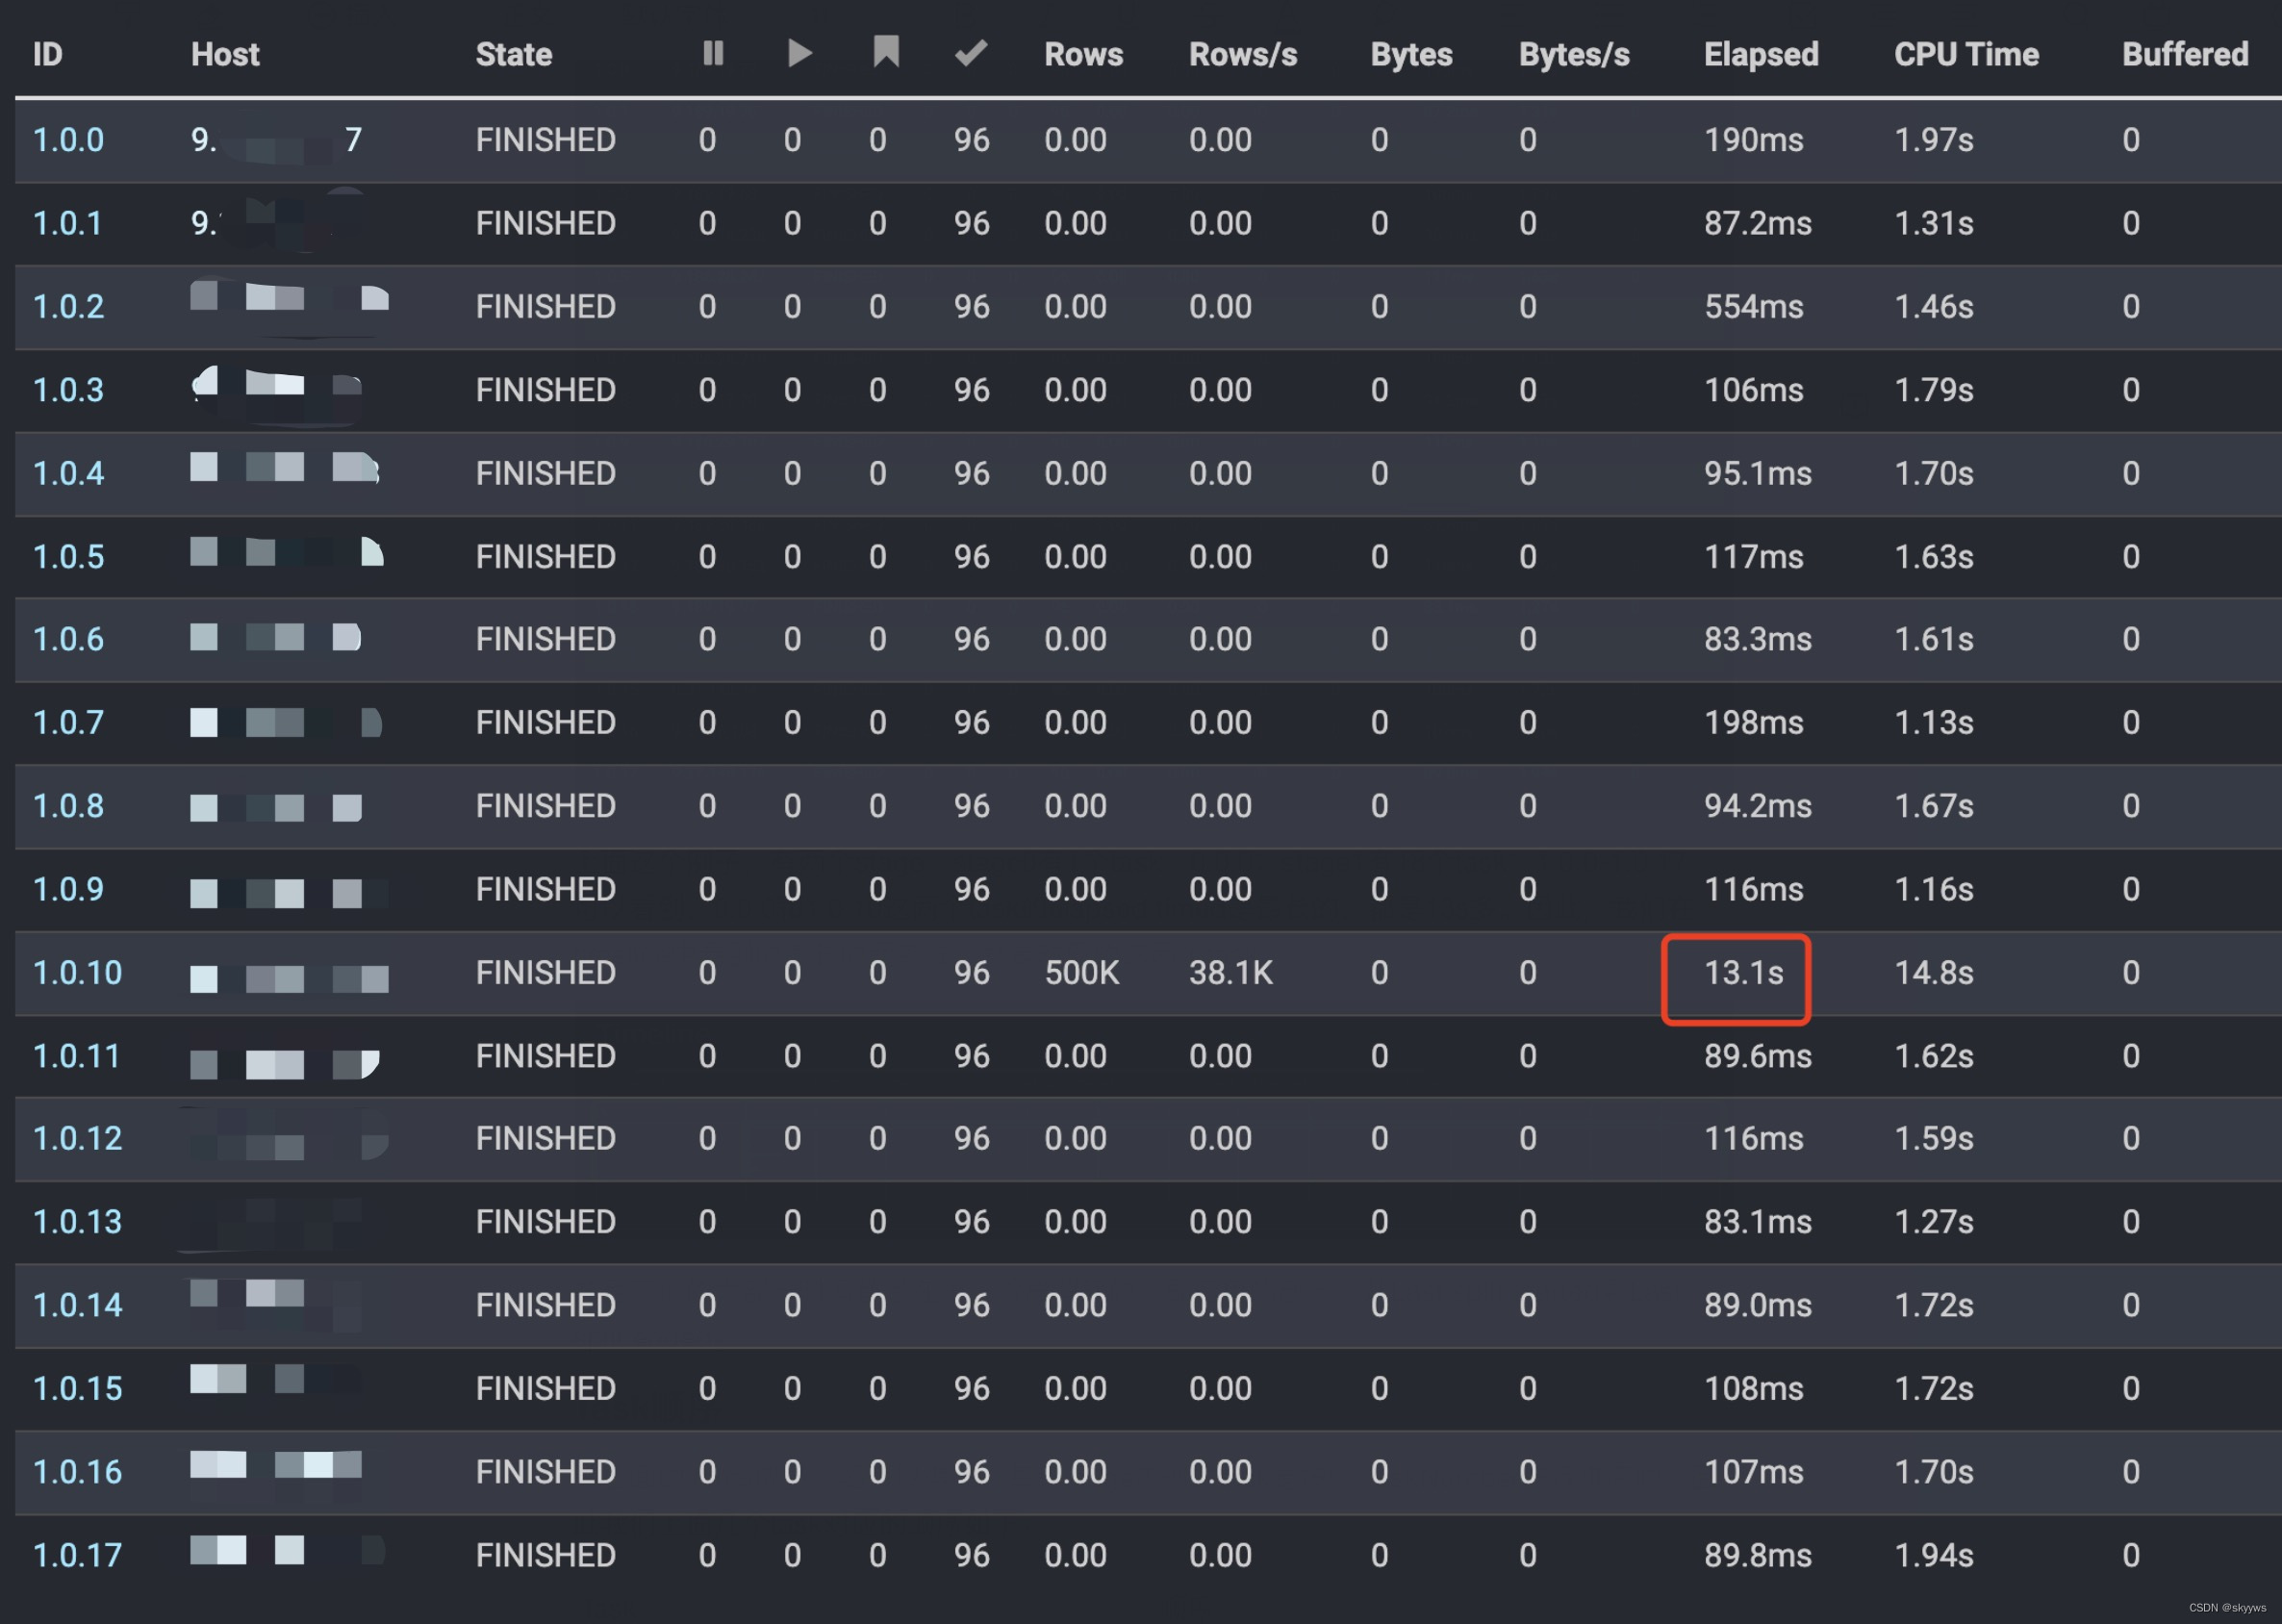
You can see , There are two stage.stage0 Yes 1 individual task:0.0.0;stage1 Yes 18 individual task:1.0.0~1.0.17. among ,0.0.0 and 1.0.10 these two items. task Of elapsed timed Is the longest , All are 13s many . therefore , We are timeline The longest two lines seen in , It's the corresponding two task: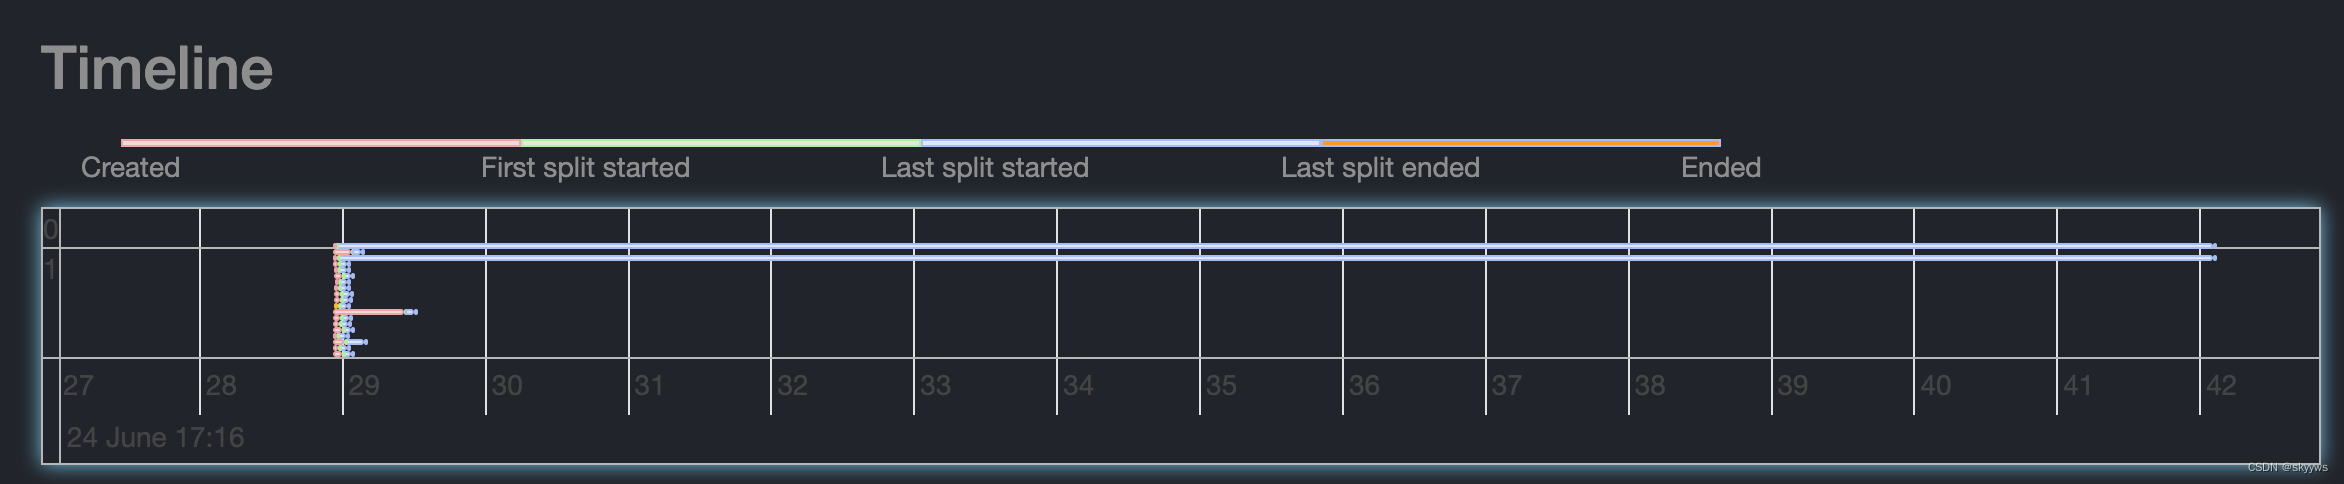
And most of their time is consumed in the third stage , That is, the blue part , from Last split started To Last split ended.
2.3.1 Task The order
From the above items Members can know , Every stage Inside task Is in accordance with the -taskNumber sorted , So let's talk about the above task The corresponding order is as follows :
| Task | The order |
|---|---|
| 1.0.0 | -0 |
| 1.0.1 | -0.1 |
| 1.0.2 | -0.2 |
| … | … |
| 1.0.10 | -0.1 |
| 1.0.11 | -0.11 |
| … | … |
| 1.0.17 | -0.17 |
What needs to be noted here is 1.0.1 and 1.0.10 these two items. task Of sort The value is the same , All are -0.1. So the final , Above Timeline Of stage 1 Of task The order from top to bottom is :
1.0.0 -> 1.0.10/1.0.1 -> 1.0.11 -> … -> 1.0.17 -> 1.0.2 -> … -> 1.0.9
Combined with the above detailed task chart , We learned that :1.0.10 Time consuming 13.1s,1.0.2 Time consuming 554ms( Compared to other task It takes a long time ), these two items. task Right in timeline Second of ( Or maybe the third ) And the middle part :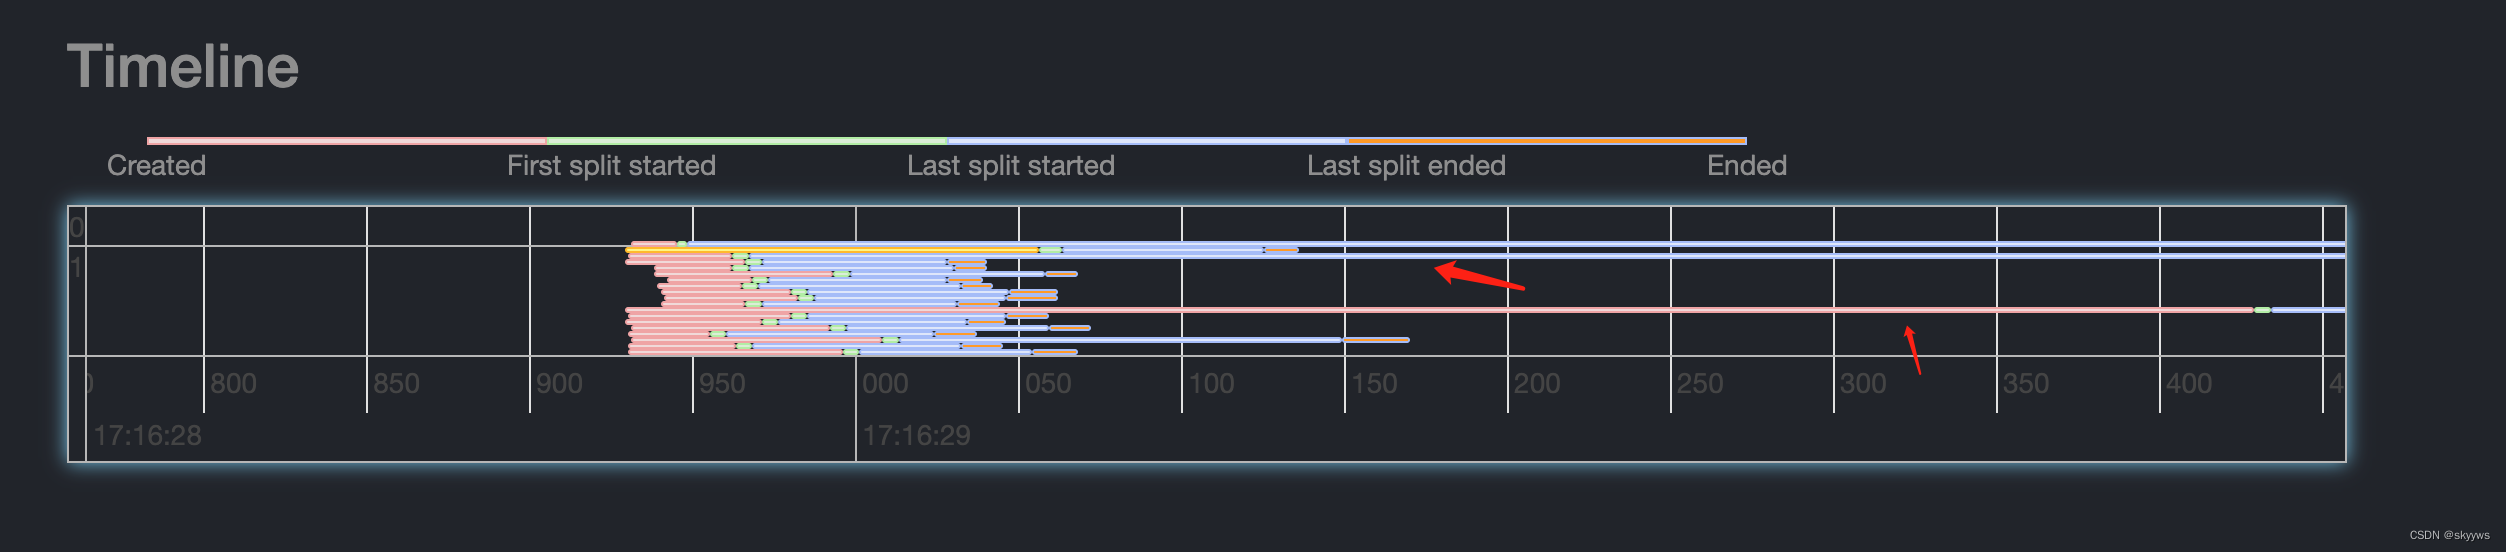
3、 ... and 、Timeline Use the summary
Through the introduction above , We can see ,timeline It mainly shows each stage With its task An overview of . therefore , We can usually use timeline Get the following information :
1) Quickly check the bottleneck of the whole query stage;
2) Rapid positioning stage Inside task Is there a skew;
3) adopt task The length of different colors , At which stage does rapid positioning take up a high proportion of time ;
4) According to the found slow task, combining task For further investigation .
for example , For the following figure :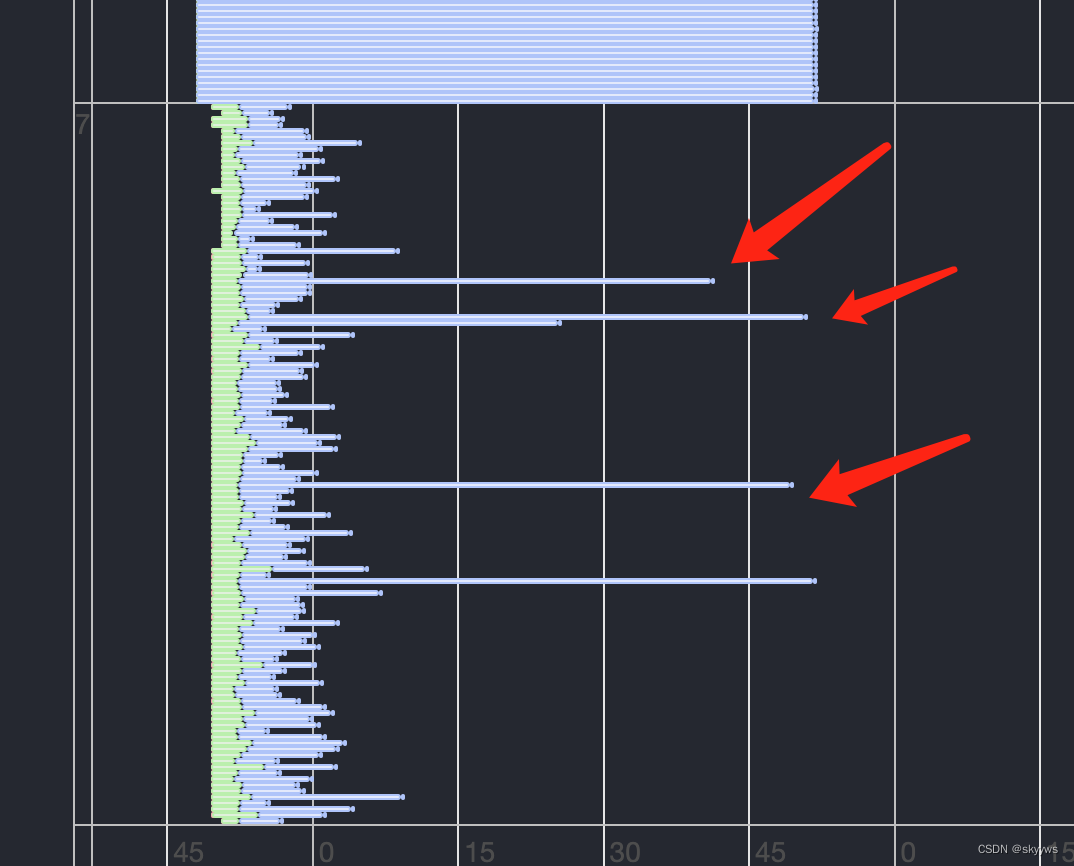
You can see , The bottom stage(scan node ) The part of being task It takes a long time , And there are blue lines , namely Last split started To Last split ended. Explain these task All of the split in , There are at least 1 individual split Time consuming , At this point, we can check these task The details of .
边栏推荐
猜你喜欢
【学习笔记】zkw 线段树
Blog recommendation | Apache pulsar cross regional replication scheme selection practice
centso7 openssl 报错Verify return code: 20 (unable to get local issuer certificate)

【学习笔记】AGC010
How to continue after handling chain interruption / sub chain error removed from scheduling
Differences between MySQL storage engine MyISAM and InnoDB
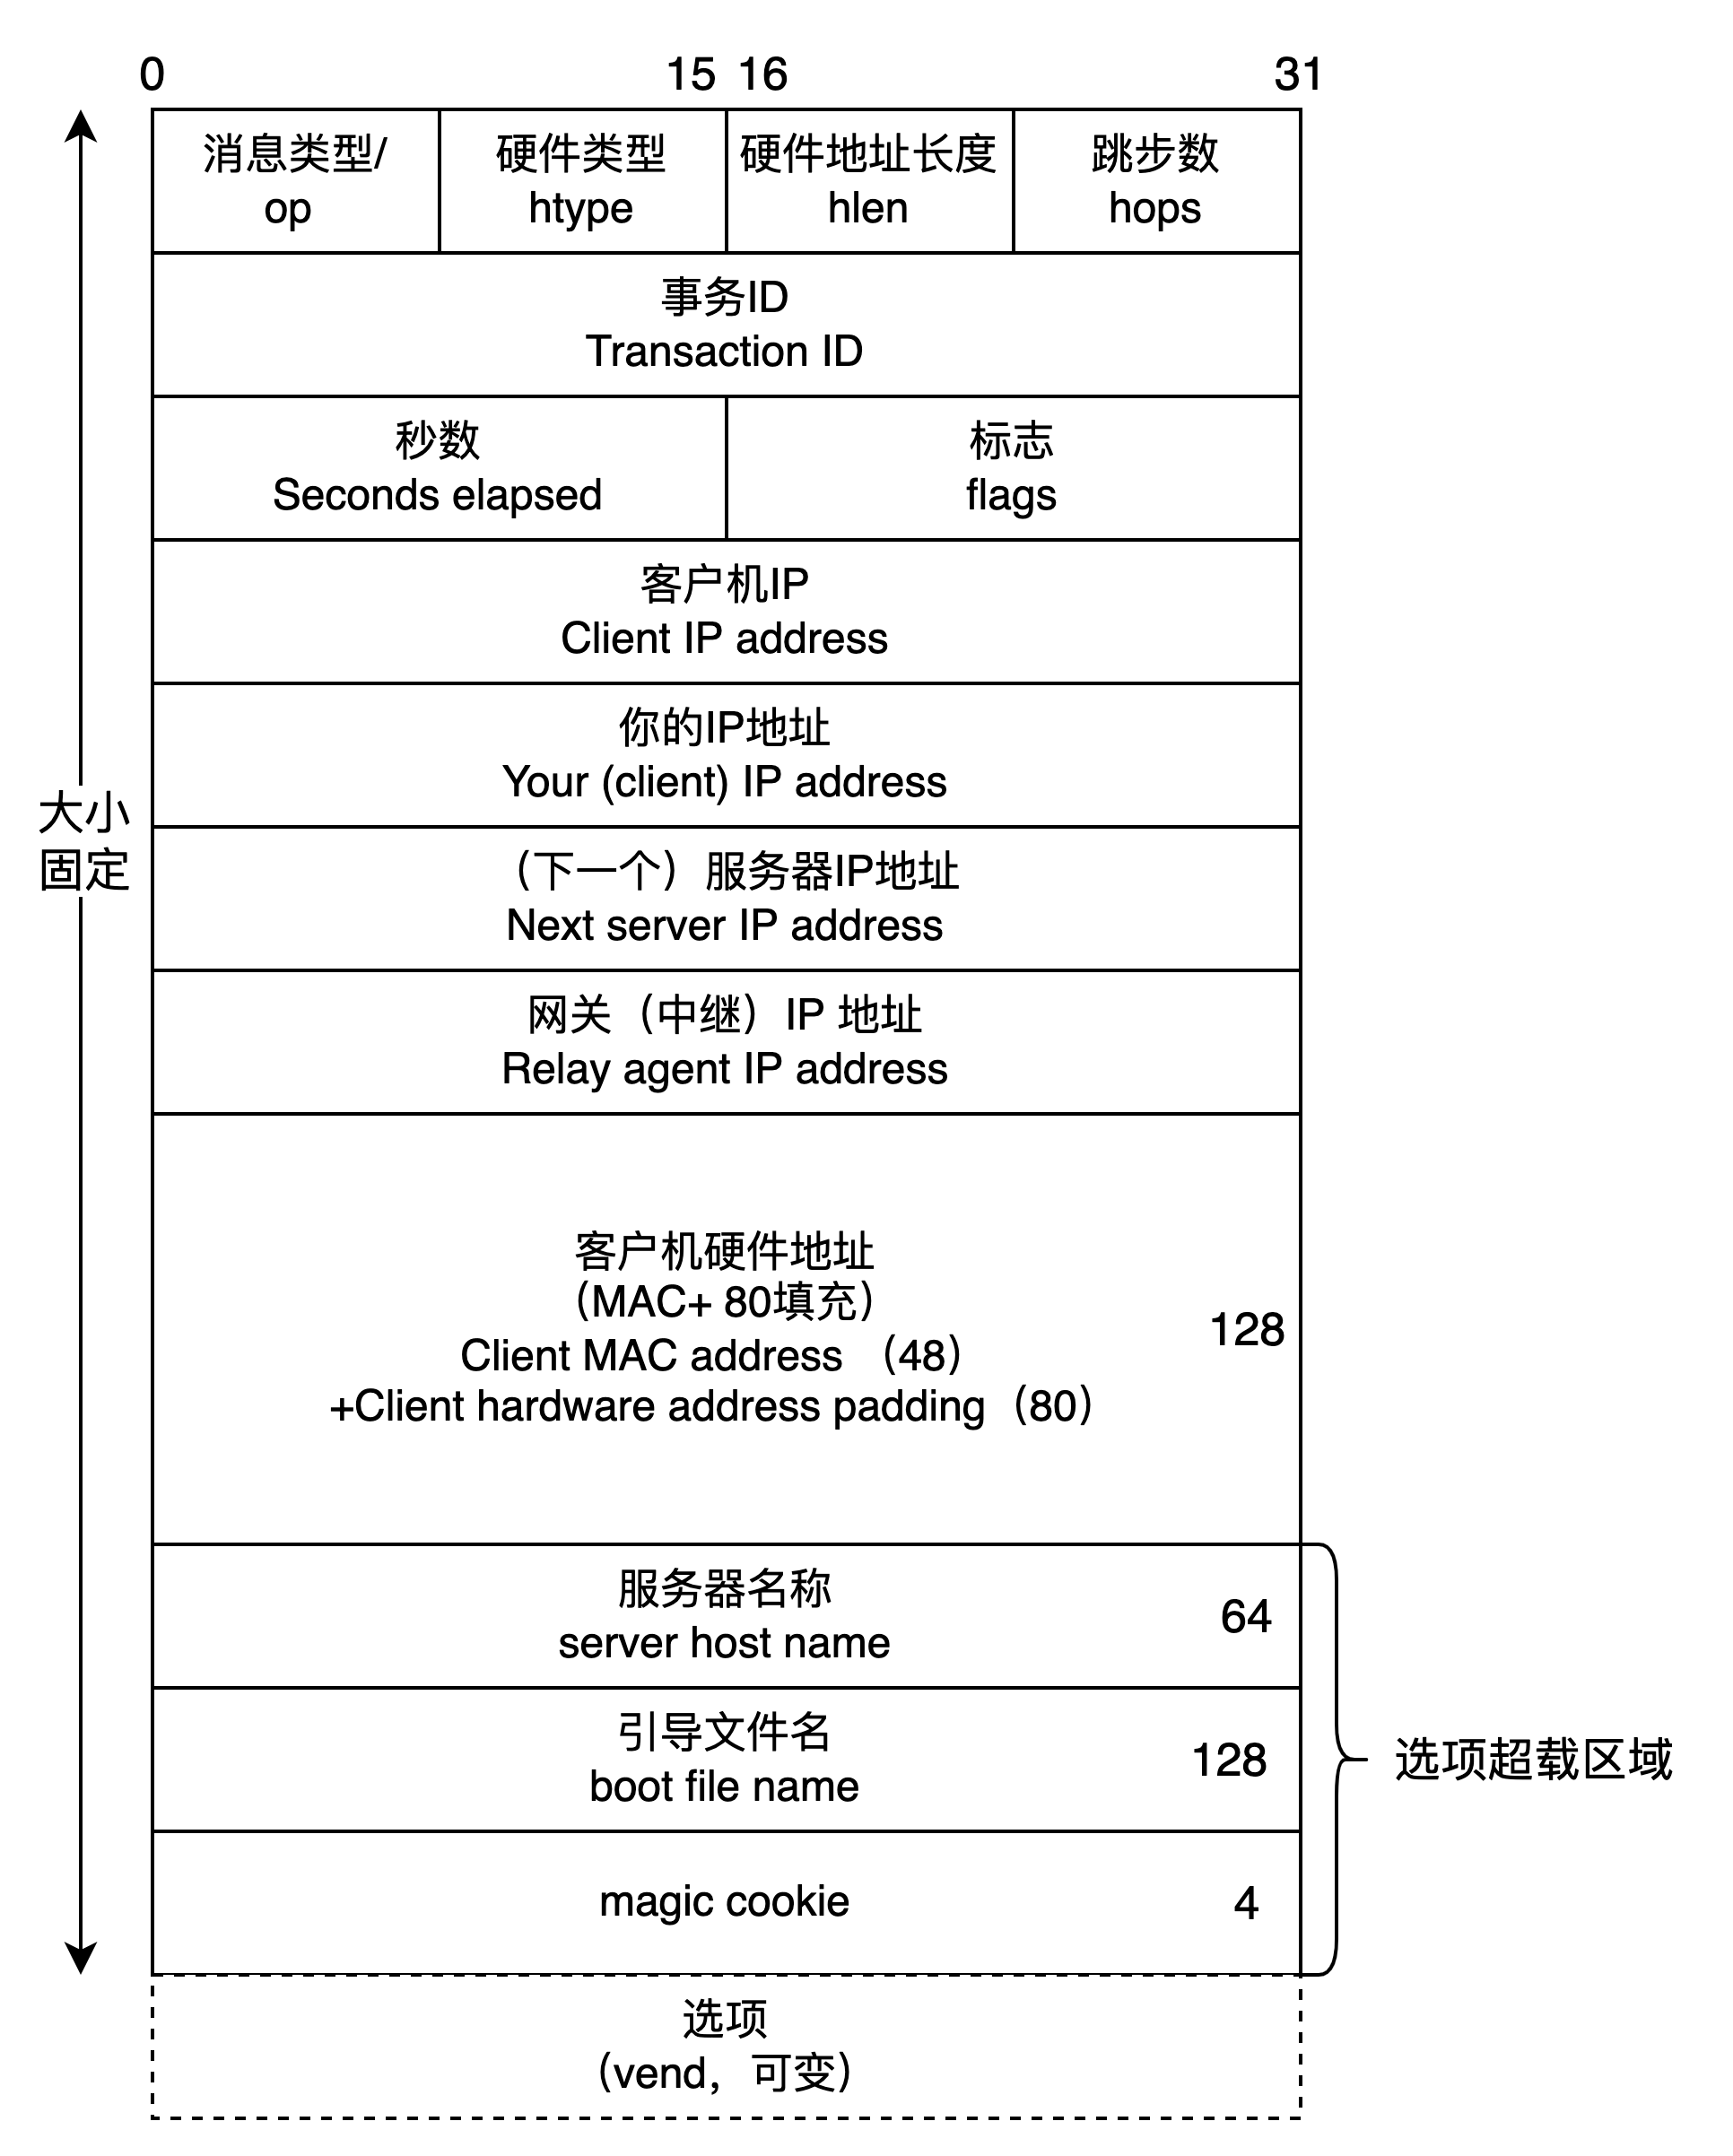
Analysis of DHCP dynamic host setting protocol
MATLAB中polarscatter函数使用
![[untitled]](/img/6c/df2ebb3e39d1e47b8dd74cfdddbb06.gif)
[untitled]
处理链中断后如何继续/子链出错removed from scheduling
随机推荐
MySQL master-slave replication
What if the xshell evaluation period has expired
学习突围2 - 关于高效学习的方法
迅为iTOP-IMX6ULL开发板Pinctrl和GPIO子系统实验-修改设备树文件
非分区表转换成分区表以及注意事项
企业级自定义表单引擎解决方案(十二)--体验代码目录结构
Adopt a cow to sprint A shares: it plans to raise 1.85 billion yuan, and Xu Xiaobo holds nearly 40%
shell 批量文件名(不含扩展名)小写改大写
基于鲲鹏原生安全,打造安全可信的计算平台
Cmu15445 (fall 2019) project 2 - hash table details
Analysis of DHCP dynamic host setting protocol
在字符串中查找id值MySQL
Go语言学习笔记-结构体(Struct)
Sed of three swordsmen in text processing
明星企业普渡科技大裁员:曾募资超10亿 腾讯红杉是股东
如何让electorn打开的新窗口在window任务栏上面
【无标题】
About how appium closes apps (resolved)
Leetcode skimming: binary tree 20 (search in binary search tree)
飞桨EasyDL实操范例:工业零件划痕自动识别