当前位置:网站首页>Elk enterprise log analysis system
Elk enterprise log analysis system
2022-07-05 13:48:00 【[email protected]】
1 Why use ELK
Logs mainly include system logs 、 Application logs and security logs . The system operation and maintenance personnel and developers can understand the software and hardware information of the server through the log 、 Check the errors in the configuration process and the causes of the errors . Regular log analysis can help you understand the load of the server , Performance security , So as to take measures to correct mistakes in time
Often we use the log of a single machine grep、awk And other tools can basically achieve simple analysis , But when logs are distributed across different devices . If you manage hundreds of servers , You're still using the traditional method of logging in each machine in turn to look up the logs . Does this feel tedious and inefficient . We need to use centralized log management , for example : Open source syslog, Summarize the log collection on all servers . After centralized management of logs , Log statistics and retrieval has become a more cumbersome thing , Generally we use grep、awk and wc etc. Linux Command can realize retrieval and statistics , But for more demanding queries 、 Sorting and statistics requirements and large number of machines are still using this method, which is hard to avoid .
Generally, a large system is a distributed deployment architecture , Different service modules are deployed on different servers , When problems arise , Most situations need to be based on the key information exposed by the problem , Go to specific servers and service modules , Building a centralized log system , It can improve the efficiency of location problem .
2 ELK Log analysis system
ELK The platform is a complete set of centralized log processing solutions , take ElasticSearch、Logstash and Kiabana Three open source tools are used together , Complete more powerful user query of logs 、 Sort 、 Statistical needs .
2.1 E(Elasticsearch) summary
Provides a distributed multi-user capability of full-text search engine
1、Elasticsearch characteristic
- Near real time
- colony
- node
- Indexes
Indexes ( library )→ type ( surface )→ file ( Record )
Shards and copies
On the ground , The data stored in the index may exceed the hardware limit of a single node , Like a 10 Million documents need 1TB Space may not be suitable for storage on a single node's disk , Or search requests from a single node are too slow , To solve this problem ,elasticsearch Provides the ability to divide an index into multiple slices , When creating an index , You can define the number of slices you want . Each partition is a fully functional independent index , It can be on any node in the cluster .
Fragmentation :
1、 Horizontal split expansion , Increase the amount of storage
2、 Distributed parallel cross fragmentation operations , Provide performance and throughput
The mechanism of distributed fragmentation and how to summarize the documents of search requests are completely different elasticsearch The control of the , These are transparent to users
Network problems and other problems can come unexpectedly at any time , For robustness , It is strongly recommended to have a failover mechanism , No matter what kind of failure to prevent fragmentation or node unavailability , So ,elasticsearch Let's slice the index into one or more copies , It is called a piecemeal copy or a copy
copy :
1、 High availability , In case of fragmentation or node failure , For this reason , Split copies on different nodes
2、 Performance enhancement , Increased throughput , Search can be performed on all copies in parallel
ElasticSearch: Is based on Lucene( The architecture of a full-text search engine ) Developed distributed storage retrieval engine , Used to store all kinds of logs .
ElasticSearch Yes, it is Java Developed , It can be done by RESTful Web Interface , So that users can communicate with ElasticSearch signal communication .
Elasticsearch It's a real-time 、 Distributed and scalable search engine , Allow full text 、 Structured search , It is usually used to index and search large amounts of log data , It can also be used to search for many different types of documents .
2.2 L(Logstash) summary
A powerful data processing tool
Data transmission can be realized 、 Format processing 、 Format output
data input 、 The data processing ( Such as filtration , Rewriting, etc. ) And data output
Consists of three components :Input、Output、Filter Plugin
Input: Get log
Output: Output log
Filter Plugin: Filtering logs 、 Format processing
1、LogStash Main components
Shipper
Indexer
Broker
Search and Storage
Web Interface
Logstash: As a data collection engine . It supports dynamic data collection from various data sources , And filter the data 、 analysis 、 Enrich 、 Unified format and other operations , Then store it in the location specified by the user , Usually sent to ElasticSearch.
Logstash from Ruby Language writing , Running on the Java virtual machine (JVM) On , It is a powerful data processing tool , Data transmission can be realized 、 Format processing 、 Format output .Logstash It has powerful plug-in function , Commonly used for log processing .
2.3 K(Kibana) summary
One for Elasticsearch Open source analysis and visualization platform
Search for 、 View the storage in Elasticsearch Data in index
Advanced data analysis and display through various charts
Kibana Usually with ElasticSearch Deploy together ,Kibana yes ElasticSearch A powerful data visualization Dashboard,Kibana Provide graphical web Interface to browse ElasticSearch Log data , Can be used to summarize 、 Analyze and search important data .
2.3.1 Kibana The main function
Elasticsearch Seamless integration
Consolidate data , Complex data analysis
Let more team members benefit
Flexible interface , It's easier to share
Simple configuration 、 Visualizing multiple data sources
Simple data export
2.4 Additional components added
Filebeat: Lightweight open source log file data collector . It is usually installed on the client that needs to collect data Filebeat, And specify the directory and log format ,Filebeat Can quickly collect data , And send it to logstash To analyze , Or send it directly to ElasticSearch Storage , Performance compared to JVM Upper logstash Obvious advantages , It's a replacement . Often applied to EFLK Architecture
cache / Message queue (redis、kafka、RabbitMQ etc. ): Traffic peak shaving and buffering can be carried out for high concurrency log data , Such buffering can protect data from loss to a certain extent , You can also apply decoupling to the entire architecture .
Fluentd: Is a popular open source data collector . because logstash The disadvantage of being too heavy ,Logstash Low performance 、 More resource consumption and other problems , And then there's this Fluentd Appearance . Comparison 1ogstash,Fluentd Easier to use 、 Less resource consumption 、 Higher performance , More efficient and reliable in data processing , Welcomed by enterprises , Become logstash An alternative to , Often applied to EFK Architecture . stay Kubernetes It is also commonly used in clusters EFK As a scheme for log data collection .
stay Kubernetes In the cluster, it is generally through DaemonSet To run the Fluentd, So that it's in every Kubernetes You can run one on a work node pod.
It gets the container log file 、 Filter and transform log data , And then pass the data to ElasticSearch colony , Index and store it in the cluster .
2.4.1 filebeat combination logstash Benefits
- adopt Logstash With disk based adaptive buffering system , The system will absorb the incoming throughput , To lessen Elasticsearch Pressure to keep writing data
- From other data sources ( Like databases ,S3 Object store or message delivery queue ) Extract from
- Sending data to multiple destinations , for example S3,HDFS(Hadoop distributed file system ) Or write to a file
- Use conditional data flow logic to form more complex processing pipelines
2.5 The basic characteristics of complete log system
collect : It can not collect log data from multiple sources
transmission : It can stably parse, filter and transmit log data to the storage system
Storage : Storage log data analysis : Support UI analysis
Warning : Able to provide error reports , Monitoring mechanism
2.6 ELK How it works
(1) Deploy on all servers that need to collect logs Logstash; Or you can centralize the log management on the log server , Deploy on the log server Logstash.
(2)Logstash Collect the logs , Format the log and output it to Elasticsearch In a crowd .
(3)Elasticsearch Index and store the formatted data .
(4)Kibana from ES Query data in the cluster to generate charts , And display the front-end data .
summary :1ogstash As a log collector , Collect data from a data source , And filter the data , format processing , And then leave it to ElasticSearch Storage ,kibana Visualize the log .
3 Deploy ELK Log analysis system
1、 The experimental requirements
- To configure ELK Log analysis cluster
- Use Logstash Collect the logs
- Use Kibana Look at the analysis log
2、 Environment configuration
| host | operating system | IP Address | Installation package / Software / Tools |
|---|---|---|---|
| node1 | CentOS7 | 192.168.16.10 | Elasticsearch |
| node2 | CentOS7 | 192.168.16.20 | Elasticsearch |
| apache | CentOS7 | 192.168.16.30 | httpd /Logstash |
| Real machine | Windows | 192.168.16.1 | —— |
node1 node (2C/4G):node1/192.168.16.10					Elasticsearch
node2 node (2C/4G):node2/192.168.16.20					Elasticsearch
Apache node :apache/192.168.16.30
All nodes , Turn off the system firewall and security mechanism
systemctl stop firewalld.service
setenforce 0
node1(192.168.16.10)
hostnamectl set-hostname node1
su -
node2(192.168.16.20)
hostnamectl set-hostname node2
su -
apache(192.168.16.30)
hostnamectl set-hostname apache
su -
3、 To configure elasticsearch Environmental Science (node1、node2)
node1(192.168.16.10)
node2(192.168.16.20)
Only one host name is different , Marked
echo '192.168.16.10 node1' >> /etc/hosts
echo '192.168.16.20 node2' >> /etc/hosts

cd /opt
rz elasticsearch-5.5.0.rpm

rpm -ivh elasticsearch-5.5.0.rpm

systemctl daemon-reload
systemctl enable elasticsearch.service
3.1 LK Elasticsearch Cluster deployment ( stay Node1、Node2 Operation on node )
1. Environmental preparation
# Set up Java Environmental Science

java -version										# If not installed ,yum -y install java
openjdk version "1.8.0_131"
OpenJDK Runtime Environment (build 1.8.0_131-b12)
OpenJDK 64-Bit Server VM (build 25.131-b12, mixed mode)
2. Deploy Elasticsearch Software
(1) install elasticsearch—rpm package
# Upload elasticsearch-6.7.2.rpm To /opt Under the table of contents
cd /opt
rpm -ivh elasticsearch-6.7.2.rpm
(2) modify elasticsearch Master profile
cp /etc/elasticsearch/elasticsearch.yml /etc/elasticsearch/elasticsearch.yml.bak
vim /etc/elasticsearch/elasticsearch.yml
--17-- uncomment , Specify the cluster name
cluster.name: my-elk-cluster
--23-- uncomment , Specify the node name :Node1 The node is node1,Node2 The node is node2
node.name: node1
node.master: true		# whether master node ,false Why not
node.data: true			# Whether the data node ,false Why not
--33-- uncomment , Specify the data storage path
path.data: /var/lib/elasticsearch
--37-- uncomment , Specify the log storage path
path.logs: /var/log/elasticsearch
--43-- uncomment , avoid es Use swap Swap partition
bootstrap.memory_lock: true
--55-- uncomment , Set listening address ,0.0.0.0 For all addresses
network.host: 0.0.0.0
--59-- uncomment ,ES  The default listening port of the service is 9200
http.port: 9200					# Appoint es The cluster provides an interface for external access
transport.tcp.port: 9300		# Appoint es Internal communication interface of the cluster
--68-- uncomment , Cluster discovery is realized by unicast , Specify the nodes to discover
discovery.zen.ping.unicast.hosts: ["192.168.16.10:9300", "192.168.16.20:9300"]

grep -v "^#" /etc/elasticsearch/elasticsearch.yml

mkdir -p /data/elk_data
chown elasticsearch:elasticsearch /data/elk_data/

systemctl start elasticsearch
netstat -antp |grep 9200
(3)es Performance tuning parameters
# Optimize the maximum memory size and the maximum number of file descriptors
vim /etc/security/limits.conf
......
*  soft    nofile          65536
*  hard    nofile          131072
*  soft    memlock         unlimited
*  hard    memlock         unlimited

ulimit -n
Need to restart to take effect
# Optimize elasticsearch The memory permissions the user has
because ES Build on lucene, and lucene The power of design is lucene Can make good use of operating system memory to cache index data , To provide fast query performance .lucene The index file of segements It's stored in a single file , And immutable , about OS Come on , Be able to keep the index file in cache in , For quick access to ; therefore , It's necessary for us to leave half of our physical memory to lucene ; The other half of the physical memory is reserved for ES(JVM heap ). therefore , stay ES Memory settings , The following principles can be followed :
- When the machine memory is less than 64G when , Follow the general principles ,50% to ES,50% Leave it to the operating system , for lucene Use
- When the machine memory is greater than 64G when , Follow the principles : It is suggested to assign to ES Distribute 4~32G The memory of , Other memory is reserved for the operating system , for lucene Use
vim /etc/sysctl.conf
# The maximum number of memory mapped areas a process can have , Reference data ( Distribute  2g/262144,4g/4194304,8g/8388608)
vm.max_map_count=262144

sysctl -p
sysctl -a | grep vm.max_map_count
(4) start-up elasticsearch Is it successfully opened
systemctl start elasticsearch.service
systemctl enable elasticsearch.service
netstat -antp | grep 9200
(5) View node information
 Browser access
http://192.168.16.10:9200  http://192.168.16.20:9200
 Look at the node  Node1、Node2  Information about .
Browser access
http://192.168.80.10:9200/_cluster/health?pretty  、 http://192.168.80.11:9200/_cluster/health?

pretty View the health of the cluster , You can see  status  The value is  green( green ),  Indicates that the node is running healthily .

 Browser access  http://192.168.80.10:9200/_cluster/state?pretty   Check the cluster status information .
3. install Elasticsearch-head plug-in unit
Viewing the status of the cluster in the above way is not user-friendly , You can install Elasticsearch-head plug-in unit , You can more easily manage clusters .
Elasticsearch stay 5.0 After version ,Elasticsearch-head The plug-in needs to be installed as a stand-alone service , Need to use npm Tools (NodeJS Package management tools ) install .
install Elasticsearch-head The dependent software needs to be installed in advance node and phantomjs.
node: It's based on Chrome V8 Engine JavaScript Running environment .
phantomjs: It's based on webkit Of JavaScriptAPI, It can be understood as an invisible browser , Anything based on webkit What browsers do , It can do .
(1) Compilation and installation node
node1(192.168.16.10)
node2(192.168.16.20)
# Upload package  node-v8.2.1.tar.gz  To /opt
yum install gcc gcc-c++ make -y

cd /opt
tar zxvf node-v8.2.1.tar.gz

cd node-v8.2.1/
./configure
make && make install
(2) install phantomjs
# Upload package  phantomjs-2.1.1-linux-x86_64.tar.bz2  To
cd /opt
tar jxvf phantomjs-2.1.1-linux-x86_64.tar.bz2 -C /usr/local/src/
cd /usr/local/src/phantomjs-2.1.1-linux-x86_64/bin
cp phantomjs /usr/local/bin
(3) install Elasticsearch-head Data visualization tool
# Upload package  elasticsearch-head.tar.gz  To /opt
cd /opt
tar zxvf elasticsearch-head.tar.gz -C /usr/local/src/
cd /usr/local/src/elasticsearch-head/
npm install
(4) modify Elasticsearch Master profile
vim /etc/elasticsearch/elasticsearch.yml
......
-- Add the following at the end --
http.cors.enabled: true				# Enable cross domain access support , The default is  false
http.cors.allow-origin: "*"			# Specify the domain names and addresses allowed for cross domain access for all

systemctl restart elasticsearch
(5) start-up elasticsearch-head service
# Must be after decompression elasticsearch-head Start the service in the directory , The process will read the gruntfile.js file , Otherwise, it may fail to start .
cd /usr/local/src/elasticsearch-head/
npm run start &    # Start the service and work in the background

> [email protected] start /usr/local/src/elasticsearch-head
> grunt server

Running "connect:server" (connect) task
Waiting forever...
Started connect web server on http://localhost:9100

#elasticsearch-head  The listening port is  9100
netstat -natp |grep 9100
netstat -natp |grep 9200
(6) adopt Elasticsearch-head see Elasticsearch Information
Access... Through a browser http://192.168.80.10:9100/ Address and connect to the cluster . If you see a cluster health value of green green , It means the cluster is healthy .
http://192.168.16.10:9100
http://192.168.16.20:9100
Then click Connect Will find : Cluster health value : green (0 of 0)
●node1 Information action
*node2 Information action
(7) Insert Index
# Insert a test index by command , The index for  index-demo, The type is  test.
curl -X PUT 'localhost:9200/index-demo/test/1?pretty&pretty' -H 'content-Type: application/json' -d '{"user":"zhangsan","mesg":"hello world"}'
// The output is as follows :
{

"_index" : "index-demo",
"_type" : "test",
"_id" : "1",
"_version" : 1,
"result" : "created",
"_shards" : {

"total" : 2,
"successful" : 2,
"failed" : 0
},
"created" : true
}
Browser access http://192.168.16.10:9100/ View index information , You can see that the index is fragmented by default 5 individual , And there's a copy .
Click on “ Data browsing ”, Will find node1 The index created on is index-demo, The type is test Information about .
3.2 LK Logstash Deploy ( stay Apache Operation on node )
Logstash It is generally deployed on the server that needs to monitor its logs . In this case ,Logstash Deployed in Apache Server , Used to collect Apache Log information of the server and send it to Elasticsearch.
1. Change host name
hostnamectl set-hostname apache
2. install Apahce service (httpd)
yum -y install httpd
systemctl start httpd
3. install Java Environmental Science
yum -y install java
java -version
4. install logstash
# Upload package  logstash-5.5.1.rpm  To /opt Under the table of contents
cd /opt
rpm -ivh logstash-5.5.1.rpm
systemctl start logstash.service
systemctl enable logstash.service

ln -s /usr/share/logstash/bin/logstash /usr/local/bin/
5. test Logstash
Logstash Command common options :
-f: With this option you can specify Logstash Configuration file for , Configure according to the configuration file Logstash Input and output streams of .
-e: Get... From the command line , Input 、 The output is followed by a string , This string can be treated as Logstash Configuration of ( If it's empty , It is used by default stdin As input ,stdout As the output ).
-t: Test the configuration file for correctness , And then quit .
Define input and output streams :
# The input is standard input , The output is standard output ( Similar pipe )
logstash -e 'input { stdin{} } output { stdout{} }'
......
www.baidu.com										# Type in ( The standard input )
2022-06-22T03:58:47.799Z node1 www.baidu.com		# Output results ( standard output )
www.sina.com.cn										# Type in ( The standard input )
2022-06-22T03:59:02.908Z node1 www.sina.com.cn		# Output results ( standard output )

// perform  ctrl+c  sign out

# Use  rubydebug  Output detailed format display ,codec  For a codec
logstash -e 'input { stdin{} } output { stdout{ codec=>rubydebug } }'
......
www.baidu.com										# Type in ( The standard input )
{

    "@timestamp" => 2022-06-22T02:15:39.136Z,		# Output results ( The result of the treatment )
      "@version" => "1",
          "host" => "apache",
       "message" => "www.baidu.com"
}

# Use  Logstash  Write the information  Elasticsearch  in
logstash -e 'input { stdin{} } output { elasticsearch { hosts=>["192.168.16.10:9200"] } }'
			  Input 				 Output 			 docking
......
www.baidu.com										# Type in ( The standard input )
www.sina.com.cn										# Type in ( The standard input )
www.google.com										# Type in ( The standard input )

// The results are not displayed on the standard output , Instead, send to  Elasticsearch  in , Browser accessible  http://192.168.16.10:9100/  View index information and data browsing .
6. Definition logstash The configuration file
Logstash  The configuration file basically consists of three parts :input、output  as well as  filter( Optional , Choose to use as needed ).
input: Indicates collecting data from a data source , Common data sources such as Kafka、 Log files, etc
filter: Represents the data processing layer , Including formatting data 、 Data type conversion 、 Data filtering, etc , regular expression
output: It means that you will Logstash The collected data is processed by the filter and output to Elasticsearch.

# The format is as follows :
input {
    ...}
filter {
    ...}
output {
    ...}

# In each part , You can also specify multiple access methods . for example , To specify two log source files , The format is as follows :
input {

	file {
     path =>"/var/log/messages" type =>"syslog"}
	file {
     path =>"/var/log/httpd/access.log" type =>"apache"}
}

# modify  Logstash  The configuration file , Let it collect system logs /var/log/messages, And output it to  elasticsearch  in .
chmod +r /var/log/messages					# Give Way  Logstash  You can read logs

vim /etc/logstash/conf.d/system.conf
input {

    file{

        path =>"/var/log/messages"						# Specify the location of the logs to collect
        type =>"system"									# Custom log type identification
        start_position =>"beginning"					# Means to collect... From the beginning
    }
}
output {

    elasticsearch {
    										# Output to  elasticsearch
        hosts => ["192.168.16.10:9200","192.168.16.20:9200"]	# Appoint  elasticsearch  The address and port of the server
        index =>"system-%{+YYYY.MM.dd}"					# Specify output to  elasticsearch  Index format
    }
}

systemctl restart logstash
Browser access http://192.168.16.10:9100/ View index information
3.3 ELK Kiabana Deploy ( stay Node1 Operation on node )
1. install Kiabana
# Upload package  kibana-5.5.1-x86_64.rpm  To /opt Catalog
cd /opt
rpm -ivh kibana-5.5.1-x86_64.rpm
2. Set up Kibana Primary profile for
vim /etc/kibana/kibana.yml
--2-- uncomment ,Kiabana  The default listening port of the service is 5601
server.port: 5601
--7-- uncomment , Set up  Kiabana  The monitoring address of ,0.0.0.0 For all addresses
server.host: "0.0.0.0"
--28-- uncomment , To configure es Server's ip, If it is a cluster, configure it master Node ip
elasticsearch.url:  ["http://192.168.16.10:9200","http://192.168.16.20:9200"]
--37-- uncomment , Set in the  elasticsearch  Add .kibana Indexes
kibana.index: ".kibana"
--96-- uncomment , To configure kibana Log file path for ( You need to create... Manually ), Otherwise, the default is messages Keep a log in the library
logging.dest: /var/log/kibana.log
3. Create a log file , start-up Kibana service
touch /var/log/kibana.log
chown kibana:kibana /var/log/kibana.log

systemctl start kibana.service
systemctl enable kibana.service

netstat -natp | grep 5601
4. verification Kibana
Browser access http://192.168.16.10:5601
The first time you log in, you need to add a Elasticsearch Indexes :
Index name or pattern
// Input :system-* # Enter the previously configured... In the index name Output Prefix “system”
single click “create” Button to create , single click “Discover” Button to view chart information and log information .
Data display can be classified , stay “Available Fields” Medium “host”, And then click “add” Button , You can see the following “host” The result of screening
5. take Apache Log of the server ( Access to the 、 FALSE ) Add to Elasticsearch And pass Kibana Show
vim /etc/logstash/conf.d/apache_log.conf
input {

    file{

        path => "/etc/httpd/logs/access_log"
        type => "access"
        start_position => "beginning"
    }
    file{

        path => "/etc/httpd/logs/error_log"
        type => "error"
        start_position => "beginning"
    }
}
output {

    if [type] == "access" {

        elasticsearch {

            hosts => ["192.168.16.10:9200","192.168.16.20:9200"]
            index => "apache_access-%{+YYYY.MM.dd}"
        }
    }
	if [type] == "error" {

        elasticsearch {

            hosts => ["192.168.16.10:9200","192.168.16.20:9200"]
            index => "apache_error-%{+YYYY.MM.dd}"
        }
    }
}

cd /etc/logstash/conf.d/
/usr/share/logstash/bin/logstash -f apache_log.conf
Browser access http://192.168.16.10:9100 Check whether the index is created
Browser access http://192.168.16.10:5601 Sign in Kibana, single click “Index Pattern -> Create Index Pattern” Button to add an index , Enter the previously configured... In the index name Output Prefix apache_access-, And click “Create” Button . Add... In the same way apache_error- Indexes .
choice “Discover” tab , Select the newly added... From the middle drop-down list apache_access- 、apache_error- Indexes , You can view the corresponding charts and log information .
3.4 Filebeat+ELK Deploy
Node1 node (2C/4G):node1/192.168.16.10					Elasticsearch
Node2 node (2C/4G):node2/192.168.16.20					Elasticsearch
Apache node :apache/192.168.16.30					Logstash  Kibana  Apache
Filebeat node :filebeat/192.168.16.40				Filebeat
// stay Node1 Operation on node
1. install Filebeat
# Upload package  filebeat-6.2.4-linux-x86_64.tar.gz  To /opt Catalog
tar zxvf filebeat-6.2.4-linux-x86_64.tar.gz
mv filebeat-6.2.4-linux-x86_64/ /usr/local/filebeat
2. Set up filebeat Primary profile for
cd /usr/local/filebeat

vim filebeat.yml
filebeat.prospectors:
- type: log         # Appoint  log  type , Read message from log file
  enabled: true
  paths:
    - /var/log/messages       # Specify the log file to monitor
    - /var/log/*.log
  tags: ["sys"]		# Set index label
  fields:           # have access to  fields  Configure options to set some parameter fields to  output  in
    service_name: filebeat
    log_type: syslog
    from: 192.168.16.30

--------------Elasticsearch output-------------------
( Comment all out )

----------------Logstash output---------------------
output.logstash:
  hosts: ["192.168.16.30:5044"]      # Appoint  logstash  Of  IP  And port

# start-up  filebeat
nohup ./filebeat -e -c filebeat.yml > filebeat.out &
#-e: Output to standard output , Ban syslog/ File output
#-c: Specify profile
#nohup: Run commands without hanging up in the background of the system , Quitting the terminal will not affect the running of the program
4. stay Logstash Create a new node on the node where the component is located
Logstash  The configuration file
cd /etc/logstash/conf.d

vim filebeat.conf
input {

    beats {

        port => "5044"
    }
}
output {

    elasticsearch {

        hosts => ["192.168.16.10:9200","192.168.16.20:9200"]
        index => "%{[fields][service_name]}-%{+YYYY.MM.dd}"
    }
    stdout {

        codec => rubydebug
    }
}

# start-up  logstash
logstash -f filebeat.conf
5. Browser access http://192.168.16.10:5601 Sign in Kibana, single click “Create Index Pattern” Button to add an index “filebeat-*”, single click “create” Button to create , single click “Discover” Button to view chart information and log information .
summary
Log server
advantage
Improve safety
Centralized management
shortcoming
Log analysis is difficult
ELK How it works
1、 Centralized management of logs
2、 Format the log (Logstash) And output to the Elasticsearch
3、 Index and store the formatted data (Elasticsearch)
4、 Front end data display (Kibana)
版权声明
本文为[[email protected]]所创,转载请带上原文链接,感谢
https://yzsam.com/2022/186/202207051335384381.html
边栏推荐
- Internal JSON-RPC error. {"code":-32000, "message": "execution reverted"} solve the error
- 私有地址有那些
- Kotlin协程利用CoroutineContext实现网络请求失败后重试逻辑
- PHP generate Poster
- 华为推送服务内容,阅读笔记
- Datapipeline was selected into the 2022 digital intelligence atlas and database development report of China Academy of communications and communications
- RK3566添加LED
- Hide Chinese name
- Basic characteristics and isolation level of transactions
- laravel-dompdf导出pdf,中文乱码问题解决
猜你喜欢

Interviewer soul torture: why does the code specification require SQL statements not to have too many joins?

Operational research 68 | the latest impact factors in 2022 were officially released. Changes in journals in the field of rapid care
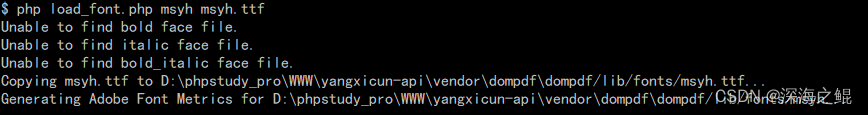
laravel-dompdf导出pdf,中文乱码问题解决
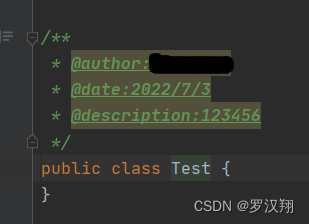
Idea set method annotation and class annotation
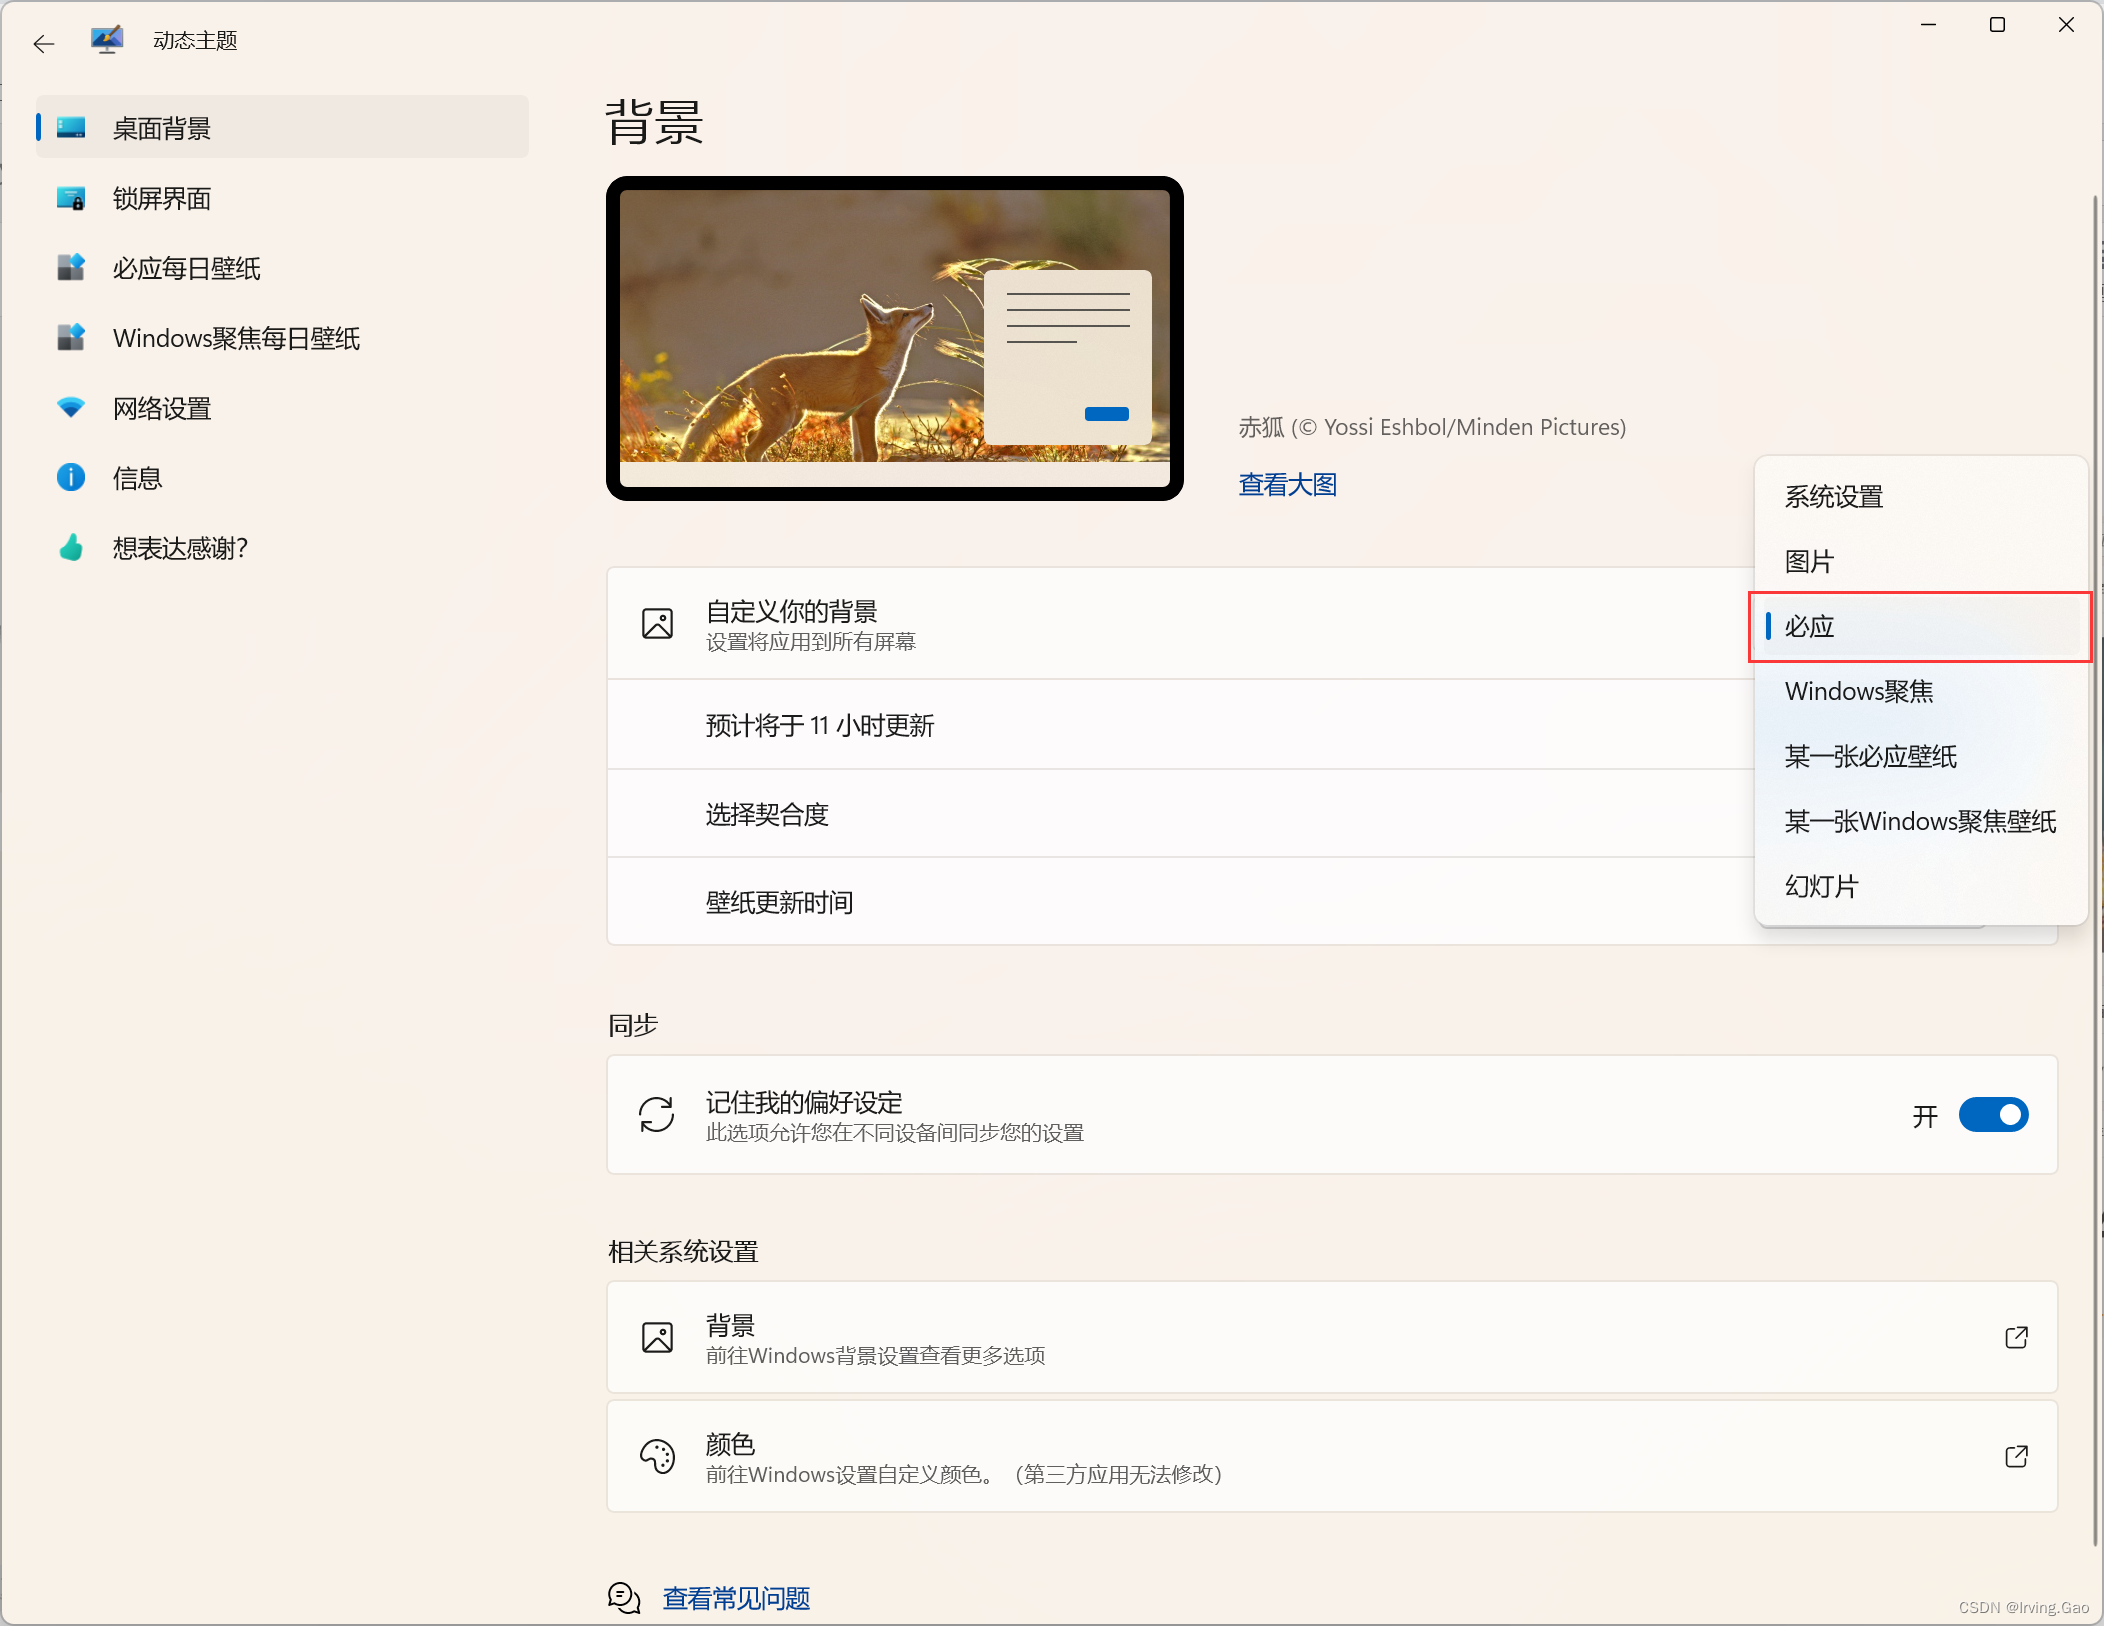
Win10——轻量级小工具

【华南理工大学】考研初试复试资料分享
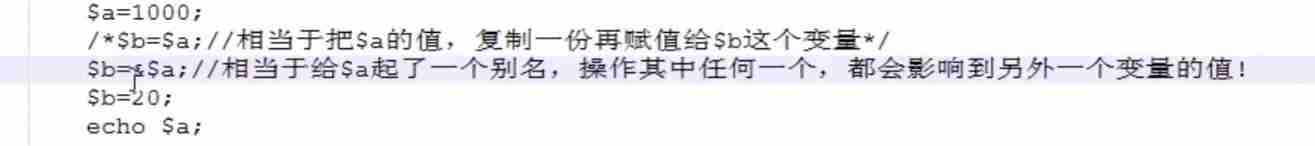
PHP basic syntax
C object storage
![[server data recovery] a case of RAID5 data recovery stored in a brand of server](/img/04/c9bcf883d45a1de616c4e1b19885a5.png)
[server data recovery] a case of RAID5 data recovery stored in a brand of server

What happened to the communication industry in the first half of this year?
随机推荐
运筹说 第68期|2022年最新影响因子正式发布 快看管科领域期刊的变化
2022年机修钳工(高级)考试题模拟考试题库模拟考试平台操作
Zhubo Huangyu: it's really bad not to understand these gold frying skills
About the problem and solution of 403 error in wampserver
Basic characteristics and isolation level of transactions
What is information security? What is included? What is the difference with network security?
MySQL get time
MySQL - database query - sort query, paging query
Address book (linked list implementation)
个人组件 - 消息提示
Win10 - lightweight gadget
Idea设置方法注释和类注释
Interviewer soul torture: why does the code specification require SQL statements not to have too many joins?
Zibll theme external chain redirection go page beautification tutorial
Network security - Novice introduction
redis6事务和锁机制
Personal component - message prompt
Prefix, infix, suffix expression "recommended collection"
通讯录(链表实现)
FPGA learning notes: vivado 2019.1 add IP MicroBlaze