当前位置:网站首页>机器学习之信用卡欺诈检测
机器学习之信用卡欺诈检测
2022-07-26 04:16:00 【西西先生666】
机器学习之信用卡欺诈检测
一、机器学习之信用卡欺诈检测
1.1 前言
- 数据来源:Kaggle 信用卡欺诈检测数据集https://www.kaggle.com/datasets/mlg-ulb/creditcardfraud?resource=download;
- 本文采用 XGBoost、随机森林、KNN、逻辑回归、SVM 和决策树解决信用卡欺诈检测问题;
1.2 案例分析
1.2.1 导入所需模块到 python 环境
# 1、导入所需模块到 python 环境中
import pandas as pd
import numpy as np
import matplotlib.pyplot as plt
from termcolor import colored as cl
import itertools
from sklearn.preprocessing import StandardScaler
from sklearn.model_selection import train_test_split
from sklearn.tree import DecisionTreeClassifier
from sklearn.neighbors import KNeighborsClassifier
from sklearn.linear_model import LogisticRegression
from sklearn.svm import SVC
from sklearn.ensemble import RandomForestClassifier
from xgboost import XGBClassifier
from sklearn.metrics import confusion_matrix, accuracy_score, f1_score
1.2.2 读取数据,删除无用的Time列
- 关于数据: 我们将要使用的数据是 Kaggle 信用卡欺诈检测数据集。它包含特征 V1 到 V28,是 PCA 获得的主要成分,并忽略对构建模型没有用的时间特征。
- 其余的特征是包含交易总金额的"金额"特征和包含交易是否为欺诈案件的"类别"特征,类别0标识欺诈,类别1表示正常。
df = pd.read_csv(r'../creditcard.csv')
print("Data's columns contain:\n", df.columns)
print("Data shape:\n", df.shape)
df.drop('Time', axis=1, inplace=True)
pd.set_option('display.max_columns', df.shape[1])
print(df.head())
''' Data's columns contain: Index(['Time', 'V1', 'V2', 'V3', 'V4', 'V5', 'V6', 'V7', 'V8', 'V9', 'V10', 'V11', 'V12', 'V13', 'V14', 'V15', 'V16', 'V17', 'V18', 'V19', 'V20', 'V21', 'V22', 'V23', 'V24', 'V25', 'V26', 'V27', 'V28', 'Amount', 'Class'], dtype='object') Data shape: (284807, 31) V1 V2 V3 V4 V5 V6 V7 \ 0 -1.359807 -0.072781 2.536347 1.378155 -0.338321 0.462388 0.239599 1 1.191857 0.266151 0.166480 0.448154 0.060018 -0.082361 -0.078803 2 -1.358354 -1.340163 1.773209 0.379780 -0.503198 1.800499 0.791461 3 -0.966272 -0.185226 1.792993 -0.863291 -0.010309 1.247203 0.237609 4 -1.158233 0.877737 1.548718 0.403034 -0.407193 0.095921 0.592941 V8 V9 V10 V11 V12 V13 V14 \ 0 0.098698 0.363787 0.090794 -0.551600 -0.617801 -0.991390 -0.311169 1 0.085102 -0.255425 -0.166974 1.612727 1.065235 0.489095 -0.143772 2 0.247676 -1.514654 0.207643 0.624501 0.066084 0.717293 -0.165946 3 0.377436 -1.387024 -0.054952 -0.226487 0.178228 0.507757 -0.287924 4 -0.270533 0.817739 0.753074 -0.822843 0.538196 1.345852 -1.119670 V15 V16 V17 V18 V19 V20 V21 \ 0 1.468177 -0.470401 0.207971 0.025791 0.403993 0.251412 -0.018307 1 0.635558 0.463917 -0.114805 -0.183361 -0.145783 -0.069083 -0.225775 2 2.345865 -2.890083 1.109969 -0.121359 -2.261857 0.524980 0.247998 3 -0.631418 -1.059647 -0.684093 1.965775 -1.232622 -0.208038 -0.108300 4 0.175121 -0.451449 -0.237033 -0.038195 0.803487 0.408542 -0.009431 V22 V23 V24 V25 V26 V27 V28 \ 0 0.277838 -0.110474 0.066928 0.128539 -0.189115 0.133558 -0.021053 1 -0.638672 0.101288 -0.339846 0.167170 0.125895 -0.008983 0.014724 2 0.771679 0.909412 -0.689281 -0.327642 -0.139097 -0.055353 -0.059752 3 0.005274 -0.190321 -1.175575 0.647376 -0.221929 0.062723 0.061458 4 0.798278 -0.137458 0.141267 -0.206010 0.502292 0.219422 0.215153 Amount Class 0 149.62 0 1 2.69 0 2 378.66 0 3 123.50 0 4 69.99 0 '''
1.2.3 探索性数据分析及数据预处理
cases = len(df)
nonfraud_cases = df[df.Class == 0]  # 非欺诈
fraud_cases = df[df.Class == 1]  # 欺诈
fraud_percentage = round(len(nonfraud_cases) / cases * 100, 2)
print(cl('CASE COUNT', attrs=['bold']))
print(cl('-' * 40, attrs=['bold']))
print(cl('Total number of cases are {}'.format(cases), attrs=['bold']))
print(cl('Number of Non-fraud cases are {}'.format(len(nonfraud_cases)), attrs=['bold']))
print(cl('Number of fraud cases are {}'.format(len(fraud_cases)), attrs=['bold']))
print(cl('Percentage of fraud cases is {}%'.format(fraud_percentage), attrs=['bold']))
print(cl('-' * 40, attrs=['bold']))
print(cl('CASE AMOUNT STATISTICS', attrs=['bold']))
print(cl('-' * 40, attrs=['bold']))
print(cl('NON-FRAUD CASE AMOUNT STATS', attrs=['bold']))
print(nonfraud_cases.Amount.describe())
print(cl('-' * 40, attrs=['bold']))
print(cl('FRAUD CASE AMOUNT STATS', attrs=['bold']))
print(fraud_cases.Amount.describe())
print(cl('-' * 40, attrs=['bold']))
# 通过查看,‘Amount’金额变化较大,需对其进行标准化
sc = StandardScaler()
amount = df.Amount.values
df.Amount = sc.fit_transform(amount.reshape(-1, 1))
print(cl(df.Amount.head(10), attrs=['bold']))
# 特征选择和数据集拆分
x = df.drop('Class', axis=1).values
y = df.Class.values
x_train, x_test, y_train, y_test = train_test_split(x, y, test_size=0.2, random_state=0)
''' CASE COUNT ---------------------------------------- Total number of cases are 284807 Number of Non-fraud cases are 284315 Number of fraud cases are 492 Percentage of fraud cases is 99.83% ---------------------------------------- CASE AMOUNT STATISTICS ---------------------------------------- NON-FRAUD CASE AMOUNT STATS count 284315.000000 mean 88.291022 std 250.105092 min 0.000000 25% 5.650000 50% 22.000000 75% 77.050000 max 25691.160000 Name: Amount, dtype: float64 ---------------------------------------- FRAUD CASE AMOUNT STATS count 492.000000 mean 122.211321 std 256.683288 min 0.000000 25% 1.000000 50% 9.250000 75% 105.890000 max 2125.870000 Name: Amount, dtype: float64 ---------------------------------------- 0 0.244964 1 -0.342475 2 1.160686 3 0.140534 4 -0.073403 5 -0.338556 6 -0.333279 7 -0.190107 8 0.019392 9 -0.338516 Name: Amount, dtype: float64'''
1.2.4 构建六类分类模型
- Decision Tree
tree_model = DecisionTreeClassifier(max_depth=4, criterion='entropy').fit(x_train, y_train)
tree_yhat = tree_model.predict(x_test)
- K-Nearest Neighbors
knn_model = KNeighborsClassifier(n_neighbors=5).fit(x_train, y_train)
knn_yhat = knn_model.predict(x_test)
- Logistic Regression
lr_model = LogisticRegression().fit(x_train, y_train)
lr_yhat = lr_model.predict(x_test)
- SVM
svm_model = SVC().fit(x_train, y_train)
svm_yhat = svm_model.predict(x_test)
- Random Forest Tree
rf_model = RandomForestClassifier(max_depth=4).fit(x_train, y_train)
rf_yhat = rf_model.predict(x_test)
- XGBoost
xgb_model = XGBClassifier(max_depth=4).fit(x_train, y_train)
xgb_yhat = xgb_model.predict(x_test)
1.2.5 用评估指标评估创建的分类模型
- 准确率
print(cl('-' * 40, attrs=['bold']))
print(cl('ACCURACY SCORE', attrs=['bold']))
print(cl('Accuracy score of the Decision Tree model is {}'.format(round(accuracy_score(y_test, tree_yhat), 4)),
         attrs=['bold']))
print(cl('Accuracy score of the knn model is {}'.format(round(accuracy_score(y_test, knn_yhat), 4)), attrs=['bold']))
print(cl('Accuracy score of the Logistic Regression model is {}'.format(round(accuracy_score(y_test, lr_yhat), 4)),
         attrs=['bold']))
print(cl('Accuracy score of the SVM model is {}'.format(round(accuracy_score(y_test, svm_yhat), 4)), attrs=['bold']))
print(cl('Accuracy score of the Random Forest model is {}'.format(round(accuracy_score(y_test, rf_yhat), 4)),
         attrs=['bold']))
print(
    cl('Accuracy score of the XGBoost model is {}'.format(round(accuracy_score(y_test, xgb_yhat), 4)), attrs=['bold']))
''' ACCURACY SCORE Accuracy score of the Decision Tree model is 0.9994 Accuracy score of the knn model is 0.9995 Accuracy score of the Logistic Regression model is 0.9992 Accuracy score of the SVM model is 0.9993 Accuracy score of the Random Forest model is 0.9993 Accuracy score of the XGBoost model is 0.9995 '''
- F1值
print(cl('-' * 40, attrs=['bold']))
print(cl('F1 SCORE', attrs=['bold']))
print(cl('F1 score of the Decision Tree model is {}'.format(round(f1_score(y_test, tree_yhat), 4)), attrs=['bold']))
print(cl('F1 score of the knn model is {}'.format(round(f1_score(y_test, knn_yhat), 4)), attrs=['bold']))
print(cl('F1 score of the Logistic Regression model is {}'.format(round(f1_score(y_test, lr_yhat), 4)), attrs=['bold']))
print(cl('F1 score of the SVM model is {}'.format(round(f1_score(y_test, svm_yhat), 4)), attrs=['bold']))
print(cl('F1 score of the Random Forest model is {}'.format(round(f1_score(y_test, rf_yhat), 4)), attrs=['bold']))
print(cl('F1 score of the XGBoost model is {}'.format(round(f1_score(y_test, xgb_yhat), 4)), attrs=['bold']))
''' F1 SCORE F1 score of the Decision Tree model is 0.8105 F1 score of the knn model is 0.8571 F1 score of the Logistic Regression model is 0.7356 F1 score of the SVM model is 0.7771 F1 score of the Random Forest model is 0.7657 F1 score of the XGBoost model is 0.8449 '''
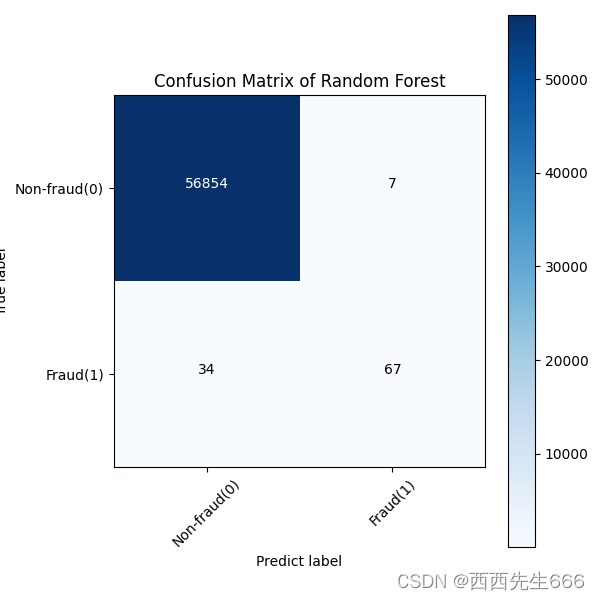
- 混淆矩阵
def plot_confusion_matrix(cm, classes, title, cmap=plt.cm.Blues):
    title = 'Confusion Matrix of {}'.format(title)
    plt.imshow(cm, cmap=cmap)
    plt.title(title)
    plt.colorbar()
    marks = np.arange(len(classes))
    plt.xticks(marks, classes, rotation=45)
    plt.yticks(marks, classes)
    thresh = cm.max() / 2
    for i, j in itertools.product(range(cm.shape[0]), range(cm.shape[1])):  # 笛卡尔积
        plt.text(j, i, format(cm[i, j], 'd'), horizontalalignment='center',
                 color='white' if cm[i, j] > thresh else 'black')
        """ 设置文字说明 plt.text(x,y,string,fontsize=15,verticalalignment="top",horizontalalignment="right") 参数: x,y:表示坐标值上的值 string:表示说明文字 fontsize:表示字体大小 verticalalignment:垂直对齐方式 ,参数:[ ‘center’ | ‘top’ | ‘bottom’ | ‘baseline’ ] horizontalalignment:水平对齐方式 ,参数:[ ‘center’ | ‘right’ | ‘left’ ] """
    plt.tight_layout()
    plt.ylabel('True label')
    plt.xlabel('Predict label')

# 计算混淆矩阵
tree_matrix = confusion_matrix(y_test, tree_yhat, labels=[0, 1])
knn_matrix = confusion_matrix(y_test, knn_yhat, labels=[0, 1])
lr_matrix = confusion_matrix(y_test, lr_yhat, labels=[0, 1])
svm_matrix = confusion_matrix(y_test, svm_yhat, labels=[0, 1])
rf_matrix = confusion_matrix(y_test, rf_yhat, labels=[0, 1])
xgb_matrix = confusion_matrix(y_test, xgb_yhat, labels=[0, 1])
# 通过rc配置文件来自定义图形的各种默认属性
plt.rcParams['figure.figsize'] = (6, 6)
classes = ['Non-fraud(0)', 'Fraud(1)']
tree_cm_plot = plot_confusion_matrix(tree_matrix,classes =classes, title='Decision Tree')
plt.savefig('tree_cm_plot.png')
plt.show()
图中横坐标是predict label,纵坐标是true label;
knn_cm_plot = plot_confusion_matrix(knn_matrix,classes =classes, title='KNN')
plt.savefig('knn_cm_plot.png')
plt.show()

lr_cm_plot = plot_confusion_matrix(lr_matrix,classes =classes, title='Logistic Regression')
plt.savefig('lr_cm_plot.png')
plt.show()

svm_cm_plot = plot_confusion_matrix(svm_matrix,classes =classes, title='SVM')
plt.savefig('svm_cm_plot.png')
plt.show()

rf_cm_plot = plot_confusion_matrix(rf_matrix,classes =classes, title='Random Forest')
plt.savefig('rf_cm_plot.png')
plt.show()
xgb_cm_plot = plot_confusion_matrix(xgb_matrix,classes =classes, title='XGBoost')
plt.savefig('xgb_cm_plot.png')
plt.show()

边栏推荐
- Method of test case design: introduction, trial recruit, preliminary exploration of equivalence boundary
- Matlab drawing
- AcWing. 102 best cattle fence
- Comprehensive evaluation and decision-making method
- 1. Mx6u-alpha development board (GPIO interrupt experiment)
- P-norm (2-norm is Euclidean norm)
- [Reading Notes - > data analysis] Introduction to BDA textbook data analysis
- Overview of wavelet packet transform methods
- Acwing刷题
- [in depth study of 4g/5g/6g topic-42]: urllc-13 - in depth interpretation of 3GPP urllc related protocols, specifications and technical principles -7-low delay technology-1-subcarrier spacing expansio
猜你喜欢

Wechat applet to realize music player (4) (use pubsubjs to realize inter page communication)

Retail chain store cashier system source code management commodity classification function logic sharing

座椅/安全配置升级 新款沃尔沃S90行政体验到位了吗

当你尝试删除程序中所有烂代码时 | 每日趣闻

Inventory the concept, classification and characteristics of cloud computing
1. Mx6u-alpha development board (main frequency and clock configuration experiment)

Soft simulation rasterization renderer

文献|关系研究能得出因果性结论吗

Overview of wavelet packet transform methods

VM virtual machine has no un bridged host network adapter, unable to restore the default configuration
随机推荐
makefile知识再整理(超详细)
红星美凯龙高负债之下,盯上新能源了?
Communication protocol and message format between microservices
PathMatchingResourcePatternResolver解析配置文件 资源文件
2.9.4 Ext JS的布尔对象类型处理及便捷方法
[Reading Notes - > data analysis] Introduction to BDA textbook data analysis
工程师如何对待开源 --- 一个老工程师的肺腑之言
Pits encountered by sdl2 OpenGL
如何构建面向海量数据、高实时要求的企业级OLAP数据引擎?
Huawei issued another global convening order of "genius youth", and some people once gave up their annual salary of 3.6 million to join
Soft simulation rasterization renderer
Working ideas of stability and high availability guarantee
Functions of anonymous functions
匿名函数的作用
I.MX6U-ALPHA开发板(主频和时钟配置实验)
SEGGER Embedded Studio找不到xxx.c或者xxx.h文件
Linear basis property function code to achieve 3000 words detailed explanation, with examples
生活相关——减少期待,更快乐
Lua and go mixed call debugging records support cross platform (implemented through C and luajit)
Comprehensive evaluation and decision-making method