当前位置:网站首页>MATLAB中tiledlayout函数使用
MATLAB中tiledlayout函数使用
2022-07-04 12:51:00 【jk_101】
目录
tiledlayout函数的功能是创建分块图布局。
语法
tiledlayout(m,n)
tiledlayout('flow')
tiledlayout(___,Name,Value)
tiledlayout(parent,___)
t = tiledlayout(___)
说明
tiledlayout(m,n) 创建分块图布局,用于显示当前图窗中的多个绘图。该布局有固定的 m×n 图块排列,最多可显示 m*n 个绘图。如果没有图窗,MATLAB 会创建一个图窗并将布局放入其中。如果当前图窗包含一个现有坐标区或布局,MATLAB 会将其替换为新布局。
分块图布局包含覆盖整个图窗或父容器的不可见图块网格。每个图块可以包含一个用于显示绘图的坐标区。创建布局后,调用 nexttile 函数以将坐标区对象放置到布局中。然后调用绘图函数在该坐标区中绘图。
tiledlayout('flow') 指定布局的 'flow' 图块排列。最初,只有一个空图块填充整个布局。当您调用 nexttile 时,布局都会根据需要进行调整以适应新坐标区,同时保持所有图块的纵横比约为 4:3。
tiledlayout(___,Name,Value) 使用一个或多个名称-值对组参数指定布局的其他选项。请在所有其他输入参数之后指定这些选项。例如,tiledlayout(2,2,'TileSpacing','compact') 创建一个 2×2 布局,图块之间采用最小间距。有关属性列表,请参阅 TiledChartLayout 属性。
tiledlayout(parent,___) 在指定的父容器中而不是在当前图窗中创建布局。请在所有其他输入参数之前指定父容器。
t = tiledlayout(___) 返回 TiledChartLayout 对象。创建布局后,使用 t 配置布局的属性。
示例
创建 2×2 布局
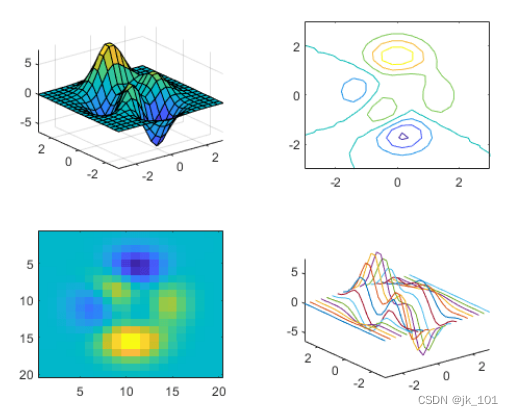
创建一个 2×2 分块图布局,并调用 peaks 函数以获取预定义曲面的坐标。通过调用 nexttile 函数,在第一个图块中创建一个坐标区对象。然后调用 surf 函数以在坐标区中绘图。对其他三个图块使用不同绘图函数重复该过程。
tiledlayout(2,2);
[X,Y,Z] = peaks(20);

% Tile 1
nexttile
surf(X,Y,Z)

% Tile 2
nexttile
contour(X,Y,Z)

% Tile 3
nexttile
imagesc(Z)

% Tile 4
nexttile
plot3(X,Y,Z)
如图所示:
指定流式图块排列
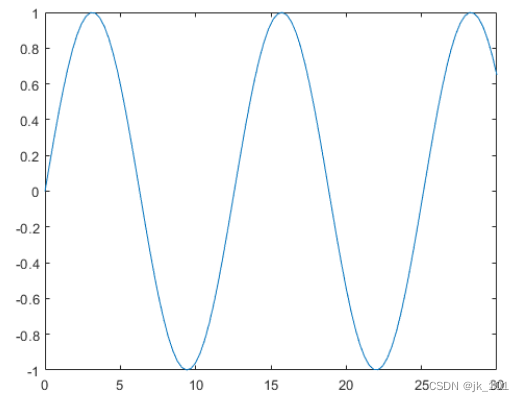
创建四个坐标向量:x、y1、y2 和 y3。用 'flow' 参数调用 tiledlayout 函数,以创建可容纳任意数量的坐标区的分块图布局。调用 nexttile 函数以创建第一个坐标区。然后在第一个图块中绘制 y1。第一个图填充整个布局。
x = linspace(0,30);
y1 = sin(x/2);
y2 = sin(x/3);
y3 = sin(x/4);

% Plot into first tile three times
tiledlayout('flow')
nexttile
plot(x,y1)
如图所示:
创建第二个图块和坐标区,并绘制到坐标区中。
nexttile
plot(x,y2)
如图所示:
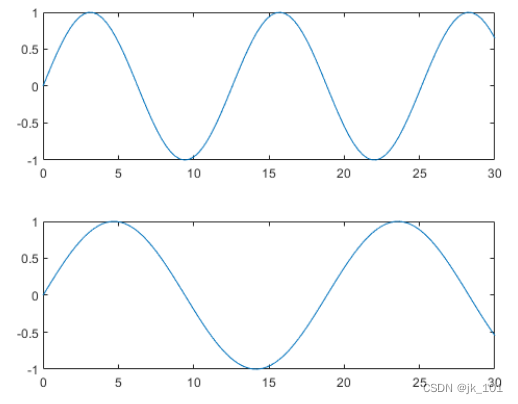
重复该过程以创建第三个绘图。
nexttile
plot(x,y3)
如图所示:

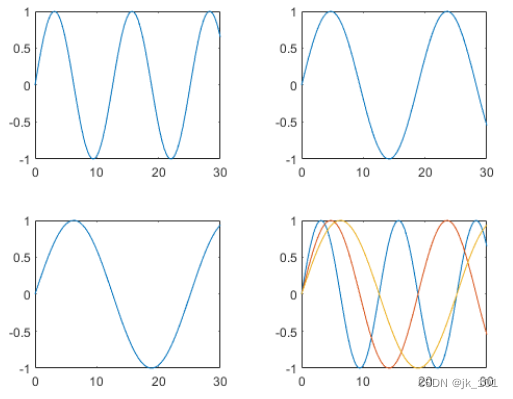
重复该过程以创建第四个绘图。这次,通过在绘制 y1 后调用 hold on 在同一坐标区中绘制全部三条线。
nexttile
plot(x,y1)
hold on
plot(x,y2)
plot(x,y3)
hold off
如图所示:
调整布局间距
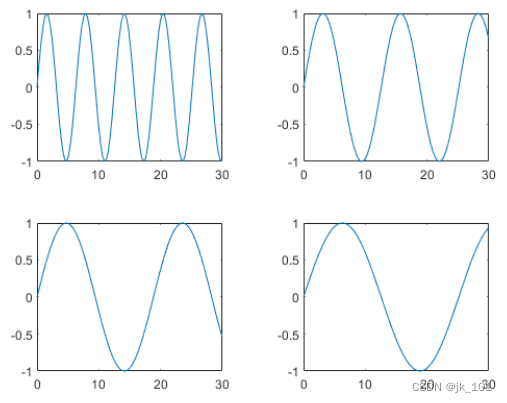
创建五个坐标向量:x、y1、y2、y3 和 y4。然后调用 tiledlayout 函数来创建 2×2 布局,并指定返回参数来存储 TileChartLayout 对象。在调用 plot 函数之前,调用 nexttile 函数以在下一个空图块中创建坐标区对象。
x = linspace(0,30);
y1 = sin(x);
y2 = sin(x/2);
y3 = sin(x/3);
y4 = sin(x/4);
t = tiledlayout(2,2);

% Tile 1
nexttile
plot(x,y1)

% Tile 2
nexttile
plot(x,y2)

% Tile 3
nexttile
plot(x,y3)

% Tile 4
nexttile
plot(x,y4)
如图所示:
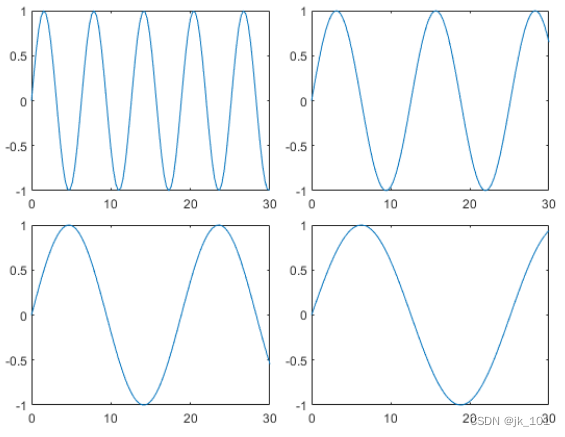
通过将 TileSpacing 属性设置为 'compact' 来减小图块的间距。然后通过将 Padding 属性设置为 'compact',减小布局边缘和图窗边缘之间的空间。
t.TileSpacing = 'compact';
t.Padding = 'compact';
如图所示:
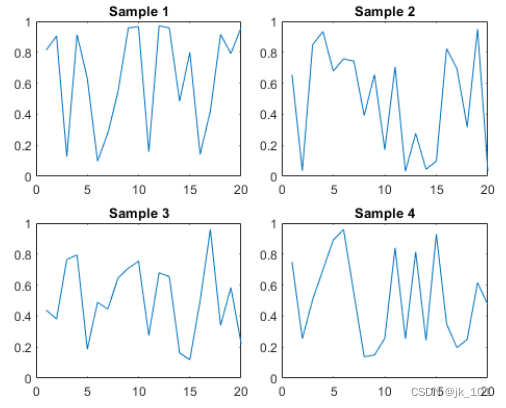
创建共享标题和轴标签
创建一个 2×2 分块图布局 t。指定 TileSpacing 名称-值对组参数,以最小化图块之间的空间。然后在每个图块中创建一个带标题的绘图。
t = tiledlayout(2,2,'TileSpacing','Compact');

% Tile 1
nexttile
plot(rand(1,20))
title('Sample 1')

% Tile 2
nexttile
plot(rand(1,20))
title('Sample 2')

% Tile 3
nexttile
plot(rand(1,20))
title('Sample 3')

% Tile 4
nexttile
plot(rand(1,20))
title('Sample 4')
如图所示:
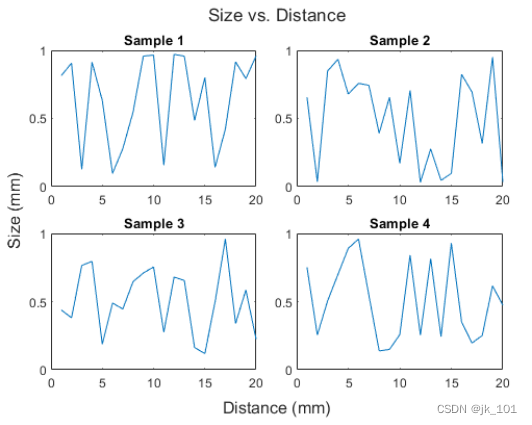
通过将 t 传递给 title、xlabel 和 ylabel 函数,显示共享标题和轴标签。
title(t,'Size vs. Distance')
xlabel(t,'Distance (mm)')
ylabel(t,'Size (mm)')
如图所示:
在面板中创建布局
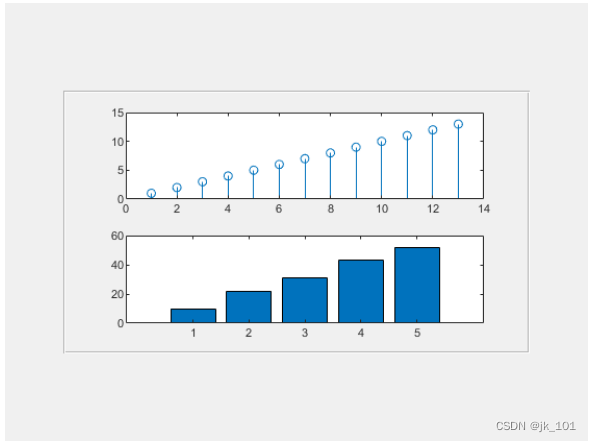
在图窗中创建一个面板。然后通过将面板对象指定为 tiledlayout 函数的第一个参数,在面板中创建一个分块图布局。在每个图块中显示一个绘图。
p = uipanel('Position',[.1 .2 .8 .6]);
t = tiledlayout(p,2,1);

% Tile 1
nexttile(t)
stem(1:13)

% Tile 2
nexttile(t)
bar([10 22 31 43 52])
如图所示:
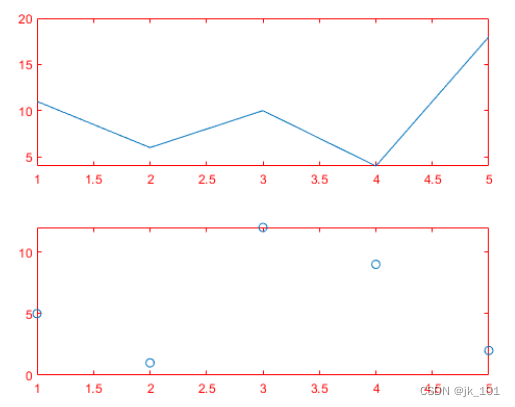
对坐标区设置属性
调用 tiledlayout 函数以创建 2×1 分块图布局。带一个输出参数调用 nexttile 函数以存储坐标区。然后绘制到坐标区中,并将 x 和 y 轴的颜色设置为红色。在第二个图块中重复该过程。
t = tiledlayout(2,1);

% First tile
ax1 = nexttile;
plot([1 2 3 4 5],[11 6 10 4 18]);
ax1.XColor = [1 0 0];
ax1.YColor = [1 0 0];

% Second tile
ax2 = nexttile;
plot([1 2 3 4 5],[5 1 12 9 2],'o');
ax2.XColor = [1 0 0];
ax2.YColor = [1 0 0];
如图所示:
创建占据多行和多列的坐标区
将 scores 和 strikes 定义为包含四场保龄球联赛数据的向量。然后创建一个分块图布局,并显示三个图块,分别显示每个团队的击球数量。
scores = [444 460 380
          387 366 500
          365 451 611
          548 412 452];

strikes = [9  6  5
           6  4  8
           4  7  16
           10 9  8];

t = tiledlayout('flow');

% Team 1
nexttile
plot([1 2 3 4],strikes(:,1),'-o')
title('Team 1 Strikes')

% Team 2
nexttile
plot([1 2 3 4],strikes(:,2),'-o')
title('Team 2 Strikes')

% Team 3
nexttile
plot([1 2 3 4],strikes(:,3),'-o')
title('Team 3 Strikes')
如图所示:

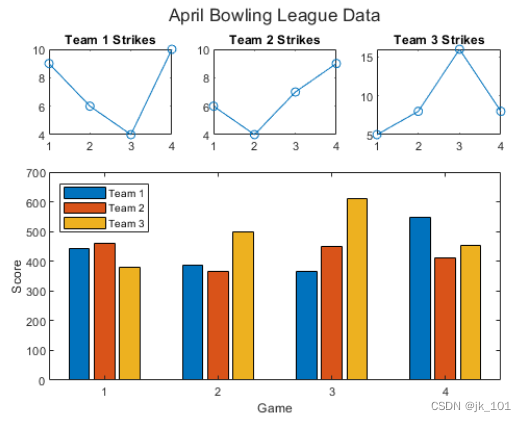
调用 nexttile 函数以创建占据两行三列的坐标区对象。然后在此坐标区中显示一个带图例的条形图,并配置轴刻度值和标签。调用 title 函数以向布局中添加一个图块。
nexttile([2 3]);
bar([1 2 3 4],scores)
legend('Team 1','Team 2','Team 3','Location','northwest')

% Configure ticks and axis labels
xticks([1 2 3 4])
xlabel('Game')
ylabel('Score')

% Add layout title
title(t,'April Bowling League Data')
如图所示:
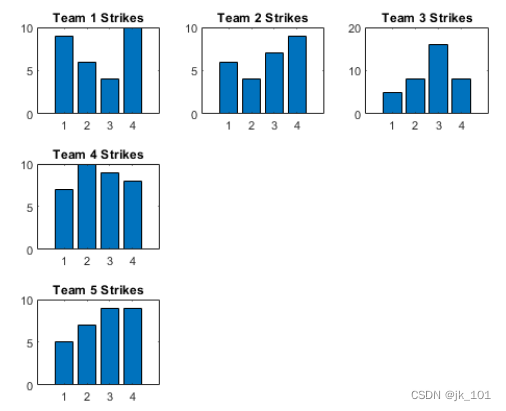
从特定编号的图块开始放置坐标区对象
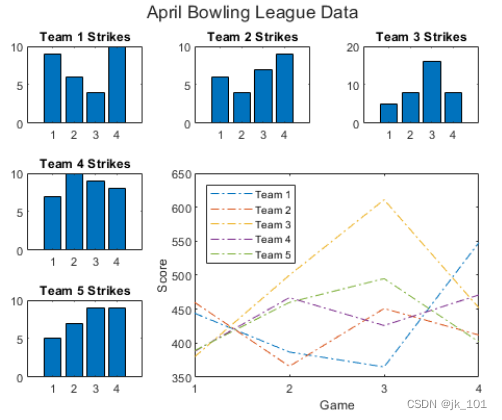
要从特定位置开始放置坐标区对象,请指定图块编号和跨度值。将 scores 和 strikes 定义为包含四场保龄球联赛数据的向量。然后创建一个 3×3 分块图布局,并显示五个条形图,其中显示每个团队的击球次数。
scores = [444 460 380 388 389
          387 366 500 467 460
          365 451 611 426 495
          548 412 452 471 402];

strikes = [9  6  5  7  5
           6  4  8 10  7
           4  7 16  9  9
           10  9  8  8  9];

t = tiledlayout(3,3);

% Team 1
nexttile
bar([1 2 3 4],strikes(:,1))
title('Team 1 Strikes')

% Team 2
nexttile
bar([1 2 3 4],strikes(:,2))
title('Team 2 Strikes')

% Team 3
nexttile
bar([1 2 3 4],strikes(:,3))
title('Team 3 Strikes')

% Team 4
nexttile
bar([1 2 3 4],strikes(:,4))
title('Team 4 Strikes')

% Team 5
nexttile(7)
bar([1 2 3 4],strikes(:,5))
title('Team 5 Strikes')
如图所示:
显示一个带有图例的较大绘图。调用 nexttile 函数以将坐标区的左上角放在第五个图块中,并使坐标区占据图块的两行和两列。绘制所有团队的分数。将 x 轴配置为显示四个刻度,并为每个轴添加标签。然后在布局顶部添加一个共享标题。
nexttile(5,[2 2]);
plot([1 2 3 4],scores,'-.')
labels = {'Team 1','Team 2','Team 3','Team 4','Team 5'};
legend(labels,'Location','northwest')

% Configure ticks and axis labels
xticks([1 2 3 4])
xlabel('Game')
ylabel('Score')

% Add layout title
title(t,'April Bowling League Data')
如图所示:
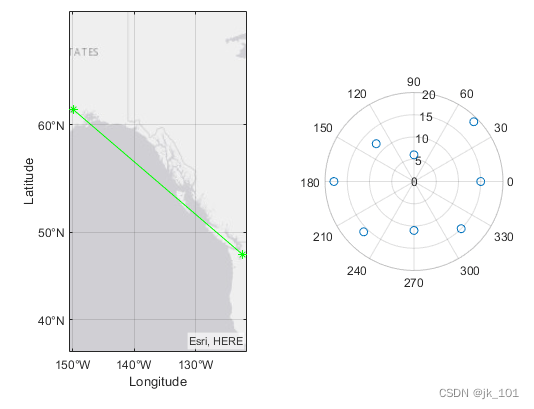
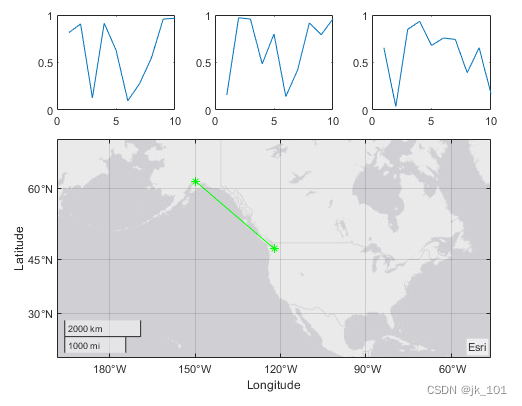
显示极坐标图和地理图
创建 1×2 分块图布局。在第一个图块中,显示包含连接地图上两个城市的线的地理图。在第二个图块中,在极坐标中创建一个散点图。
tiledlayout(1,2)

% Display geographic plot
nexttile
geoplot([47.62 61.20],[-122.33 -149.90],'g-*')

% Display polar plot
nexttile
theta = pi/4:pi/4:2*pi;
rho = [19 6 12 18 16 11 15 15];
polarscatter(theta,rho)
如图所示:
重新配置上一个图块中的内容
nexttile 输出参数的一个有用的用途体现在您想调整前一个图块中的内容时。例如,您可能决定要重新配置先前绘图中使用的颜色图。
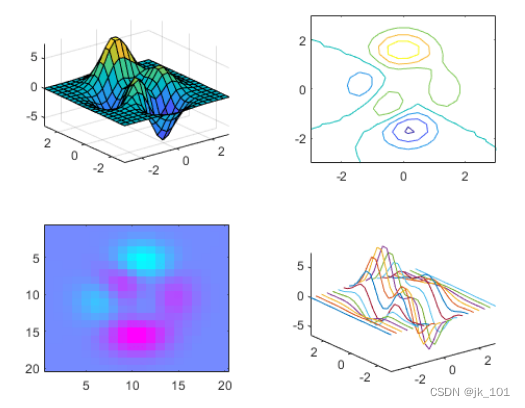
创建一个 2×2 分块图布局。调用 peaks 函数以获取预定义曲面的坐标。然后在每个图块中创建一个不同的曲面图。
tiledlayout(2,2);
[X,Y,Z] = peaks(20);

% Tile 1
nexttile
surf(X,Y,Z)

% Tile 2
nexttile
contour(X,Y,Z)

% Tile 3
nexttile
imagesc(Z)

% Tile 4
nexttile
plot3(X,Y,Z)
如图所示:
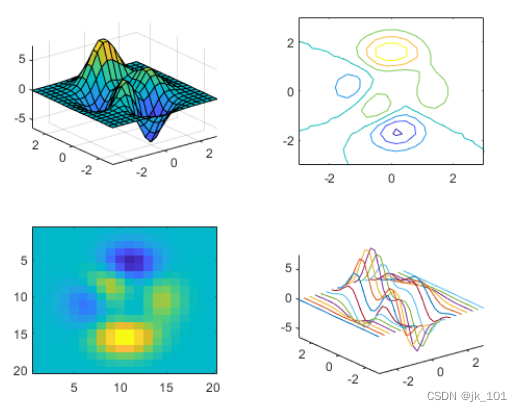
要更改第三个图块中的颜色图,请获取该图块中的坐标区。通过指定图块编号调用 nexttile 函数,并返回坐标区输出参数。然后将坐标区传递给 colormap 函数。
ax = nexttile(3);
colormap(ax,cool)
如图所示:
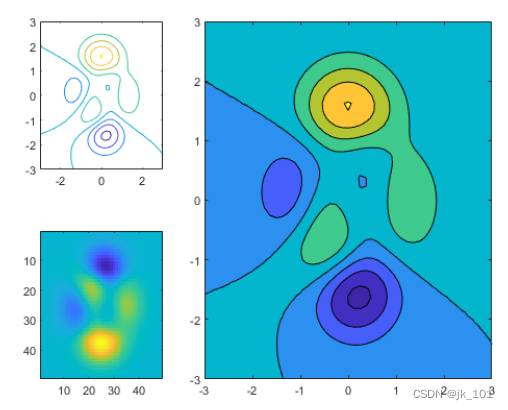
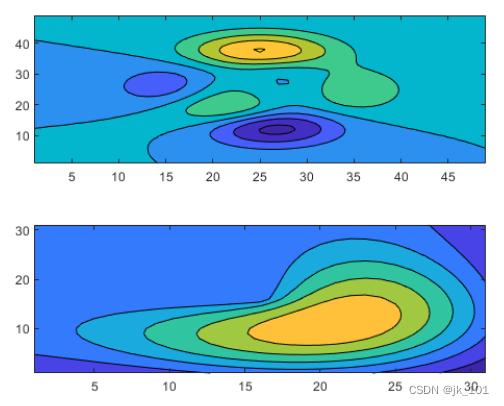
重新配置跨图块坐标区
创建一个 2×3 分块图布局,其中包含两个分别位于单独图块中的图,以及一个跨两行两列的图。
t = tiledlayout(2,3);
[X,Y,Z] = peaks;

% Tile 1
nexttile
contour(X,Y,Z)

% Span across two rows and columns
nexttile([2 2])
contourf(X,Y,Z)

% Last tile
nexttile
imagesc(Z)
如图所示:
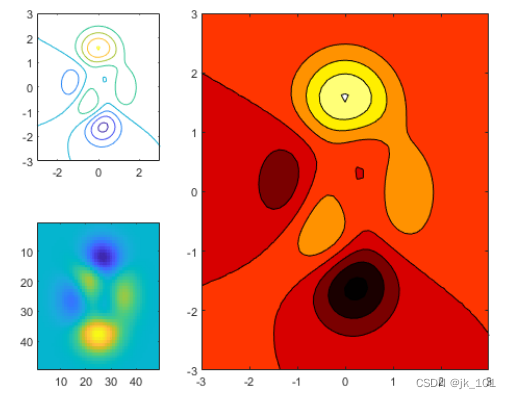
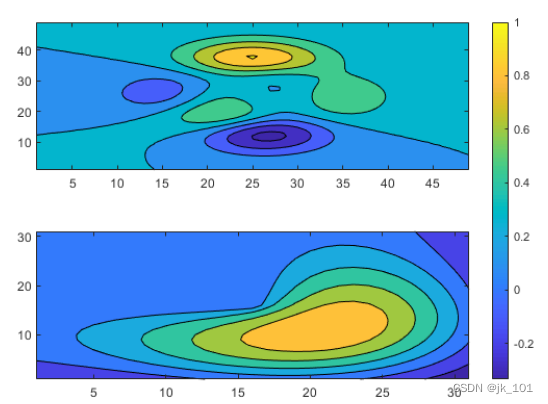
要更改跨图块坐标区的颜色图,请将图块位置标识为坐标区左上角图块所在的位置。在本例中,左上角在第二个图块中。使用 2 作为图块位置调用 nexttile 函数,并指定输出参数以返回该位置的坐标区对象。然后将坐标区传递给 colormap 函数。
ax = nexttile(2);
colormap(ax,hot)
如图所示:
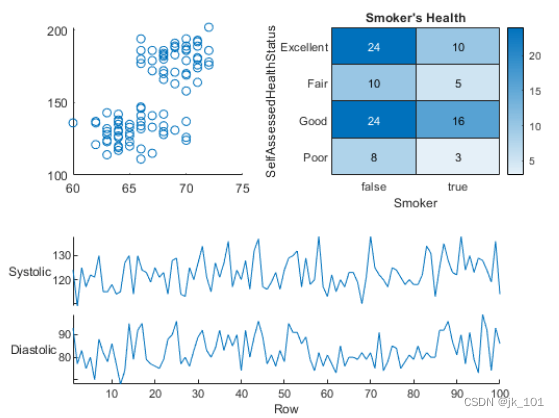
替换上一个图块中的内容
加载 patients 数据集,并基于变量子集创建一个表。然后创建一个 2×2 分块图布局。在第一个图块中显示散点图,在第二个图块中显示热图,并显示跨底部两个图块的堆叠图。
load patients
tbl = table(Diastolic,Smoker,Systolic,Height,Weight,SelfAssessedHealthStatus);
tiledlayout(2,2)

% Scatter plot
nexttile
scatter(tbl.Height,tbl.Weight)

% Heatmap
nexttile
heatmap(tbl,'Smoker','SelfAssessedHealthStatus','Title','Smoker''s Health');

% Stacked plot
nexttile([1 2])
stackedplot(tbl,{'Systolic','Diastolic'});
如图所示:
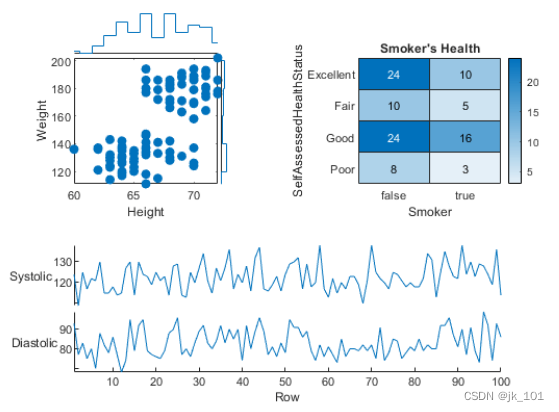
调用 nexttile,并将图块编号指定为 1 以使该图块中的坐标区成为当前坐标区。用散点直方图替换该图块的内容。
nexttile(1)
scatterhistogram(tbl,'Height','Weight');
如图所示:
在单独图块中显示共享颜色栏
当要在两个或多个图之间共享颜色栏或图例时,可以将其放置在一个单独图块中。在分块图布局中创建 peaks 和 membrane 数据集的填充等高线图。
Z1 = peaks;
Z2 = membrane;
tiledlayout(2,1);
nexttile
contourf(Z1)
nexttile
contourf(Z2)
如图所示:
添加一个颜色栏,并将其移至 east 图块。
cb = colorbar;
cb.Layout.Tile = 'east';
如图所示:
手动创建和配置坐标区
有时,可能需要在调用绘图函数之前手动创建坐标区。在创建坐标区时,请将 parent 参数指定为分块图布局。然后通过对坐标区设置 Layout 属性来定位坐标区。
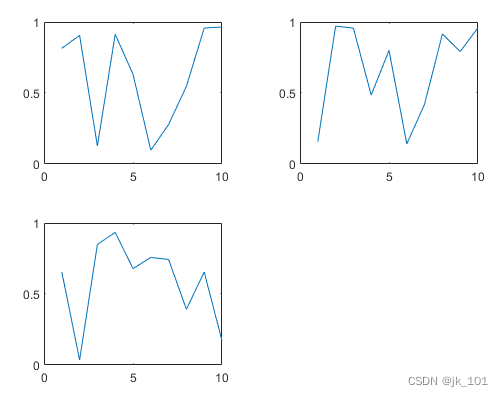
创建分块图布局 t 并指定 'flow' 图块排列。在前三个图块中各显示一个绘图。
t = tiledlayout('flow');
nexttile
plot(rand(1,10));
nexttile
plot(rand(1,10));
nexttile
plot(rand(1,10));
如图所示:
通过调用 geoaxes 函数创建一个地理坐标区对象 gax,并将 t 指定为 parent 参数。默认情况下,坐标区进入第一个图块,因此通过将 gax.Layout.Tile 设置为 4 将其移至第四个图块。通过将 gax.Layout.TileSpan 设置为 [2 3],使坐标区占据图块的 2×3 区域。
gax = geoaxes(t);
gax.Layout.Tile = 4;
gax.Layout.TileSpan = [2 3];
如图所示:
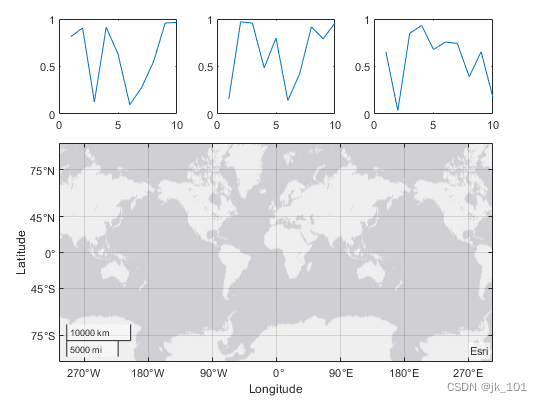
调用 geoplot 函数。然后为坐标区配置地图中心和缩放级别。
geoplot(gax,[47.62 61.20],[-122.33 -149.90],'g-*')
gax.MapCenter = [47.62 -122.33];
gax.ZoomLevel = 2;
如图所示:
输入参数说明
m - 行数
行数,指定为正整数。
n - 列数
列数,指定为正整数。
parent - 父容器
父容器,指定为 Figure、Panel、Tab、TiledChartLayout 或 GridLayout 对象。
名称-值参数
示例: tiledlayout(2,2,'TileSpacing','compact') 创建 2×2 布局,各图块之间采用最小间距。
指定可选的、以逗号分隔的 Name,Value 对组参数。Name 为参数名称,Value 为对应的值。Name 必须放在引号中。
可采用任意顺序指定多个名称-值对组参数,如 Name1,Value1,...,NameN,ValueN 所示。
TileSpacing - 图块间距
图块间距,指定为 'loose'、'compact'、'tight' 或 'none'。使用此属性控制图块之间的间距。
下表显示每个值如何影响 2×2 布局的外观。
| 值 | 外观 |
|---|---|
'loose' |
|
| 'compact' |
|
| 'tight' |
|
| 'none' |
|


Padding - 布局周围的补白
布局周围的填充,指定为 'loose'、'compact' 或 'tight'。不管此属性使用哪个值,布局都会为所有装饰元素(如轴标签)提供空间。
下表显示每个值如何影响 2×2 布局的外观。
| 值 | 外观 |
|---|---|
'loose' |
|
| 'compact' |
|
| 'tight' |
|


边栏推荐
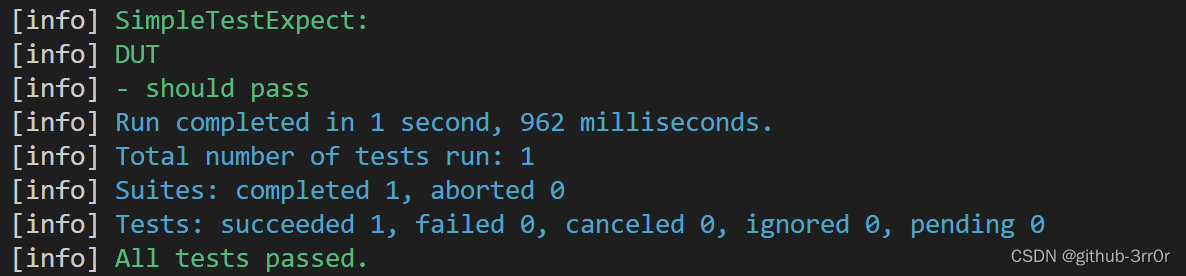
- TestSuite and testrunner in unittest
- Fs7867s is a voltage detection chip used for power supply voltage monitoring of digital system
- C# wpf 实现截屏框实时截屏功能
- 【R语言数据科学】:交叉验证再回首
- 硬件基础知识-二极管基础
- FS4059C是5V输入升压充电12.6V1.2A给三节锂电池充电芯片 输入小电流不会拉死,温度60°建议1000-1100MA
- Introducing testfixture into unittest framework
- [antd step pit] antd form cooperates with input Form The height occupied by item is incorrect
- 测试流程整理(2)
- Five "potential errors" in embedded programming
猜你喜欢
Understand chisel language thoroughly 09. Chisel project construction, operation and testing (I) -- build and run chisel project with SBT

Interviewer: what is the internal implementation of hash data type in redis?
Understand chisel language thoroughly 11. Chisel project construction, operation and test (III) -- scalatest of chisel test

德明利深交所上市:市值31亿 为李虎与田华夫妻档
【FAQ】華為帳號服務報錯 907135701的常見原因總結和解决方法

自主工业软件的创新与发展
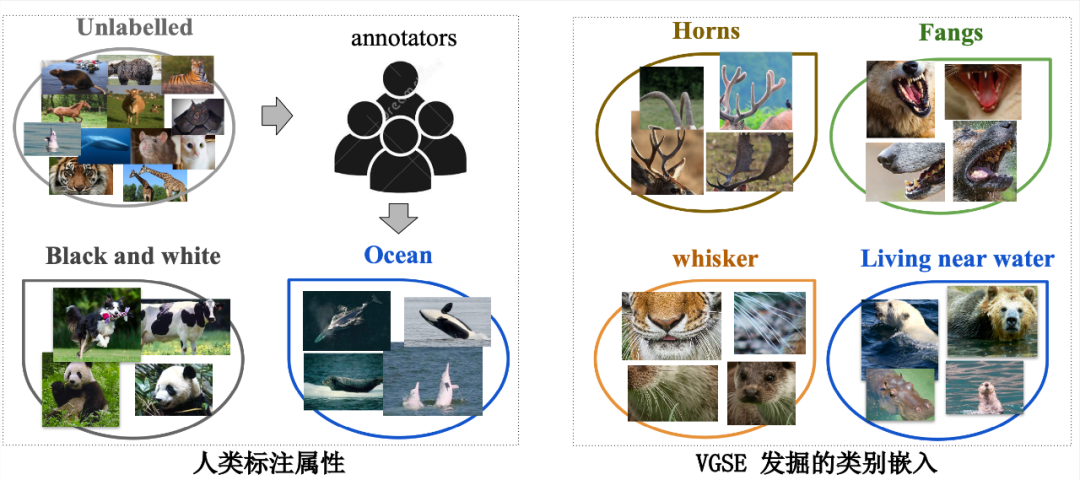
CVPR 2022 | greatly reduce the manual annotation required for zero sample learning, and propose category semantic embedding rich in visual information (source code download)
吃透Chisel语言.12.Chisel项目构建、运行和测试(四)——Chisel测试之ChiselTest
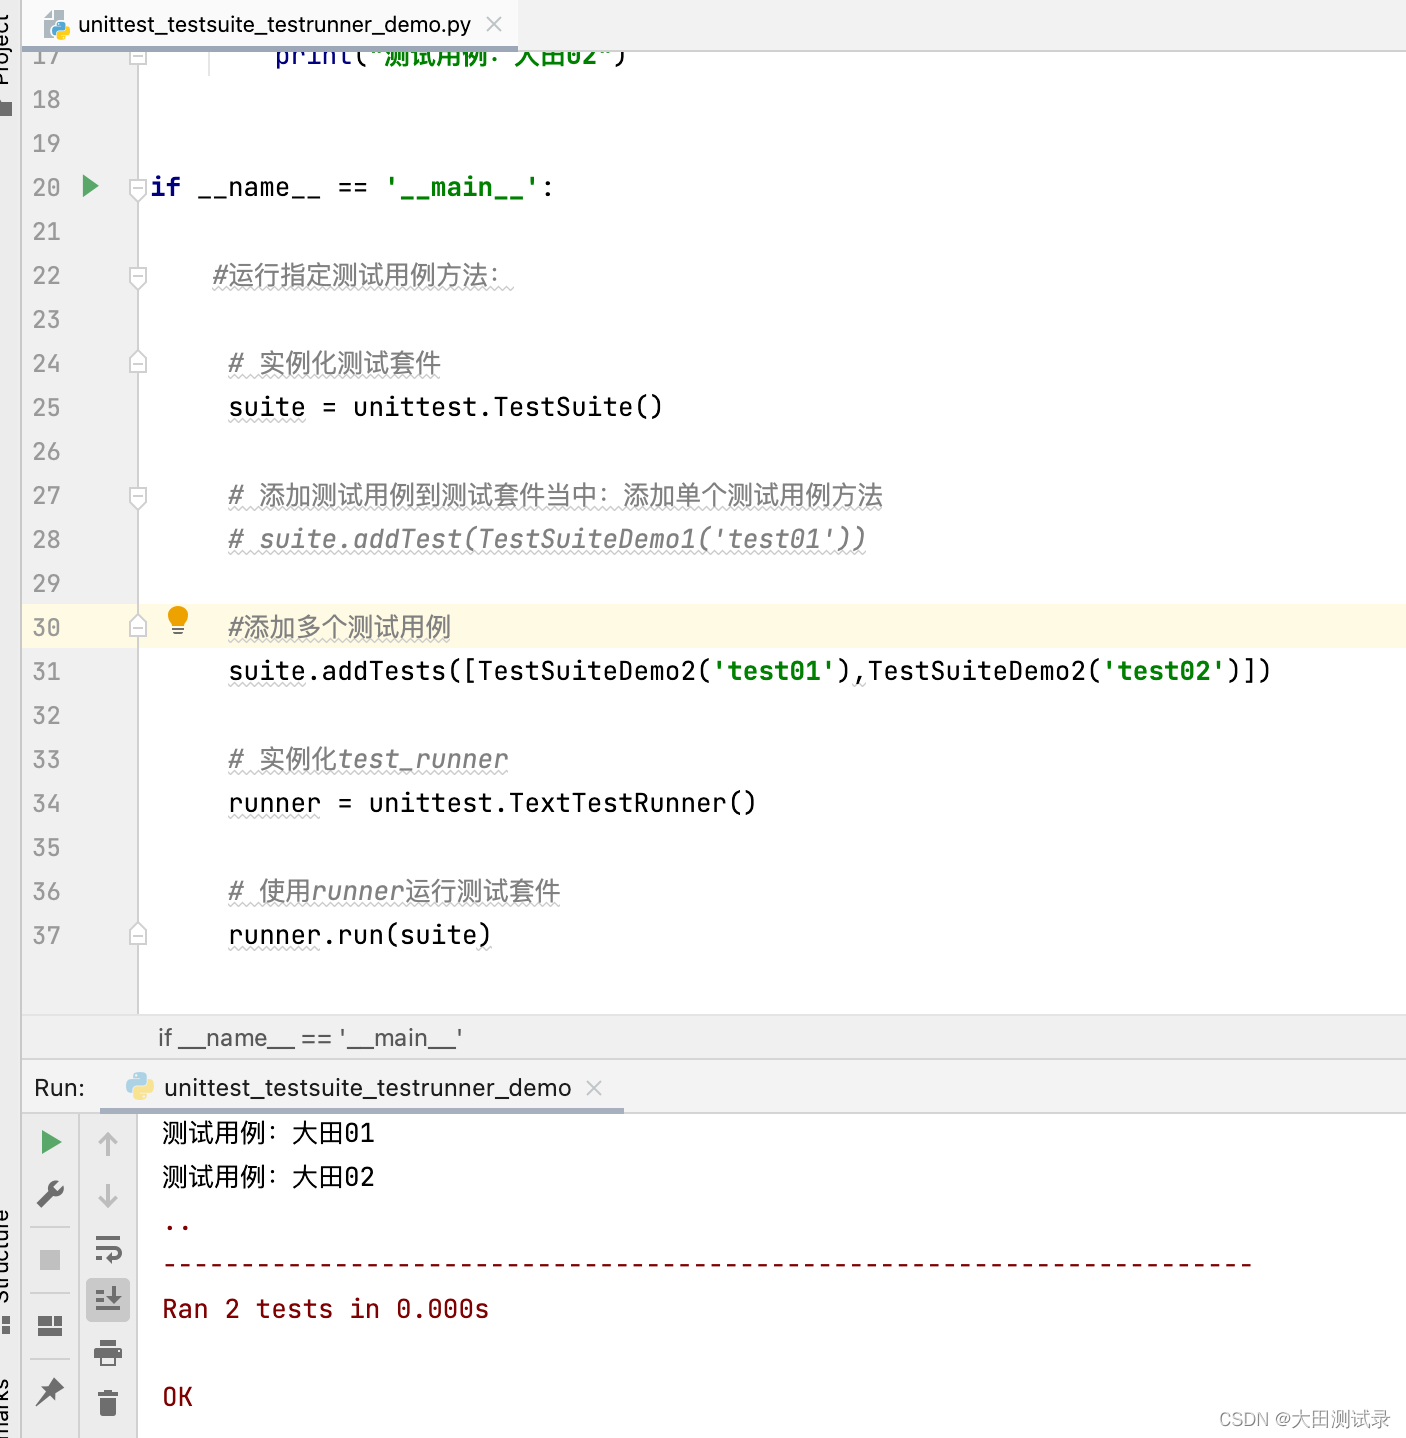
TestSuite and testrunner in unittest
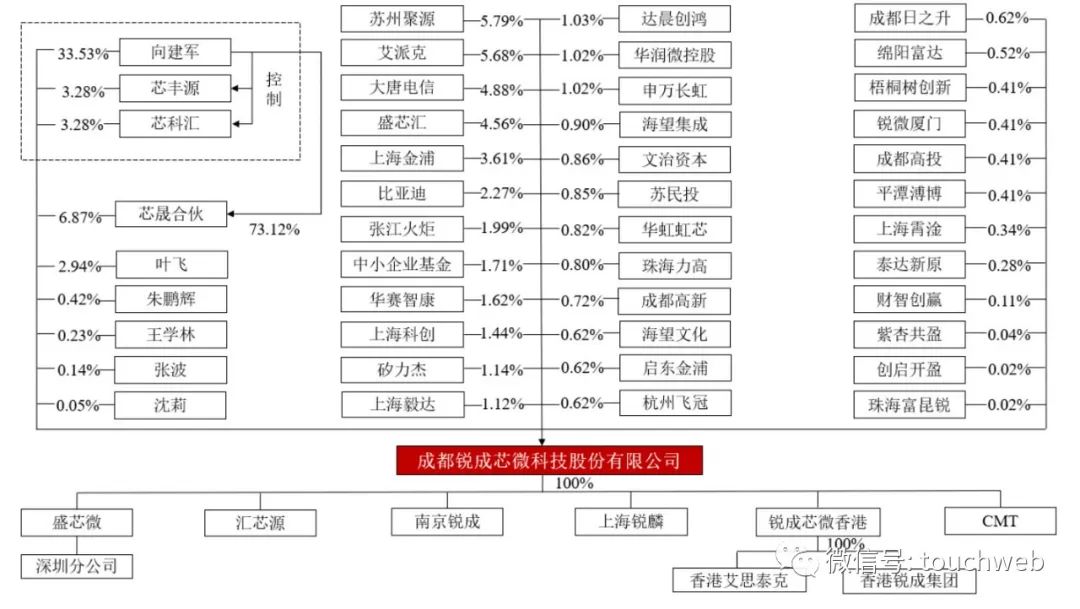
Ruichengxin micro sprint technology innovation board: annual revenue of 367million, proposed to raise 1.3 billion, Datang Telecom is a shareholder
随机推荐
程序员的焦虑
吃透Chisel语言.05.Chisel基础(二)——组合电路与运算符
Yingshi Ruida rushes to the scientific and Technological Innovation Board: the annual revenue is 450million and the proposed fund-raising is 979million
392. 判断子序列
What is the real meaning and purpose of doing things, and what do you really want
使用默认路由作为指向Internet的路由
Introducing testfixture into unittest framework
go vendor 项目迁移到 mod 项目
ARouter的使用
[FAQ] Huawei Account Service Error Report 907135701 Common reasons Summary and Solutions
英视睿达冲刺科创板:年营收4.5亿 拟募资9.79亿
TestSuite and testrunner in unittest
吃透Chisel语言.08.Chisel基础(五)——Wire、Reg和IO,以及如何理解Chisel生成硬件
中邮科技冲刺科创板:年营收20.58亿 邮政集团是大股东
R语言dplyr包summarise_if函数计算dataframe数据中所有数值数据列的均值和中位数、基于条件进行数据汇总分析(Summarize all Numeric Variables)
R语言使用epiDisplay包的followup.plot函数可视化多个ID(病例)监测指标的纵向随访图、使用stress.col参数指定强调线的id子集的颜色(色彩)
Gorm read / write separation (rotation)
China Post technology rushes to the scientific innovation board: the annual revenue is 2.058 billion, and the postal group is the major shareholder
Install MySQL
Ws2811 m is a special circuit for three channel LED drive and control, and the development of color light strip scheme