当前位置:网站首页>Financial risk control practice - decision tree rule mining template
Financial risk control practice - decision tree rule mining template
2022-07-07 05:58:00 【Grateful_ Dead424】
This data is the data of didi drivers using oil loans .
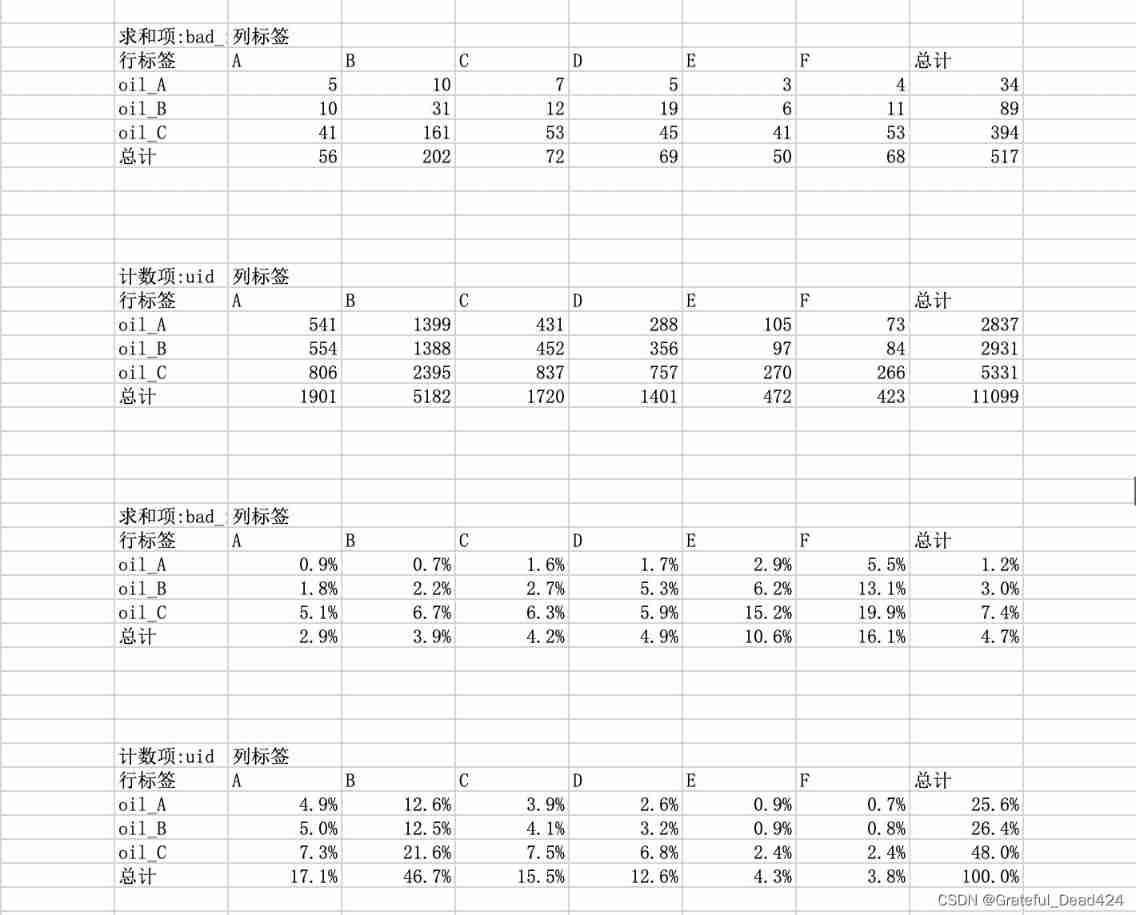
The bad debt rate of oil loan is as high as 5%, Very high , It must lose money . And can pass fraud detection .
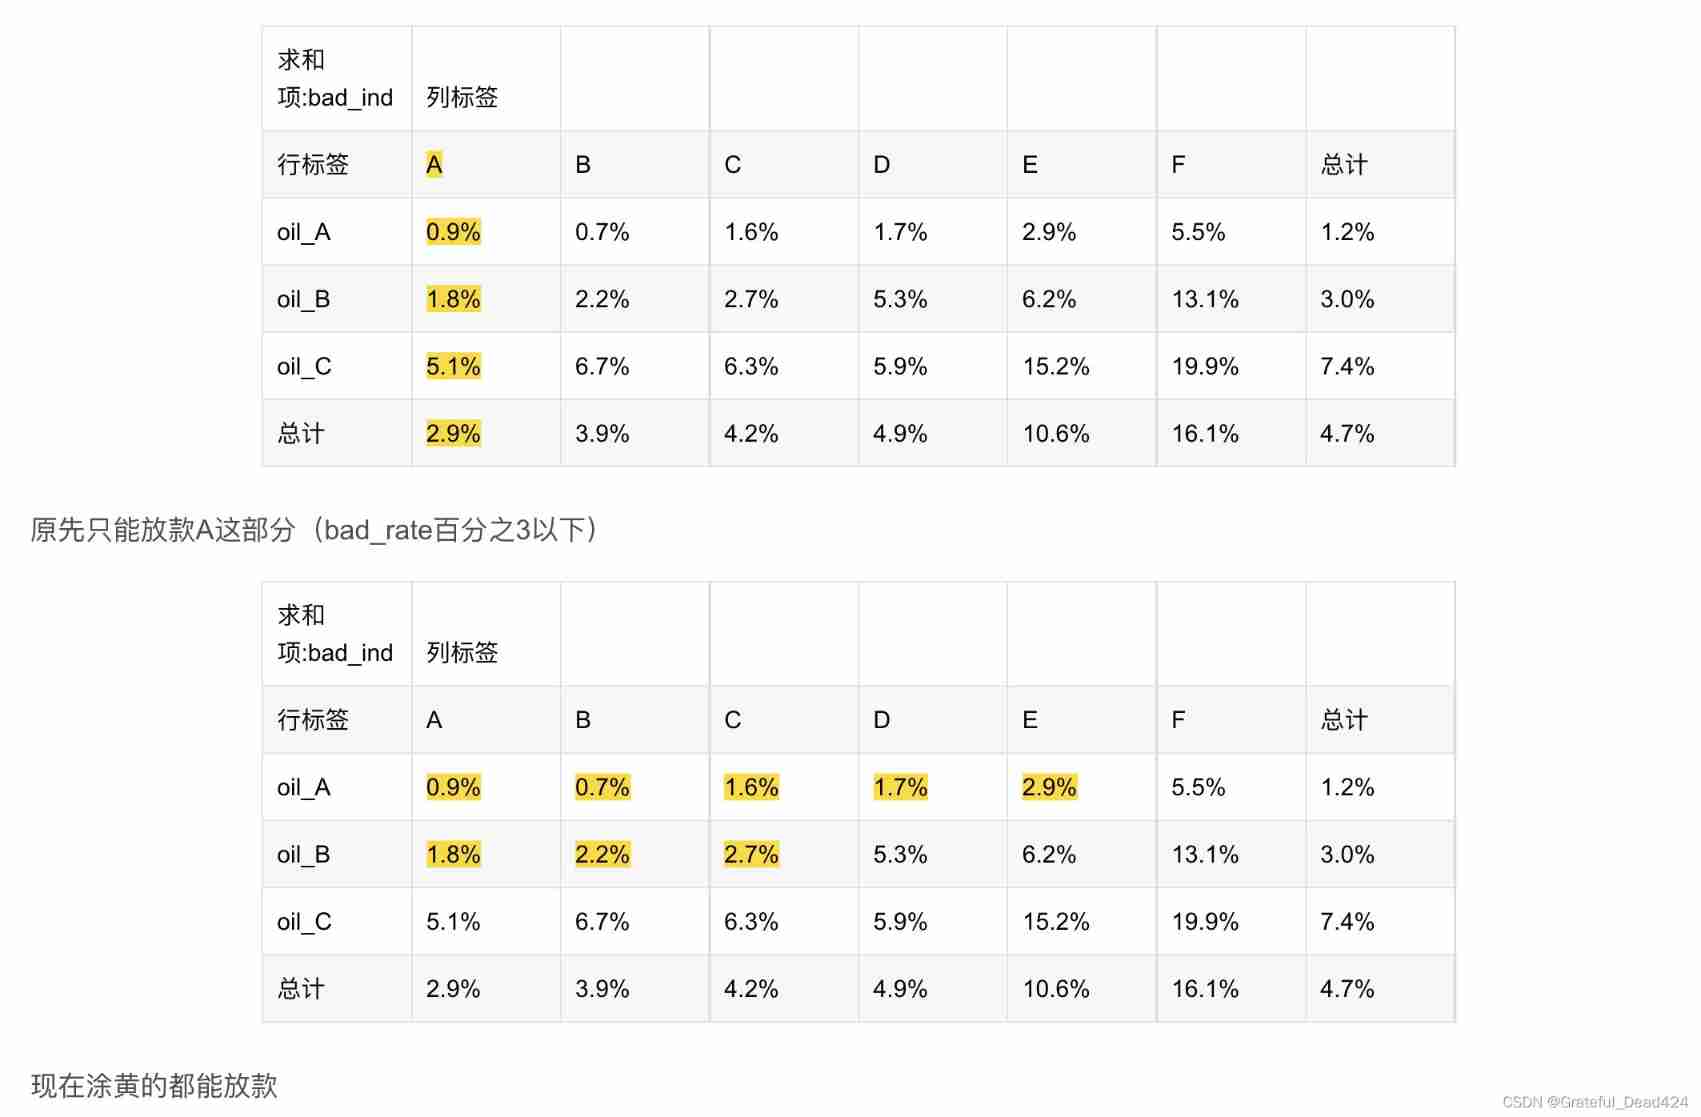
The drivers who come to apply for oil loan already have A Stuck. ,A The card is rated A-F. Originally, there was only F Non lending , But in the oil loan, only the rating is A Only by lending can we not lose money .
Didi cooperates with many gas stations , The gas station will provide didi with driver data .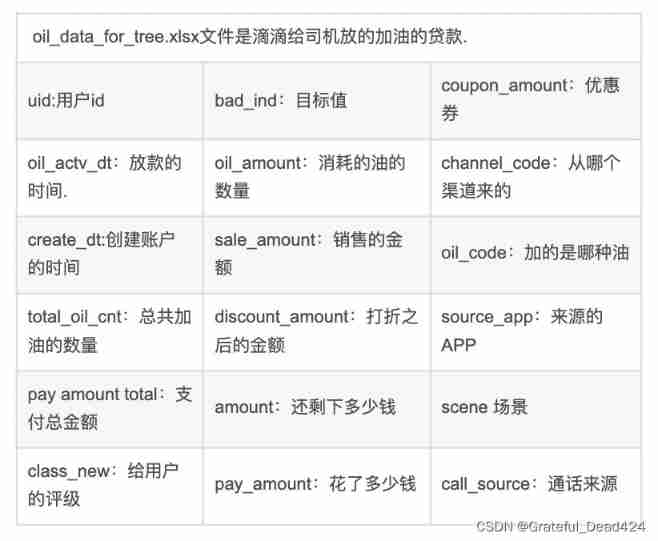
Import related packages
import pandas as pd
import numpy as np

# eliminate Warning
import warnings
warnings.filterwarnings("ignore")
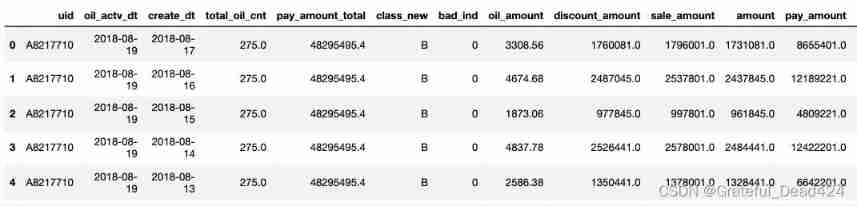
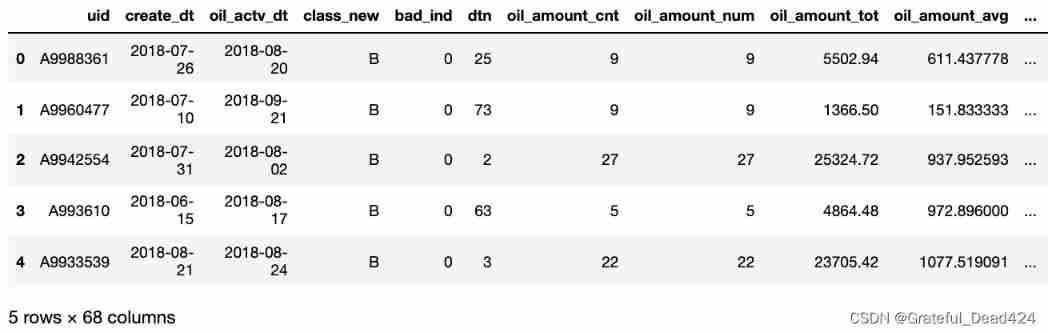
Read the oil data set
data = pd.read_excel("oil_data_for_tree.xlsx")
data.head()
View information about the data
set(data.class_new)
#{'A', 'B', 'C', 'D', 'E', 'F'}
Calculate the bad debt rate
set(data.bad_ind)
#{0, 1}
data.bad_ind.sum()/data.bad_ind.count()
#0.01776363887846035
The characteristics are divided into 3 class
- org_lst No special transformation is required , Direct weight removal
- agg_lst Numerical variables are aggregated
- dstc_lst Text variables do cnt
org_lst = ['uid','create_dt','oil_actv_dt','class_new','bad_ind']
agg_lst = ['oil_amount','discount_amount','sale_amount','amount','pay_amount','coupon_amount','payment_coupon_amount']
dstc_lst = ['channel_code','oil_code','scene','source_app','call_source']
Data reorganization
# Copy , Check for missing
df = data[org_lst].copy()
df[agg_lst] = data[agg_lst].copy()
df[dstc_lst] = data[dstc_lst].copy()
Check for missing
df.isna().sum()
#uid 0
#create_dt 4944
#oil_actv_dt 0
#class_new 0
#bad_ind 0
#oil_amount 4944
#discount_amount 4944
#sale_amount 4944
#amount 4944
#pay_amount 4944
#coupon_amount 4944
#payment_coupon_amount 4946
#channel_code 0
#oil_code 0
#scene 0
#source_app 0
#call_source 0
#dtype: int64
On features creat_dt To complete
Yes creat_dt Complete , use oil_actv_dt To fill , And intercept 6 Months of data .
When constructing variables, you cannot directly accumulate all historical data .
Otherwise, over time , The distribution of variables will vary greatly .
def time_isna(x,y):
if str(x) == "NaT":
x = y
else:
x = x
return x
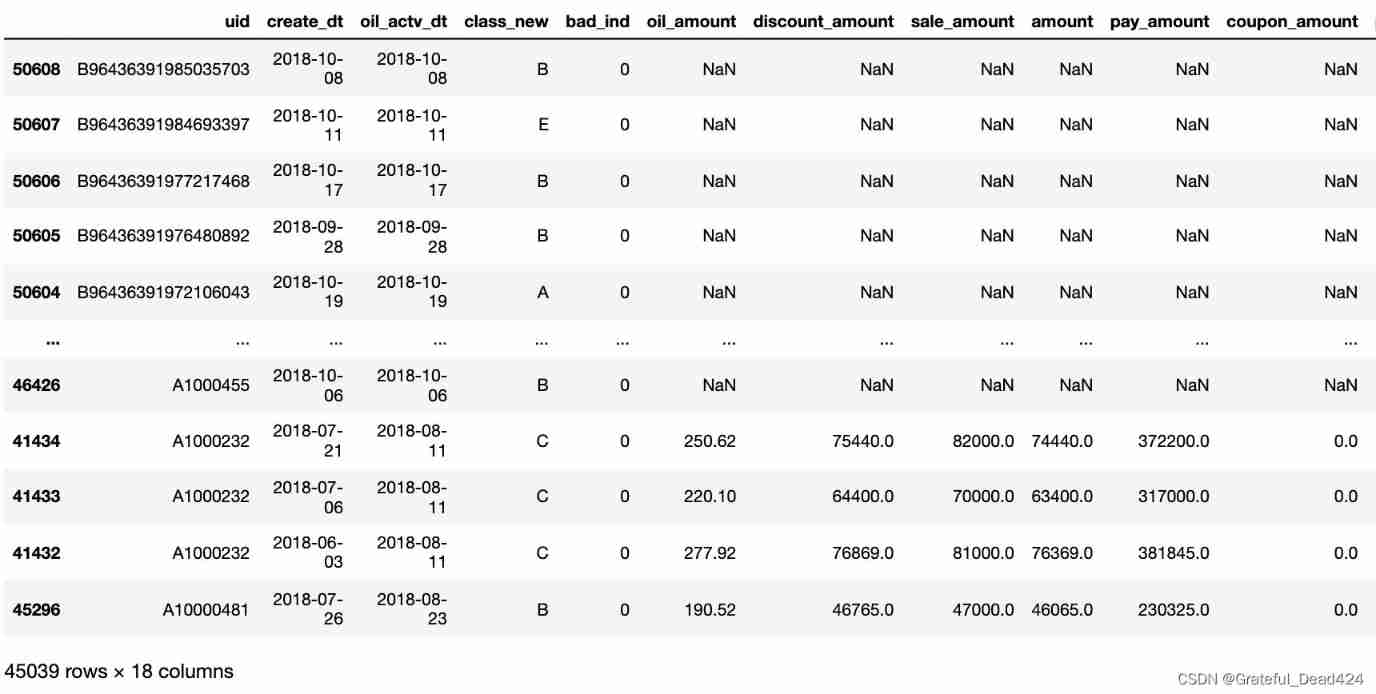
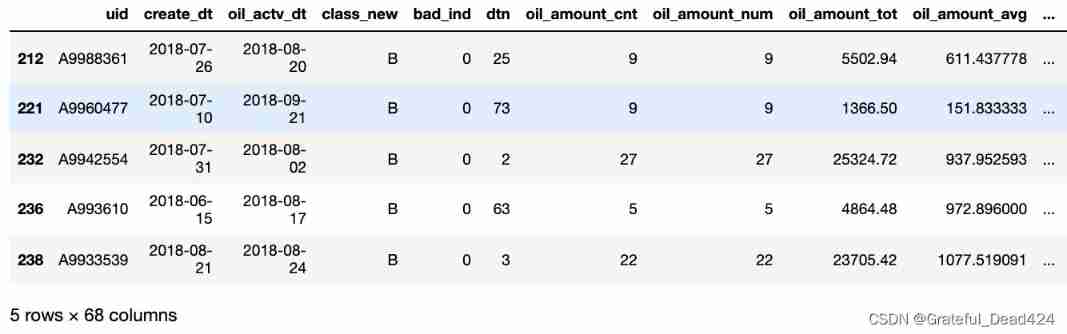
df2 = df.sort_values(["uid","create_dt"],ascending = False)
df2["create_dt"] = df2.apply(lambda x:time_isna(x.create_dt,x.oil_actv_dt),axis = 1)
df2["dtn"] = (df2.oil_actv_dt - df2.create_dt).apply(lambda x:x.days)
df = df2[df2["dtn"] < 180]
df
#()
On features org_list To deal with
Yes org_list Find the maximum interval of historical loan days , And go heavy
base = df[org_lst]
base["dtn"] = df["dtn"]
base = base.sort_values(['uid','create_dt'],ascending = False)
base = base.drop_duplicates(['uid'],keep = 'first')    # Deduplication
base.shape
#(11099, 6)
Variable derivation ( a key )
# Variable derivation
gn = pd.DataFrame()
for i in agg_lst:
    tp = pd.DataFrame(df.groupby('uid').apply(lambda df:len(df[i])).reset_index())
    tp.columns = ['uid',i + '_cnt']
    if gn.empty == True:
        gn = tp
    else:
        gn = pd.merge(gn,tp,on = 'uid',how = 'left')

    tp = pd.DataFrame(df.groupby('uid').apply(lambda df:np.where(df[i]>0,1,0).sum()).reset_index())
    tp.columns = ['uid',i + '_num']
    if gn.empty == True:
        gn = tp
    else:
        gn = pd.merge(gn,tp,on = 'uid',how = 'left')

    tp = pd.DataFrame(df.groupby('uid').apply(lambda df:np.nansum(df[i])).reset_index())
    tp.columns = ['uid',i + '_tot']
    if gn.empty == True:
        gn = tp
    else:
        gn = pd.merge(gn,tp,on = 'uid',how = 'left')

    tp = pd.DataFrame(df.groupby('uid').apply(lambda df:np.nanmean(df[i])).reset_index())
    tp.columns = ['uid',i + '_avg']
    if gn.empty == True:
        gn = tp
    else:
        gn = pd.merge(gn,tp,on = 'uid',how = 'left')

    tp = pd.DataFrame(df.groupby('uid').apply(lambda df:np.nanmax(df[i])).reset_index())
    tp.columns = ['uid',i + '_max']
    if gn.empty == True:
        gn = tp
    else:
        gn = pd.merge(gn,tp,on = 'uid',how = 'left')

    tp = pd.DataFrame(df.groupby('uid').apply(lambda df:np.nanmin(df[i])).reset_index())
    tp.columns = ['uid',i + '_min']
    if gn.empty == True:
        gn = tp
    else:
        gn = pd.merge(gn,tp,on = 'uid',how = 'left')

    tp = pd.DataFrame(df.groupby('uid').apply(lambda df:np.nanvar(df[i])).reset_index())
    tp.columns = ['uid',i + '_var']
    if gn.empty == True:
        gn = tp
    else:
        gn = pd.merge(gn,tp,on = 'uid',how = 'left')

    tp = pd.DataFrame(df.groupby('uid').apply(lambda df:np.nanmean(df[i])/max(np.nanvar(df[i]),1)).reset_index())
    tp.columns = ['uid',i + '_bianyi']
    if gn.empty == True:
        gn = tp
    else:
        gn = pd.merge(gn,tp,on = 'uid',how = 'left')
Yes dstc_lst Variable seeking distinct Number
gc = pd.DataFrame()
for i in dstc_lst:
    tp = pd.DataFrame(df.groupby('uid').apply(lambda df:len(set(df[i]))).reset_index())
    tp.columns = ['uid',i + '_dstc']
    if gc.empty == True:
        gc = tp
    else:
        gc = pd.merge(gc,tp,on = 'uid',how = 'left')
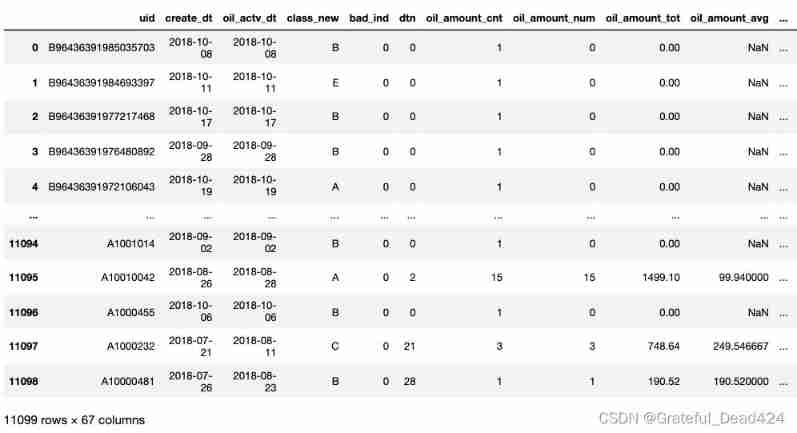
Combine variables
fn = pd.merge(base,gn,on= 'uid')
fn = pd.merge(fn,gc,on= 'uid')
fn
fn = fn.fillna(0) # After combination, there will be many null values , Fill here with 0
Train with decision tree
x = fn.drop(['uid','oil_actv_dt','create_dt','bad_ind','class_new'],axis = 1)
y = fn.bad_ind.copy()
from sklearn import tree
dtree = tree.DecisionTreeRegressor(max_depth = 2,min_samples_leaf = 500,min_samples_split = 5000)
# Limit the maximum depth of the tree
# The leaf contains at least the number of samples
# The node must contain the number of training samples
dtree = dtree.fit(x,y) # utilize x Value , forecast y Whether it's a bad person
Output decision tree image , And make decisions
feature_names = x.columns
import matplotlib.pyplot as plt
plt.figure(figsize=(12,9),dpi=80)
tree.plot_tree(dtree,filled = True,feature_names = feature_names)
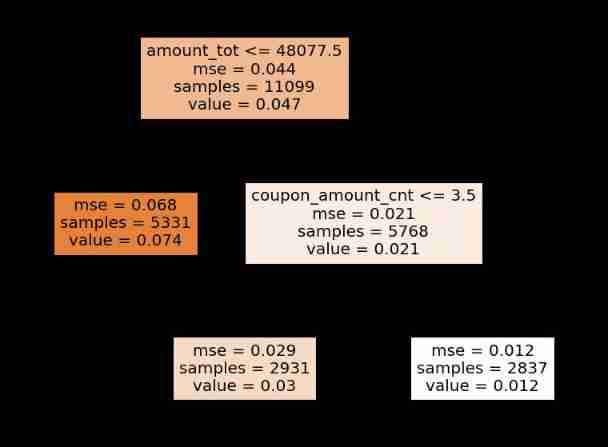
value Namely badrate
Recalculate the bad debt rate
sum(fn.bad_ind)/len(fn.bad_ind)
#0.04658077304261645
# Generation strategy
dff1 = fn.loc[(fn.amount_tot>48077.5)&(fn.coupon_amount_cnt>3.5)].copy()
dff1['level'] = 'oil_A'
dff2 = fn.loc[(fn.amount_tot>48077.5)&(fn.coupon_amount_cnt<=3.5)].copy()
dff2['level'] = 'oil_B'
dff3 = fn.loc[(fn.amount_tot<=48077.5)].copy()
dff3['level'] = 'oil_C'

dff1.head()
dff1 = dff1.append(dff2)
dff1 = dff1.append(dff3)
dff1 = dff1.reset_index(drop = True)
dff1.head()
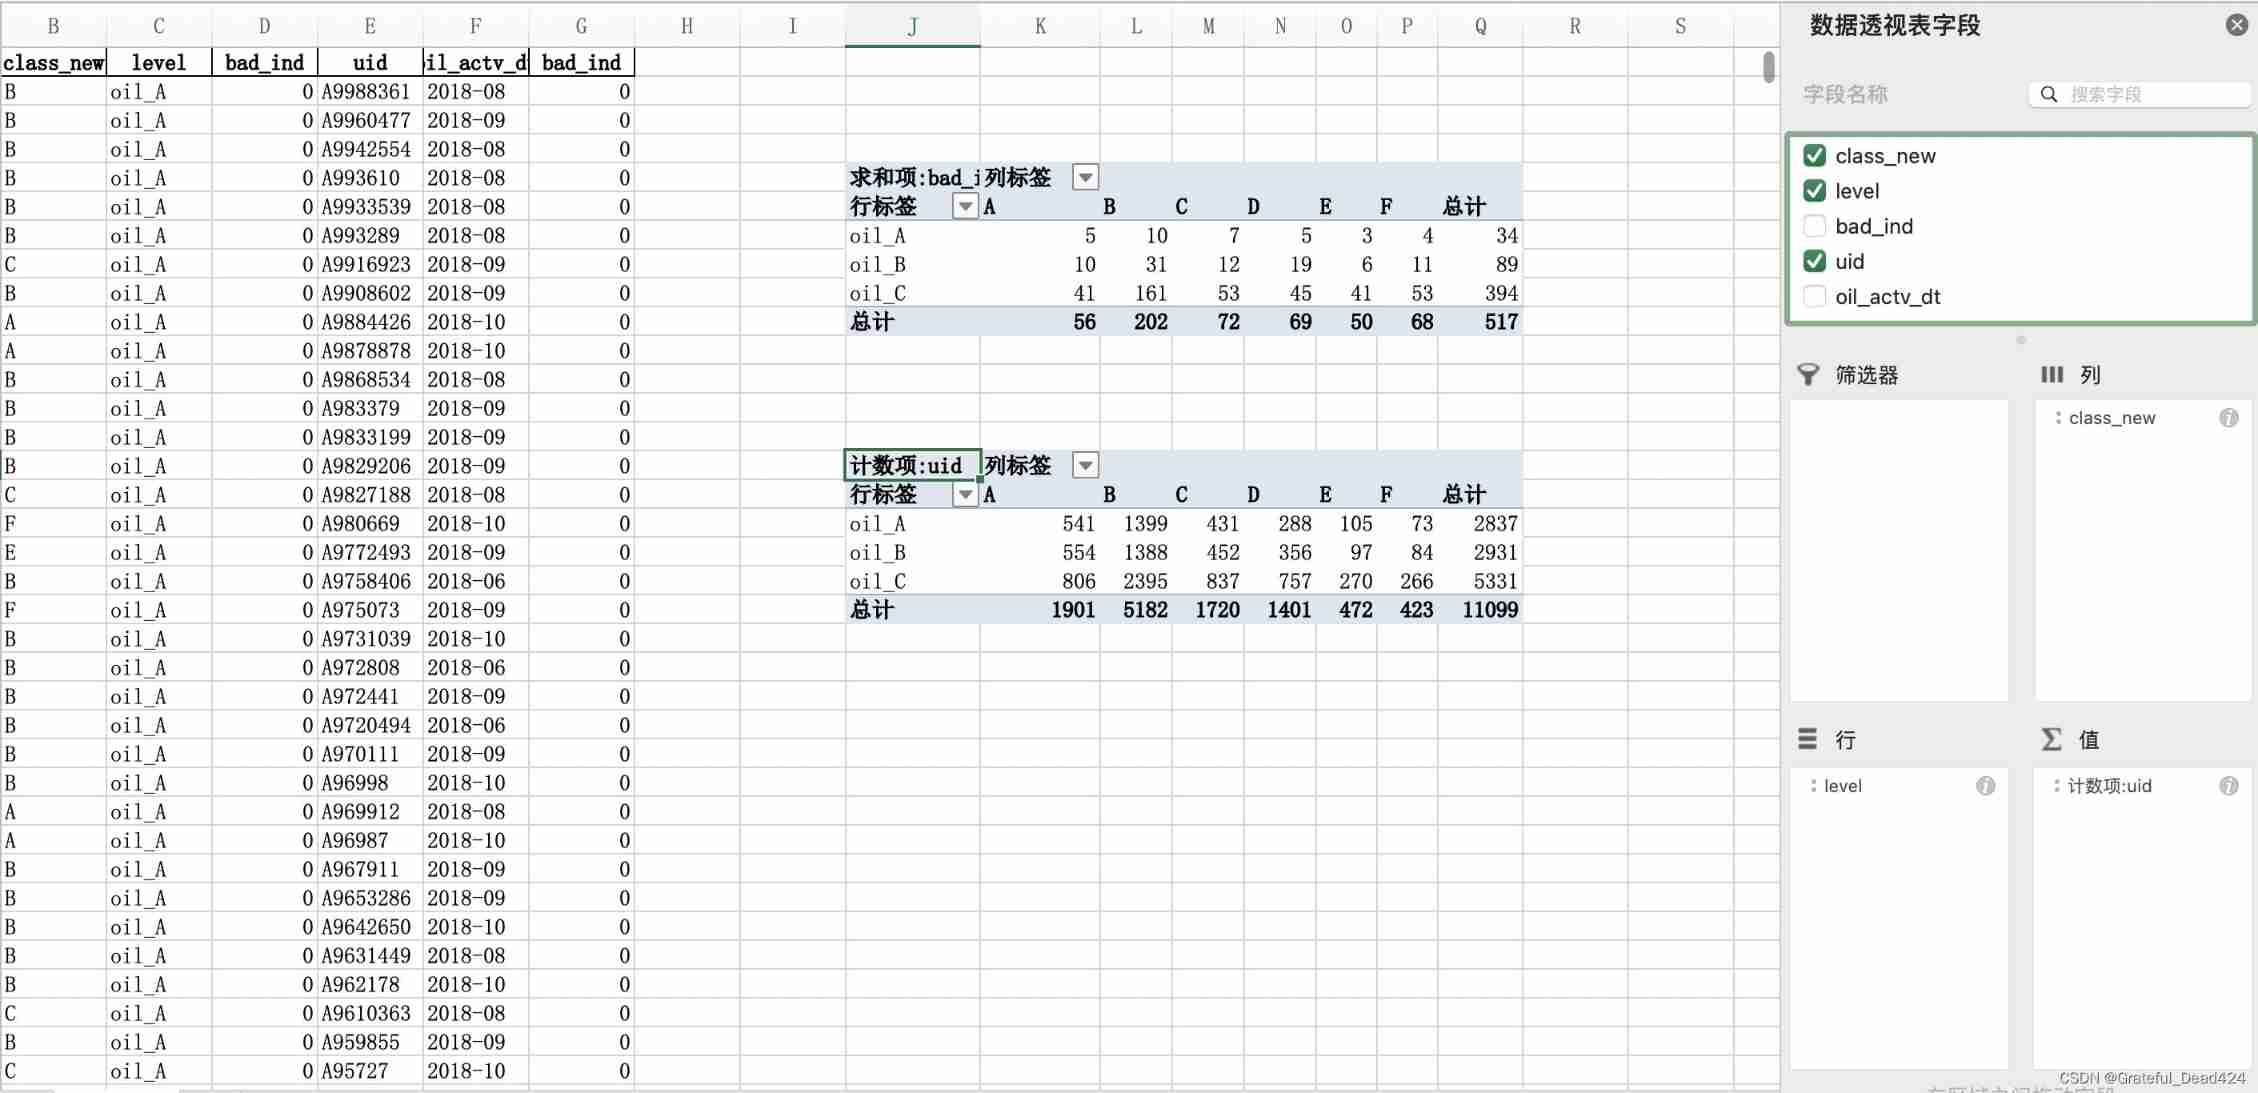
last = dff1[['class_new','level','bad_ind','uid','oil_actv_dt','bad_ind']].copy()
last['oil_actv_dt'] = last['oil_actv_dt'] .apply(lambda x:str(x)[:7]).copy()
last.head(5)

边栏推荐
猜你喜欢
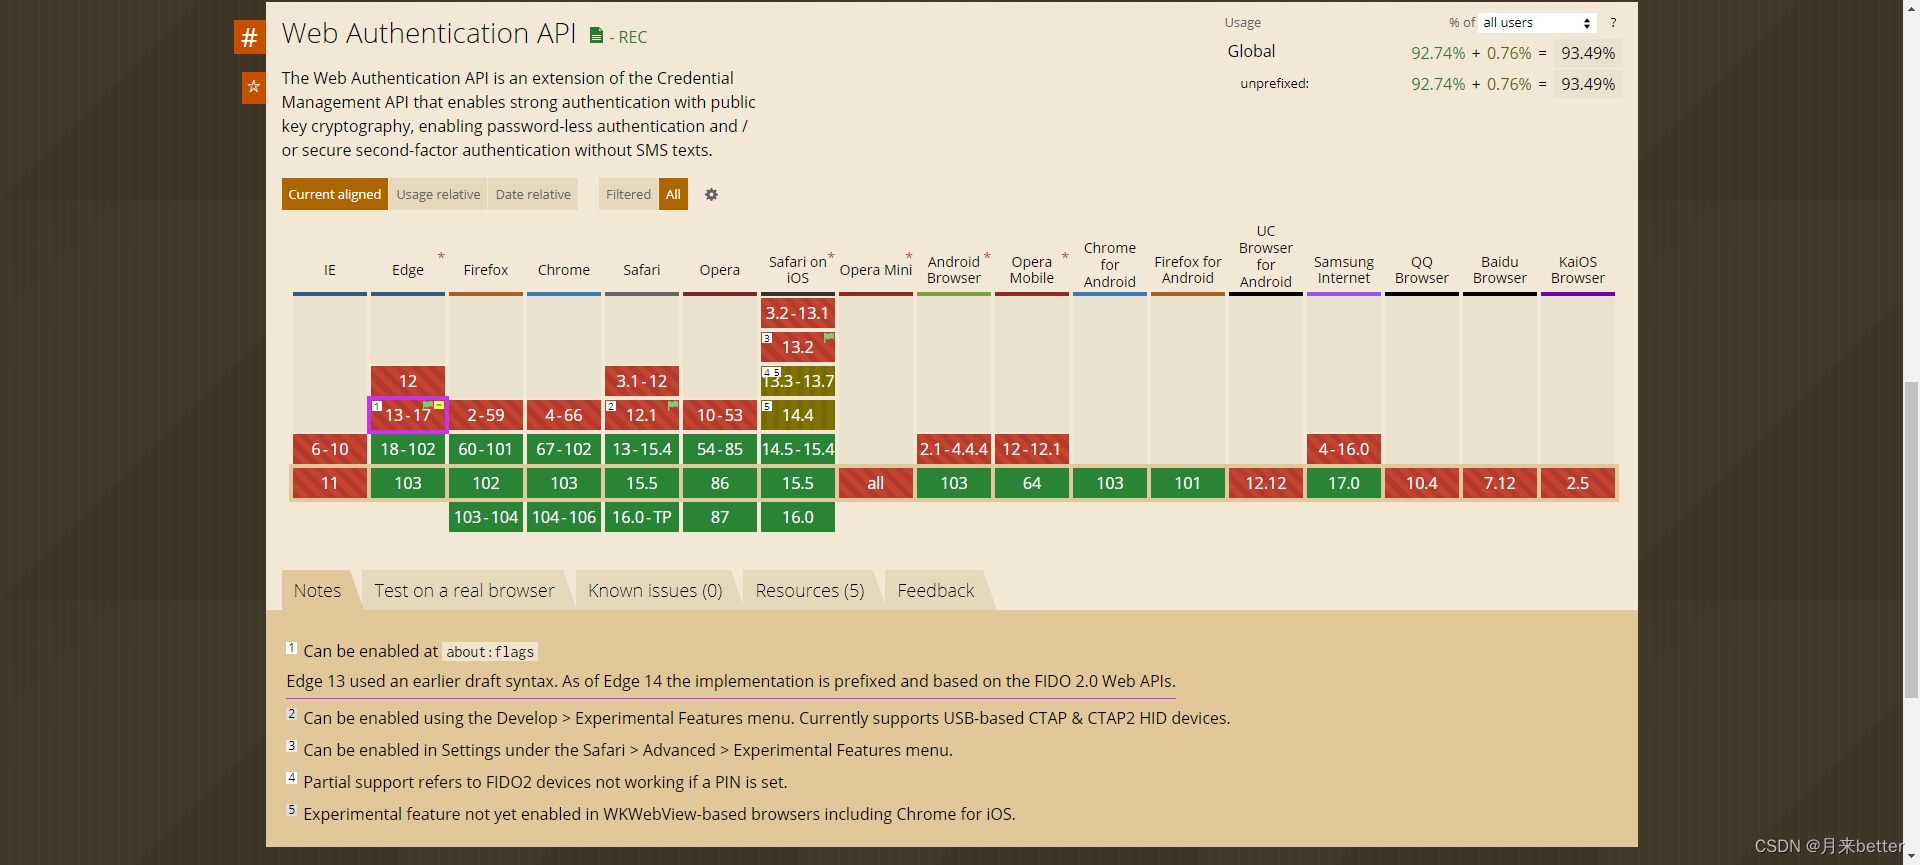
Web authentication API compatible version information

Bbox regression loss function in target detection -l2, smooth L1, IOU, giou, Diou, ciou, focal eiou, alpha IOU, Siou
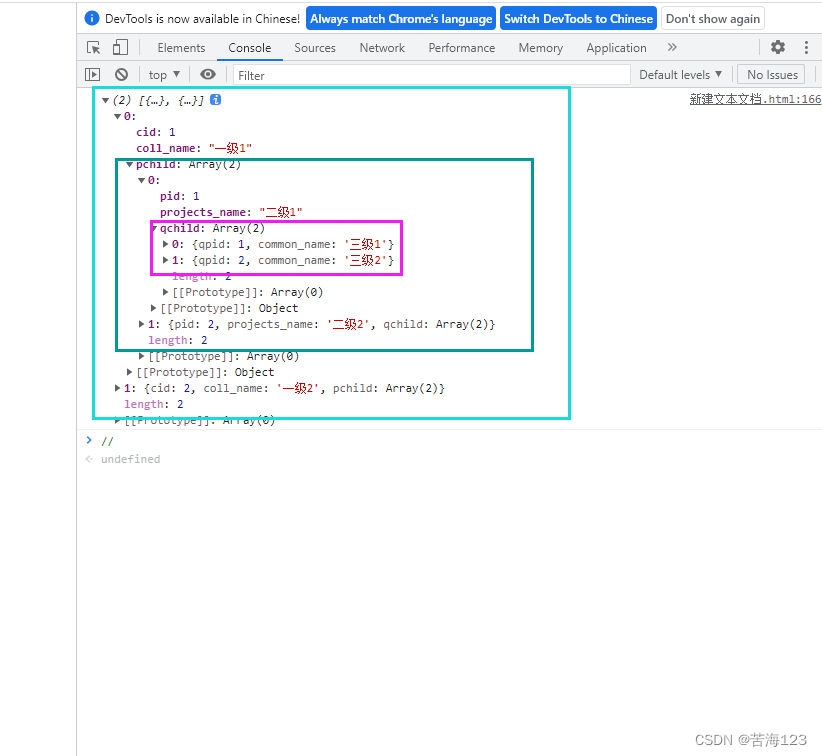
三级菜单数据实现,实现嵌套三级菜单数据
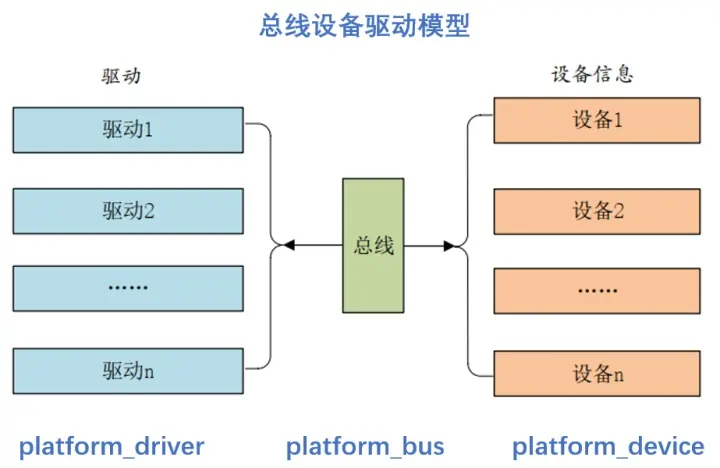
驱动开发中platform设备驱动架构详解

EMMC打印cqhci: timeout for tag 10提示分析与解决
![[daily training -- Tencent selected 50] 235 Nearest common ancestor of binary search tree](/img/4c/16bb943e517c7b703996715632e6ca.png)
[daily training -- Tencent selected 50] 235 Nearest common ancestor of binary search tree
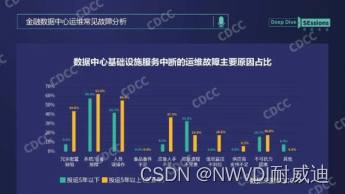
Why does the data center need a set of infrastructure visual management system

职场经历反馈给初入职场的程序员
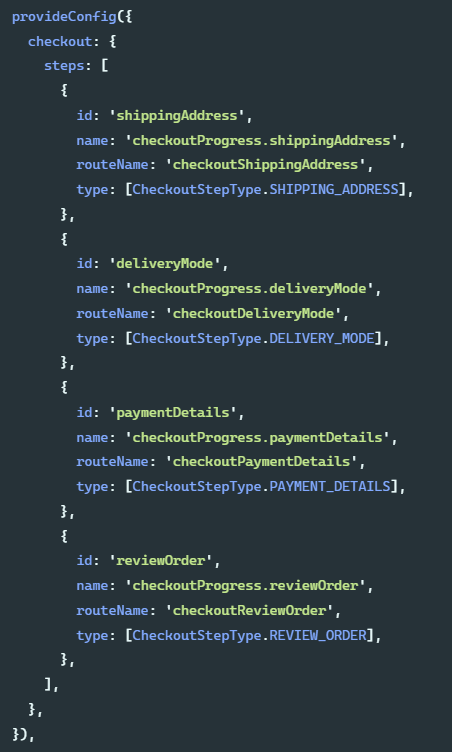
Introduction to the extension implementation of SAP Spartacus checkout process
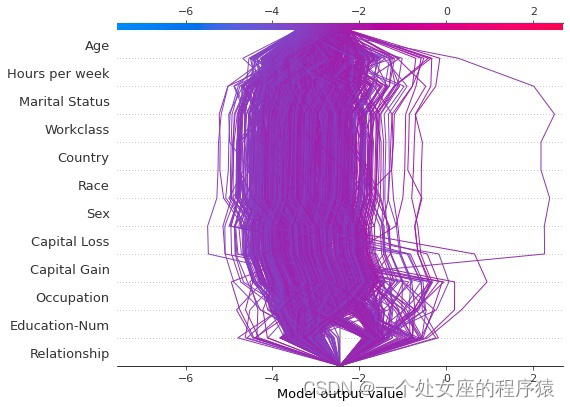
ML之shap:基于adult人口普查收入二分类预测数据集(预测年收入是否超过50k)利用shap决策图结合LightGBM模型实现异常值检测案例之详细攻略
随机推荐
SAP Spartacus checkout 流程的扩展(extend)实现介绍
MySQL performance_ Schema common performance diagnosis query
bat 批示处理详解
The solution of a simple algebraic problem
cf:C. Column Swapping【排序 + 模拟】
How to improve website weight
绕过open_basedir
Mysql-centos7 install MySQL through yum
Flinksql read / write PgSQL
Check Point:企业部署零信任网络(ZTNA)的核心要素
Input of native applet switches between text and password types
Differences and introduction of cluster, distributed and microservice
一个简单的代数问题的求解
I didn't know it until I graduated -- the principle of HowNet duplication check and examples of weight reduction
AI face editor makes Lena smile
MySQL-CentOS7通过YUM安装MySQL
How to get free traffic in pinduoduo new store and what links need to be optimized in order to effectively improve the free traffic in the store
如果不知道这4种缓存模式,敢说懂缓存吗?
Flask1.1.4 Werkzeug1.0.1 源码分析:启动流程
linear regression