当前位置:网站首页>bizchart+slider实现分组柱状图
bizchart+slider实现分组柱状图
2022-07-04 20:57:00 【悟初境】
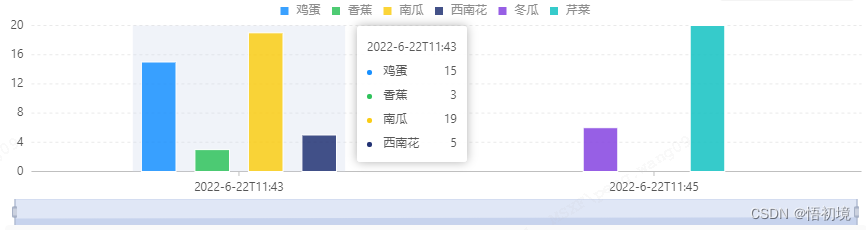
下面使用bizchart实现分组柱状图,并带有滑块选择。效果图如下:
环境
基于bizchart3.x
npm install [email protected]
npm install [email protected]
Chart-Slider组件封装
Chart和Slider是2个组件,为了方便使用,我们封装在一起,用一个函数返回。
import DataSet from '@antv/data-set';
import {
     Axis, Chart, Geom, Legend, Tooltip } from "bizcharts";
import Slider from "bizcharts-plugin-slider";
import React, {
     Component } from 'react';

function getGroupChartWithSliderComponent(data) {


    const ds = new DataSet({

        state: {

            start: data[0] ? data[0].timestamp : '',
            end: data[0] ? data[data.length - 1].timestamp : '$'
        }
    });

    const dv = ds.createView('origin').source(data);
    dv.transform({

        type: 'filter',
        callback(item) {

            const r = item.timestamp;
            return r >= ds.state.start && r <= ds.state.end;
        }
    });


    class GroupChartWithSlider extends React.Component {


        handleTimeSliderChange(e) {

            const {
     startValue, endValue } = e;
            ds.setState('start', startValue);
            ds.setState('end', endValue);
        }

        render() {

            const chartScale = {

                'timestamp': {

                    alias: '时间'
                },
                'count': {

                    alias: '次数'
                }
            };
            return (
                <div>
                    <Chart height={
    200} data={
    dv} forceFit padding='auto' scale={
    chartScale}>
                        <Legend position="top-center" />
                        <Axis name="timestamp" />
                        <Axis name="count" />
                        <Tooltip />
                        <Geom
                            type="interval"
                            position="timestamp*count"
                            color={
    ["tag"]}
                            // color={["tag", ["#f5222d", "#ec6740", "#ffa39e"]]}
                            adjust={
    [
                                {

                                    type: "dodge",
                                    marginRatio: 1 / 32
                                }]}
                            style={
    {

                                stroke: "#fff",
                                lineWidth: 1
                            }}
                        />
                    </Chart>
                    <Slider data={
    data} padding={
    10} xAxis="timestamp" yAxis="count"
                        scales={
    {

                            // 不显示文本
                            timestamp: {

                                formatter: () => ''
                            }
                        }}
                        onChange={
    this.handleTimeSliderChange.bind(this)} />
                </div>
            );
        }
    }

    return GroupChartWithSlider;
}
使用
要生成分组柱状图,只需要同一个X轴的值有多个Y值即可,下面X轴是 timestamp, Y轴是 count.
class MyApp extends Component {


    state = {

        // 聚合分组柱状图图数据
        groupErrorData: [/* { "timestamp": '2022-6-22T11:43', "count": 15, "tag": "鸡蛋", }, { "timestamp": '2022-6-22T11:43', "count": 3, "tag": "香蕉", }, { "timestamp": '2022-6-22T11:43', "count": 19, "tag": "南瓜", }, { "timestamp": '2022-6-22T11:43', "count": 5, "tag": "西南花", }, { "timestamp": '2022-6-22T11:45', "count": 6, "tag": "冬瓜", }, { "timestamp": '2022-6-22T11:45', "count": 20, "tag": "芹菜", }], }; render() { const GroupChartWithSlider = getGroupChartWithSliderComponent(this.state.groupErrorData); return ( <div> <GroupChartWithSlider /> </div > ); } } export default MyApp;
Slider效果
Slider可以拖动,显示数据的趋势。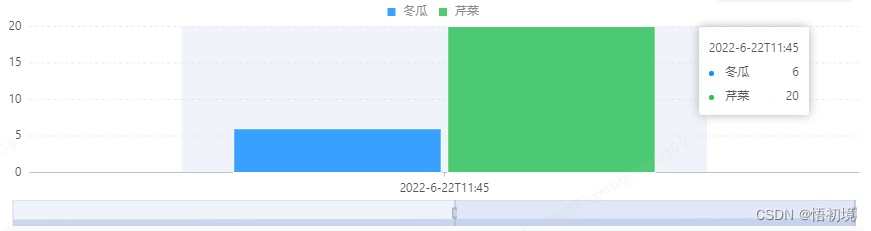
边栏推荐
- Golang interview finishing three resumes how to write
- Compréhension approfondie du symbole [langue C]
- LambdaQueryWrapper用法
- 巅峰不止,继续奋斗!城链科技数字峰会于重庆隆重举行
- How was MP3 born?
- 2021 CCPC Harbin I. power and zero (binary + thinking)
- Lambdaquerywrapper usage
- Jerry's ad series MIDI function description [chapter]
- Flutter TextField示例
- Jerry's ad series MIDI function description [chapter]
猜你喜欢

杰理之增加进关机前把触摸模块关闭流程【篇】
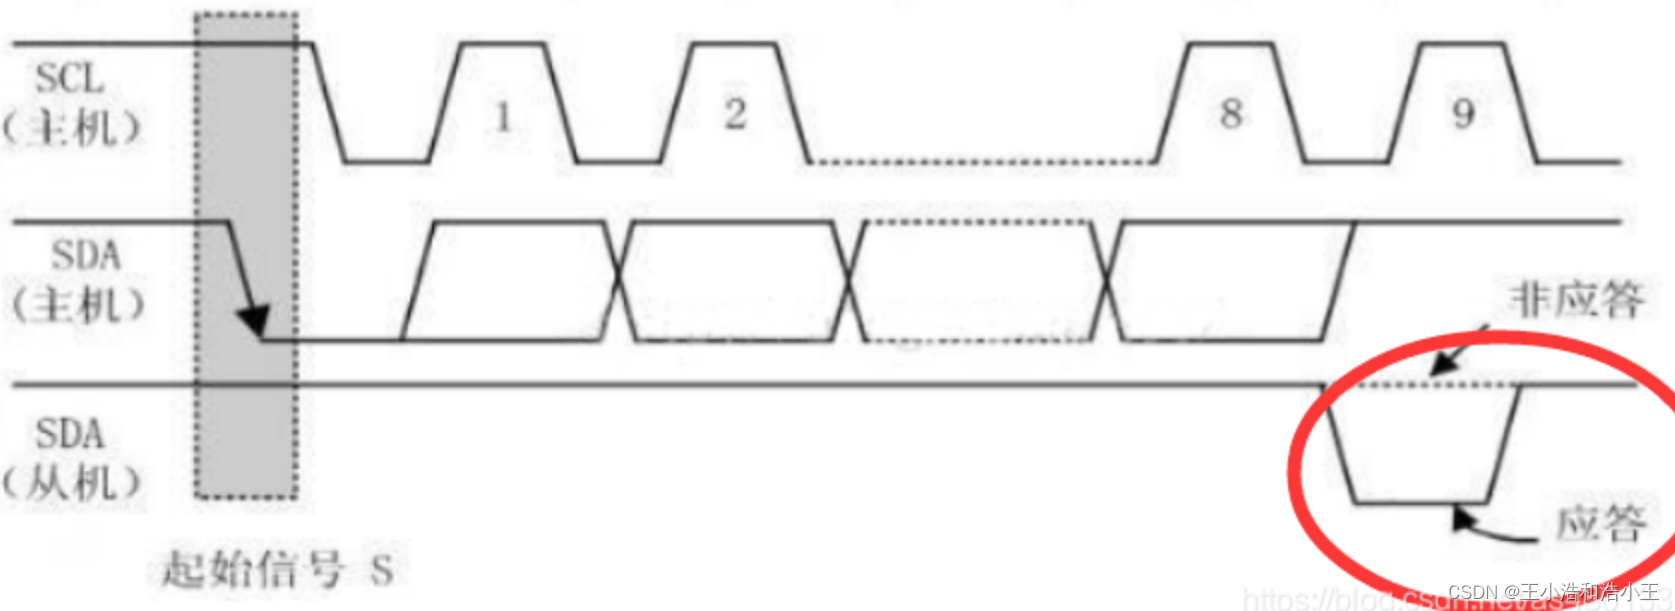
IIC (STM32)
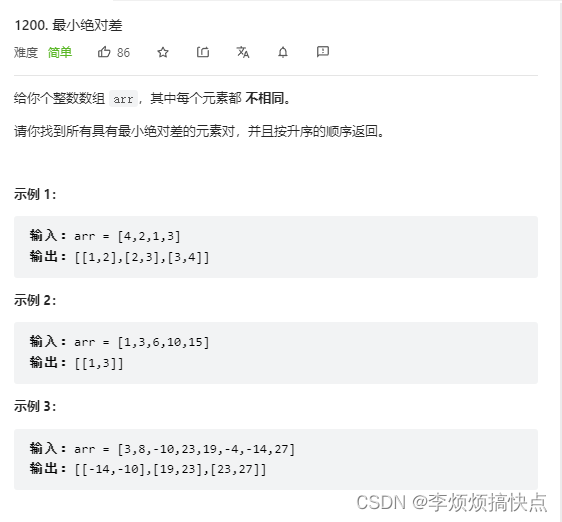
Daily question -leetcode1200- minimum absolute difference - array - sort

【活动早知道】LiveVideoStack近期活动一览
![[public class preview]: basis and practice of video quality evaluation](/img/fd/42b98a08b5a0fd89c119f1d1a8fe1b.png)
[public class preview]: basis and practice of video quality evaluation
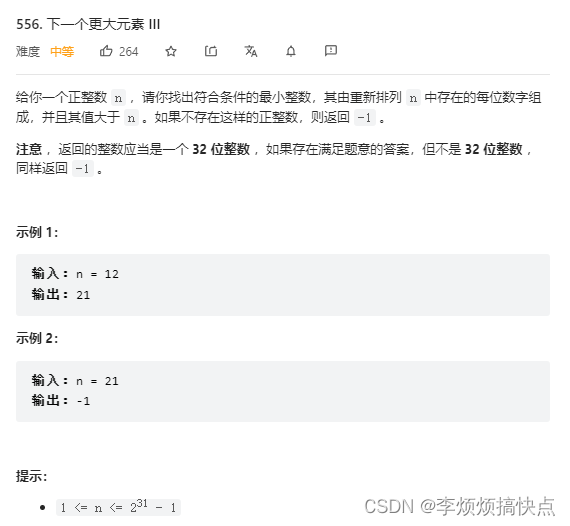
每日一题-LeetCode556-下一个更大元素III-字符串-双指针-next_permutation
Jerry added the process of turning off the touch module before turning it off [chapter]

【C語言】符號的深度理解
![Jerry's ad series MIDI function description [chapter]](/img/28/e0f9b41db597ff3288af431c677001.png)
Jerry's ad series MIDI function description [chapter]

Flutter TextField示例
随机推荐
Monitor the shuttle return button
numpy vstack 和 column_stack
Huawei ENSP simulator enables devices of multiple routers to access each other
开源之夏专访|Apache IoTDB社区 新晋Committer谢其骏
历史最全混合专家(MOE)模型相关精选论文、系统、应用整理分享
CAD中能显示打印不显示
Go language loop statement (3 in Lesson 10)
哈希表(Hash Tabel)
Redis transaction
Billions of citizens' information has been leaked! Is there any "rescue" for data security on the public cloud?
maya灯建模
[leetcode] 17. Letter combination of telephone number
redis03——Redis的网络配置与心跳机制
股票开户佣金最低多少,炒股开户佣金最低网上开户安全吗
更强的 JsonPath 兼容性及性能测试之2022版(Snack3,Fastjson2,jayway.jsonpath)
巅峰不止,继续奋斗!城链科技数字峰会于重庆隆重举行
每日一题-LeetCode556-下一个更大元素III-字符串-双指针-next_permutation
奋斗正当时,城链科技战略峰会广州站圆满召开
Redis cache
[buuctf.reverse] 151_ [FlareOn6]DnsChess