当前位置:网站首页>力扣 643. 子数组最大平均数 I
力扣 643. 子数组最大平均数 I
2022-07-07 17:53:00 【Tomorrowave】
643. 子数组最大平均数 I
给你一个由 n 个元素组成的整数数组 nums 和一个整数 k 。
请你找出平均数最大且 长度为 k 的连续子数组,并输出该最大平均数。
任何误差小于 10-5 的答案都将被视为正确答案。
示例 1:
输入:nums = [1,12,-5,-6,50,3], k = 4
输出:12.75
解释:最大平均数 (12-5-6+50)/4 = 51/4 = 12.75
示例 2:
输入:nums = [5], k = 1
输出:5.00000
提示:
n == nums.length
1 <= k <= n <= 105
-104 <= nums[i] <= 104
思路:
滑动窗口:先定义一个窗口从左向右移动,当长度不满足k,窗口一直→,当吗,满足k时,窗口判断最大值是否为当前最大值,若满足,继续执行向右移动,若长度超出了k那么窗口进行缩短
代码
class Solution:
    def findMaxAverage(self, nums: List[int], k: int) -> float:
        i,j= 0,-1
        sumls=0
        maxval=-10000000
        while j<len(nums)-1 :
            j+=1
            sumls+=nums[j]
            while j - i + 1 > k:
                sumls -= nums[i]
                i+=1
            if j - i + 1 == k :
                maxval=max(maxval,sumls)
        return maxval/k
边栏推荐
- 2022年投资哪个理财产品收益高?
- 831. KMP字符串
- 浏览积分设置的目的
- pom.xml 配置文件标签作用简述
- 实训九 网络服务的基本配置
- R语言ggplot2可视化:使用ggpubr包的ggdensity函数可视化分组密度图、使用stat_overlay_normal_density函数为每个分组的密度图叠加正太分布曲线
- R language uses ggplot2 function to visualize the histogram distribution of counting target variables that need to build Poisson regression model, and analyzes the feasibility of building Poisson regr
- Semantic SLAM源码解析
- Simulate the implementation of string class
- 强化学习-学习笔记8 | Q-learning
猜你喜欢
9 原子操作类之18罗汉增强
LeetCode_ 7_ five

Kirin Xin'an with heterogeneous integration cloud financial information and innovation solutions appeared at the 15th Hunan Financial Technology Exchange Conference
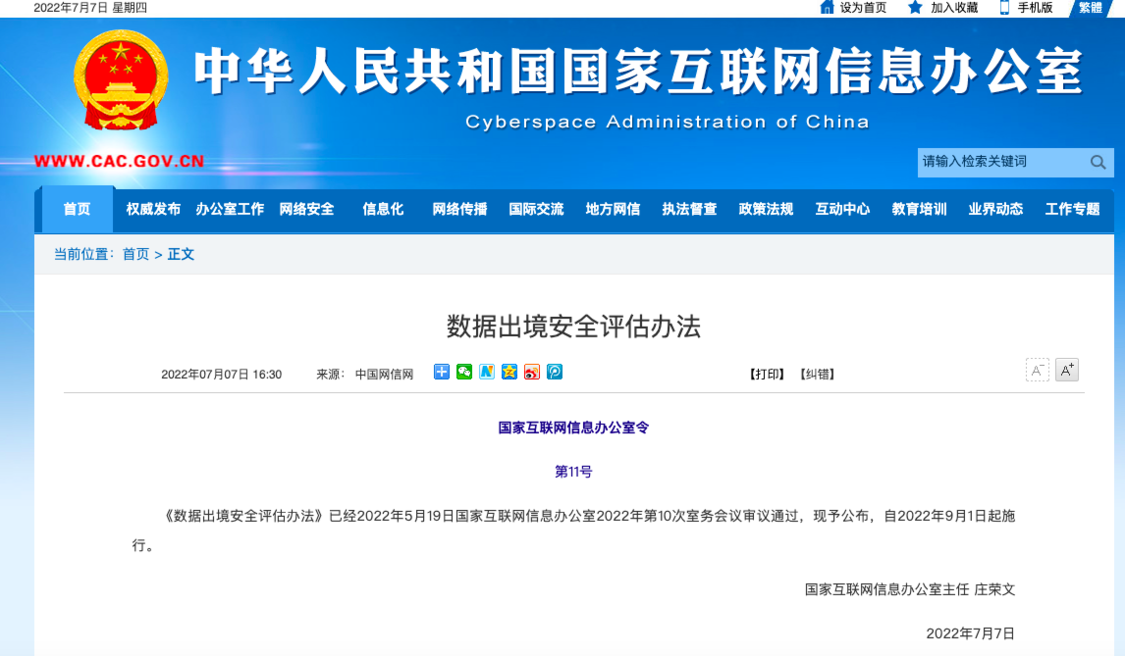
The state cyberspace Office released the measures for data exit security assessment: 100000 information provided overseas needs to be declared

九章云极DataCanvas公司获评36氪「最受投资人关注的硬核科技企业」

Kirin Xin'an won the bid for the new generation dispatching project of State Grid!

# 欢迎使用Markdown编辑器

AD域组策略管理
mock. JS returns an array from the optional data in the object array
Welcome to the markdown editor
随机推荐
torch.nn.functional.pad(input, pad, mode=‘constant‘, value=None)记录
2022年投资哪个理财产品收益高?
Implement secondary index with Gaussian redis
Browse the purpose of point setting
Semantic SLAM源码解析
IP tools
Throughput
华南X99平台打鸡血教程
转置卷积理论解释(输入输出大小分析)
The strength index of specialized and new software development enterprises was released, and Kirin Xin'an was honored on the list
国家网信办公布《数据出境安全评估办法》:累计向境外提供10万人信息需申报
R language ggplot2 visualization: use the ggstripchart function of ggpubr package to visualize the dot strip plot, set the position parameter, and configure the separation degree of different grouped
Mysql, sqlserver Oracle database connection mode
R language dplyr package select function, group_ The by function, filter function and do function obtain the third largest value of a specific numerical data column in a specified level in a specified
R语言ggplot2可视化:使用ggpubr包的ggstripchart函数可视化分组点状条带图(dot strip plot)、设置position参数配置不同分组数据点的分离程度
一锅乱炖,npm、yarn cnpm常用命令合集
Kubernetes——kubectl命令行工具用法详解
Training IX basic configuration of network services
R语言使用ggplot2函数可视化需要构建泊松回归模型的计数目标变量的直方图分布并分析构建泊松回归模型的可行性
831. KMP字符串