当前位置:网站首页>Pytorch builds LSTM to realize clothing classification (fashionmnist)
Pytorch builds LSTM to realize clothing classification (fashionmnist)
2022-07-02 11:57:00 【raelum】
FashionMNIST Data set official website :https://github.com/zalandoresearch/fashion-mnist.
This data set will not be introduced here , For more information, please go to the official website .
Ideas : Each picture in the dataset is of size ( 28 , 28 ) (28,28) (28,28) The gray image . We can think of it as 28 × 28 28\times28 28×28 Digital matrix of , Divide the matrix into rows Line by line and block by block A length of 28 28 28 Sequence , And each in the sequence “ Morpheme ” The corresponding characteristic dimension is also 28 28 28.
Running environment :
- System :Ubuntu 20.04;
- GPU:RTX 3090;
- Pytorch:1.11;
- Python:3.8
import numpy as np
import matplotlib.pyplot as plt
import torch
import torchvision
import torch.nn as nn
from torch.utils.data import DataLoader
# Data Preprocessing
train_data = torchvision.datasets.FashionMNIST(root='data',
train=True,
transform=torchvision.transforms.ToTensor(),
download=True)
test_data = torchvision.datasets.FashionMNIST(root='data',
train=False,
transform=torchvision.transforms.ToTensor(),
download=True)
train_loader = DataLoader(train_data, batch_size=64, shuffle=True, num_workers=4)
test_loader = DataLoader(test_data, batch_size=64, num_workers=4)
# Model building
class LSTM(nn.Module):
def __init__(self):
super().__init__()
self.lstm = nn.LSTM(28, 64, num_layers=2)
self.linear = nn.Linear(64, 10)
def forward(self, x):
output, (h_n, c_n) = self.lstm(x, None)
return self.linear(h_n[0])
def setup_seed(seed):
np.random.seed(seed)
torch.manual_seed(seed)
torch.cuda.manual_seed(seed)
torch.cuda.manual_seed_all(seed)
# Setup
setup_seed(42)
NUM_EPOCHS = 20
LR = 4e-3
train_loss, test_loss, test_acc = [], [], []
device = 'cuda' if torch.cuda.is_available() else 'cpu'
lstm = LSTM()
lstm.to(device)
critertion = nn.CrossEntropyLoss()
optimizer = torch.optim.Adam(lstm.parameters(), lr=LR)
# Training and testing
for epoch in range(NUM_EPOCHS):
print(f'[Epoch {
epoch + 1}]', end=' ')
avg_train_loss, avg_test_loss, correct = 0, 0, 0
# train
lstm.train()
for batch_idx, (X, y) in enumerate(train_loader):
# (64, 1, 28, 28) -> (28, 64, 28)
X = X.squeeze().movedim(0, 1)
X, y = X.to(device), y.to(device)
# forward
output = lstm(X)
loss = critertion(output, y)
avg_train_loss += loss
# backward
optimizer.zero_grad()
loss.backward()
optimizer.step()
avg_train_loss /= (batch_idx + 1)
train_loss.append(avg_train_loss.item())
# test
lstm.eval()
with torch.no_grad():
for batch_idx, (X, y) in enumerate(test_loader):
X = X.squeeze().movedim(0, 1)
X, y = X.to(device), y.to(device)
pred = lstm(X)
loss = critertion(pred, y)
avg_test_loss += loss
correct += (pred.argmax(1) == y).sum().item()
avg_test_loss /= (batch_idx + 1)
test_loss.append(avg_test_loss.item())
correct /= len(test_loader.dataset)
test_acc.append(correct)
print(
f"train loss: {
train_loss[-1]:.4f} | test loss: {
test_loss[-1]:.4f} | test acc: {
correct:.4f}"
)
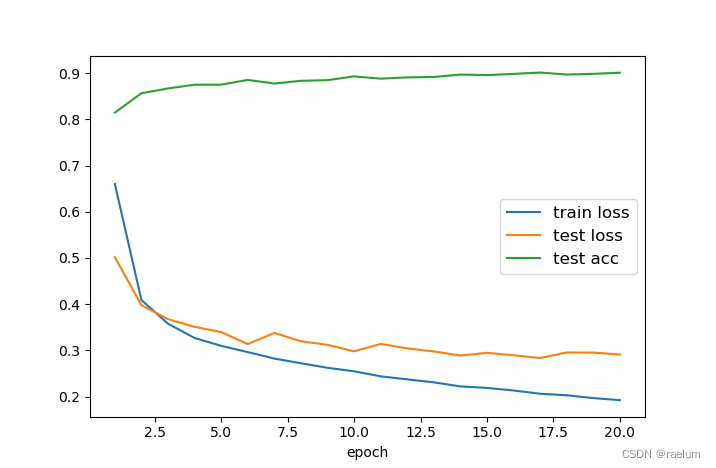
# Plot
x = np.arange(1, 21)
plt.plot(x, train_loss, label="train loss")
plt.plot(x, test_loss, label="test loss")
plt.plot(x, test_acc, label="test acc")
plt.xlabel("epoch")
plt.legend(loc="best", fontsize=12)
plt.show()
Output results :
[Epoch 1] train loss: 0.6602 | test loss: 0.5017 | test acc: 0.8147
[Epoch 2] train loss: 0.4089 | test loss: 0.3979 | test acc: 0.8566
[Epoch 3] train loss: 0.3577 | test loss: 0.3675 | test acc: 0.8669
[Epoch 4] train loss: 0.3268 | test loss: 0.3509 | test acc: 0.8751
[Epoch 5] train loss: 0.3098 | test loss: 0.3395 | test acc: 0.8752
[Epoch 6] train loss: 0.2962 | test loss: 0.3135 | test acc: 0.8854
[Epoch 7] train loss: 0.2823 | test loss: 0.3377 | test acc: 0.8776
[Epoch 8] train loss: 0.2720 | test loss: 0.3196 | test acc: 0.8835
[Epoch 9] train loss: 0.2623 | test loss: 0.3120 | test acc: 0.8849
[Epoch 10] train loss: 0.2547 | test loss: 0.2981 | test acc: 0.8931
[Epoch 11] train loss: 0.2438 | test loss: 0.3140 | test acc: 0.8882
[Epoch 12] train loss: 0.2372 | test loss: 0.3043 | test acc: 0.8909
[Epoch 13] train loss: 0.2307 | test loss: 0.2977 | test acc: 0.8918
[Epoch 14] train loss: 0.2219 | test loss: 0.2888 | test acc: 0.8970
[Epoch 15] train loss: 0.2187 | test loss: 0.2946 | test acc: 0.8959
[Epoch 16] train loss: 0.2132 | test loss: 0.2894 | test acc: 0.8985
[Epoch 17] train loss: 0.2061 | test loss: 0.2835 | test acc: 0.9014
[Epoch 18] train loss: 0.2028 | test loss: 0.2954 | test acc: 0.8971
[Epoch 19] train loss: 0.1966 | test loss: 0.2952 | test acc: 0.8986
[Epoch 20] train loss: 0.1922 | test loss: 0.2910 | test acc: 0.9011
Corresponding curve :
some Experience :
- Do not use directly
X = X.reshape(28, -1, 28), otherwiseXThe corresponding image will not be the original one ( Readers can try to usetorchvision.transforms.ToPILImageTo outputXThe corresponding picture observation effect ). - With the same learning rate ,SGD The effect is not Adam good .
边栏推荐
- What week is a date obtained by QT
- Principe du contrat évolutif - delegatecall
- ESP32 Arduino 引入LVGL 碰到的一些问题
- GGPLOT: HOW TO DISPLAY THE LAST VALUE OF EACH LINE AS LABEL
- Seriation in R: How to Optimally Order Objects in a Data Matrice
- Take you ten days to easily finish the finale of go micro services (distributed transactions)
- 【多线程】主线程等待子线程执行完毕在执行并获取执行结果的方式记录(有注解代码无坑)
- GGPUBR: HOW TO ADD ADJUSTED P-VALUES TO A MULTI-PANEL GGPLOT
- 基于Hardhat编写合约测试用例
- 深入理解PyTorch中的nn.Embedding
猜你喜欢
Some problems encountered in introducing lvgl into esp32 Arduino
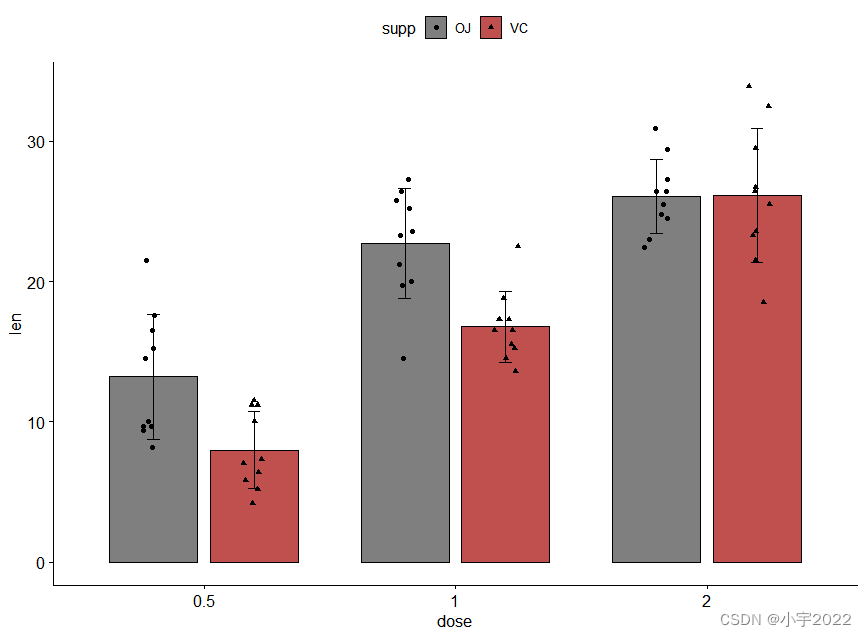
How to Easily Create Barplots with Error Bars in R

MySQL comparison operator in problem solving

PgSQL string is converted to array and associated with other tables, which are displayed in the original order after matching and splicing

GGPLOT: HOW TO DISPLAY THE LAST VALUE OF EACH LINE AS LABEL
Cluster Analysis in R Simplified and Enhanced

FLESH-DECT(MedIA 2021)——一个material decomposition的观点
![[visual studio 2019] create MFC desktop program (install MFC development components | create MFC application | edit MFC application window | add click event for button | Modify button text | open appl](/img/6a/111da81436659c7502648907ec1367.jpg)
[visual studio 2019] create MFC desktop program (install MFC development components | create MFC application | edit MFC application window | add click event for button | Modify button text | open appl
预言机链上链下调研

Dynamic memory (advanced 4)
随机推荐
flutter 问题总结
Data analysis - Matplotlib sample code
预言机链上链下调研
Never forget, there will be echoes | hanging mirror sincerely invites you to participate in the opensca user award research
Is it safe to open a stock account through the QR code of the securities manager? Or is it safe to open an account in a securities company?
From scratch, develop a web office suite (3): mouse events
php 根据经纬度查询距离
自然语言处理系列(三)——LSTM
Mish shake the new successor of the deep learning relu activation function
to_bytes与from_bytes简单示例
B high and beautiful code snippet sharing image generation
How to Easily Create Barplots with Error Bars in R
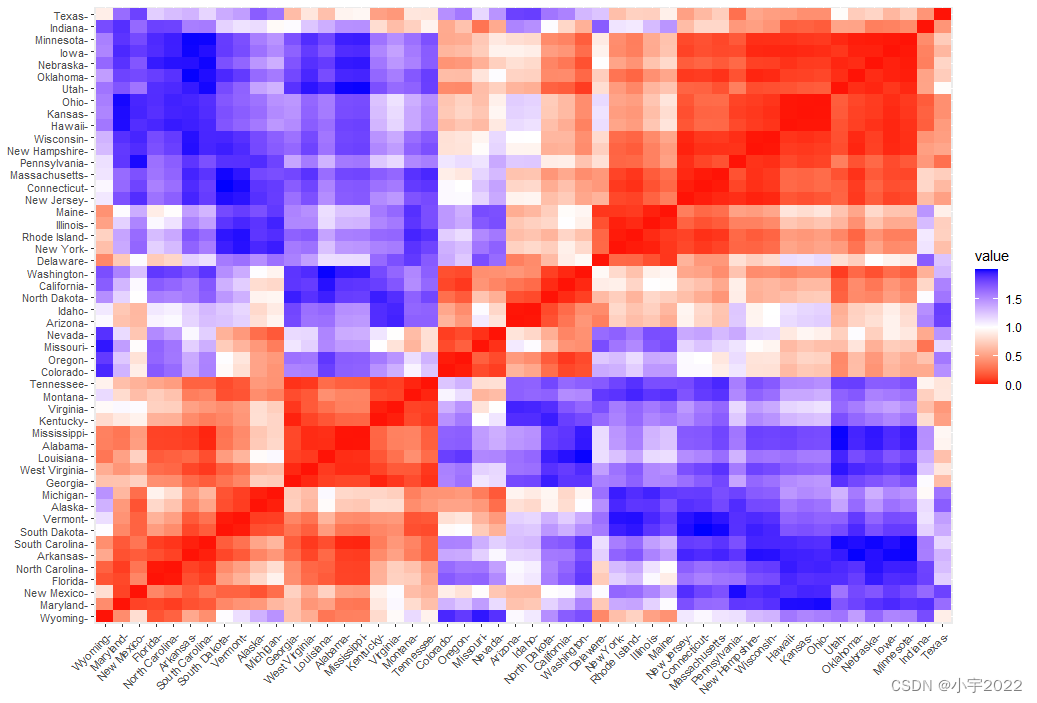
HOW TO CREATE A BEAUTIFUL INTERACTIVE HEATMAP IN R
How to Easily Create Barplots with Error Bars in R
HOW TO EASILY CREATE BARPLOTS WITH ERROR BARS IN R
揭露数据不一致的利器 —— 实时核对系统
vant tabs组件选中第一个下划线位置异常
YYGH-BUG-05
Log4j2
基于Hardhat和Openzeppelin开发可升级合约(二)