当前位置:网站首页>Appium foundation - appium inspector positioning tool (I)
Appium foundation - appium inspector positioning tool (I)
2022-07-07 01:33:00 【Test - Eight Precepts】
1、Appium Inspector Introduce
We said before Appium Server There are two ways to start ,
- One is
Appium DesktopThe startup mode with graphical interface , It's called the desktop version ; - Another version is through npm install , Started with command line arguments Appium Server.
and Appium Inspector The tools are right there Appium Desktop in ,Appium Inspector yes Appium Desktop An attached element location checker , It's convenient to debug and locate applications .Appium Inspector The tool also supports Android Systems and IOS Element positioning of the native interface in the system .
2、Appium Inspector Open mode
Appium Desktop After installation , Double-click to open .

explain : The interface has 3 individual Tab Options
- Simple: The default configuration , Monitor local 4723 port ;
- Advanced: Advanced settings , You can customize Appium server End configuration , After configuration, it can be saved to Presets;
- Presets: modify Advanced Configuration items in advanced settings .
Generally, we test directly Simple that will do , Click on Start Server Button , start-up Appium server, And turn on the monitor 4723 port .
After opening the service , The interface jumps to the server console , Here's the picture :

Tips :
The console displays the log information in the running script , There is... In the upper right corner 3 Button , Namely :
- The first button Start Inspector Session, Turn on Appium Inspector Positioning tools ;
Be careful :inspector There will be a new meeting Session; - The second button Get Raws Logs, Download... In the current console log Information ;
- The third button Stop Server, Close current Appium server.
There are two ways to openAppium InspectorTools , - Mode one : Click the first of the three buttons in the upper right corner ( A magnifying glass like button ), open
Appium InspectorTools . - Mode two : Click on the top left corner
File-->New Session Window... Ctrl+NIt can also be openedAppium InspectorTools .
Here's the picture :

Appium Inspector The interface after the tool is opened is shown in the figure below :

3、Appium Inspector Layout introduction

explain :
- Layout 1 yes Appium Inspector Service settings
Automatic Server: Automatic serverCustom Server: Custom serverSelect Cloud Providers: Choose a cloud provider
We usually useAutomatic Serverthat will do :Will use currently-running Appium Desktop server http://localhost:4723
Will use the currently running Appium Desktop serverhttp://localhost:4723. - Layout 2 It's advanced settings
You can set :Allow Unauthorized Certificates: Allow unauthorized certificatesUse Proxy: Use proxy server
For beginners, we usually don't have advanced settings . - Layout 3 yes Desired Capabilities Parameter setting
Desired Capabilities: To write Desired Capabilities ParametersSaved Capability Sets: Saved Desired Capabilities, You can view and modify .Attach to Session...: Attach to session ...( When I use it, I'm saying )
4、Appium Inspector Configuration of tools
1)Appium Inspector Tool use premise
- open
Appium Desktop, Turn onAppium InspectorTools . - The tested equipment is in power on state ( Mobile phone or virtual machine ).
- Make sure the computer and device are linked , That is to say
cmd Go to the command line terminal ,
Inputadb connect 127.0.0.1:21503Link carefree Simulator ,
Inputadb devicesCan get the device name .
2)Appium Inspector Server settings and advanced settings
- server setting : choice
Automatic Server( Be sure to click , Select ) - Advanced settings : Do not set
3) To write Desired Capabilities Parameters ( a key )
You can manually add... Line by line on the left , Here's the picture :

Tips : The format of the second column is for the third column value In terms of the .
Also can put the Json Format data, edit well , Paste directly on the right JSON Representation in .

Put... Directly Json Paste the formatted data directly

Click save , The data will be synchronized to the left , Here's the picture :

4) preservation Desired Capabilities Parameters
If necessary , After editing Desired Capabilities After the parameters , It can be saved , Convenient for future management and use .


5) View and modify stored Desired Capabilities
Click on Saved Capability Sets TAB , You can view and modify stored Desired Capabilities.

6) Turn on Session, Connect the mobile phone to get the mobile phone interface
Click on Start Session, Turn on use Appium Inspector Tools , Here's the picture :

explain
- Appium Inspector We need to manually create a session, In fact, it is a client , and Appium server Connect , And need to be in Desired Capabilities Fill in some parameters .
- The required function is in Desired Capabilities The keys and values encoded in the object , When a new automation session is requested , from Appium Client sent to Appium server The server .Desired Capabilities tell Appium Driver all kinds of important information about how you want the test to work . Final Desired Capabilities Will serve as a JSON Object sent to Appium.
- Of the required functions Desired Capabilities The object can be in WebDriver Script in the test , It can also be in Appium Server GUI Set in ( adopt Inspector In the session , That's the way of introduction above ).
Tips :
WhenAppium InspectorWhen you can't grab the phone screen , You can shut down and restart adb service , Or restartAppium Inspectorservice . - adb kill-server
- adb start-server
a key : Supporting learning materials and video teaching
So here I have carefully prepared the detailed information of the above outline in The link below is as follows


边栏推荐
- Add the applet "lazycodeloading": "requiredcomponents" in taro,
- LeetCode:1175. 质数排列
- The difference between Tansig and logsig. Why does BP like to use Tansig
- LeetCode:1175. Prime permutation
- 2022 Google CTF SEGFAULT LABYRINTH wp
- C language - array
- Table table setting fillet
- What are the differences between Oracle Linux and CentOS?
- AcWing 361. 观光奶牛 题解(spfa求正环)
- 【芯片方案设计】脉搏血氧仪
猜你喜欢
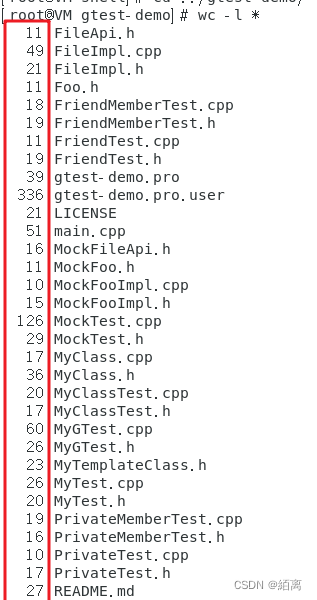
shell脚本快速统计项目代码行数

Let's see through the network i/o model from beginning to end
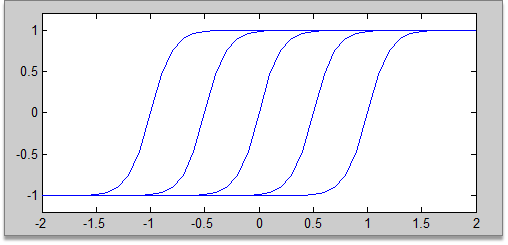
一起看看matlab工具箱内部是如何实现BP神经网络的
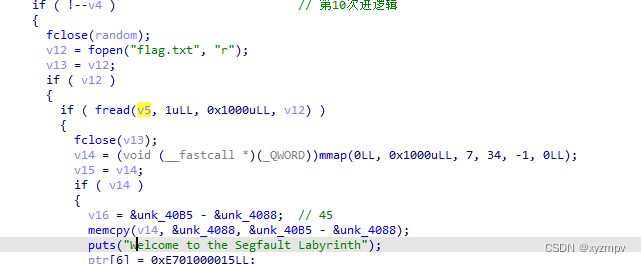
2022 Google CTF SEGFAULT LABYRINTH wp
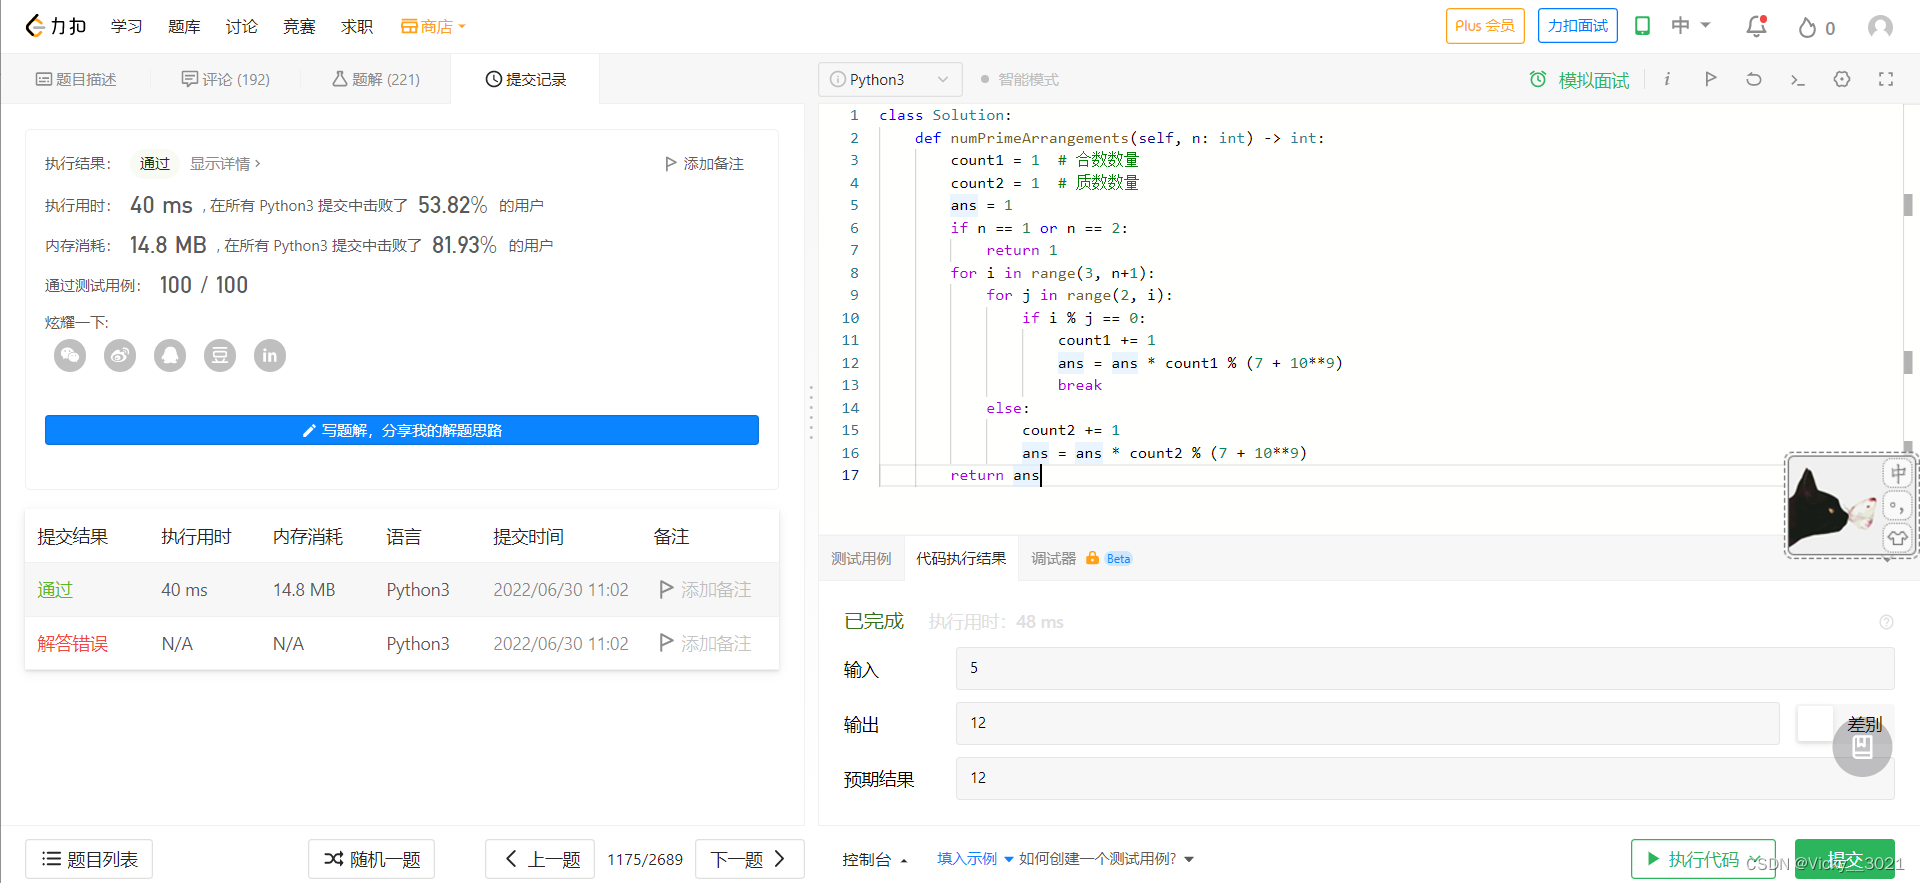
LeetCode:1175. Prime permutation

【C语言进阶篇】指针的8道笔试题
Lldp compatible CDP function configuration
1123. 最深叶节点的最近公共祖先
![[advanced C language] 8 written questions of pointer](/img/d4/c9bb2c8c9fd8f54a36e463e3eb2fe0.png)
[advanced C language] 8 written questions of pointer

tansig和logsig的差异,为什么BP喜欢用tansig
随机推荐
Share a general compilation method of so dynamic library
[chip scheme design] pulse oximeter
[signal and system]
Transformation transformation operator
2022 Google CTF SEGFAULT LABYRINTH wp
C language - array
系统休眠文件可以删除吗 系统休眠文件怎么删除
Gin 入门实战
Lldp compatible CDP function configuration
Make Jar, Not War
增加 pdf 标题浮窗
The MySQL database in Alibaba cloud was attacked, and finally the data was found
JS reverse -- ob confusion and accelerated music that poked the [hornet's nest]
Boot - Prometheus push gateway use
Gnet: notes on the use of a lightweight and high-performance go network framework
免费白嫖的图床对比
Dark horse notes - create immutable sets and streams
HMM 笔记
go-zero微服务实战系列(九、极致优化秒杀性能)
Realize incremental data synchronization between MySQL and ES