当前位置:网站首页>Monitoring - Prometheus introduction
Monitoring - Prometheus introduction
2022-07-04 03:06:00 【oyyy3】
Catalog
Two 、Prometheus characteristic
3、 ... and 、 Design idea of operation and maintenance monitoring platform
Four 、 Monitoring system system
1. System layer monitoring ( Data to be monitored )
2. Middleware and basic application monitoring End monitoring ( Move app, Specific procedures, etc )
3. Application layer monitoring
5、 ... and 、Prometheus Ecological components
One 、 Common monitoring
- cacti
- Nagios
- Zabbix
- Prometheus
- open-Falcaon
Two 、Prometheus characteristic
Multidimensional data model ( Based on time series Key、 value Key value pair )
Flexible query and aggregation language PromQL—— Be similar to mysql Of sql sentence
Provide local storage and distributed storage
Offer based on HTTP and HTTPS( Seven layers ) Of Pull The model collects time series data (pull Data push , The time series : Data value index at each time point , Continuous production . The horizontal axis identifies the time , The vertical axis is the data value , Dynamic change of values over a period of time , All the points and lines form a large-scale broken line chart )
available Pushgateway (Prometheus Optional middleware ) Realization Push Pattern ( Only execute the script or one time / Short cycle tasks , Use push The way ) For the seventh floor pull, For the fourth floor push
Target machines can be discovered through dynamic service discovery or static configuration ( adopt consul Auto discover and shrink )
Support a variety of charts and data ( Test with ) There are many visual icons and types
3、 ... and 、 Design idea of operation and maintenance monitoring platform
1. Data collection module
2. Data extraction module (prometheus-TSDB The query language is PromQL)
3. Monitoring alarm module ( The Boolean expression determines whether an alarm is required PromQL (CPU Usage rate )>80%)
Refine to
The sixth floor —— User presentation management —— Same user management 、 Centralized monitoring 、 Centralized maintenance
The fifth floor —— Alarm event generation layer —— Record alarm events in real time 、 Form analysis chart ( Trend analysis 、 visualization )
The fourth level —— Alarm rule configuration layer —— Alarm rule settings 、 Alarm value setting ( Define Boolean expressions , Filter exception status )
The third level —— Data extraction layer —— Regularly collect data to the monitoring module
The second floor —— Data presentation layer —— Data generation curve display ( Dynamic display of time series data )
first floor —— Data collection layer ——( Multi channel monitoring data )——( The Internet , Hardware , application , data , Physical environment )
Four 、 Monitoring system system
1. System layer monitoring ( Data to be monitored )
2. Middleware and basic application monitoring End monitoring ( Move app, Specific procedures, etc )
3. Application layer monitoring
There are three ways to grab from the target (scrape) Indicator data :
Exporters ——> Working at the monitored end , Periodically grab data and convert it into pro Compatible format wait prometheus To collect , I don't push
Instrumentation( Built in indicator exposure device ) ——> It means that the monitored object has its own data collection 、 Monitoring function , It only needs prometheus Go straight to get ——docker
Pushgateway ——> Short period 5s—10s Data collection of , Or it is not suitable to pass / Use 7 Index data of layer exposure
4. Business layer monitoring
5、 ... and 、Prometheus Ecological components

1.Prometheus Server: Collect and store time series data adopt scraping Get data by scraping storge(TSDB Time series database ), To develop Rules/Alerts: Alarm rules ,service discovery Is to automatically discover the nodes to be monitored
2.Client Library: Client library , The purpose is to provide... For those who want to be native Instrumentation Functional applications provide a convenient way to develop ;
3.Push Gateway: A gateway that receives metric data typically generated by short-term jobs , And supported by Prometheus Server Pull the index ;
4.Exporters: Used to expose existing applications or services ( I won't support it Instrumentation) The indicators for Prometheus Server and pro Built in data sample collector , Can be defined through the configuration file , tell prometheus Collect indicator data from that monitoring object ,prometheus After collection , Will be stored in their own built-in TSDB In the database , Provides promQL Support query and filter operations , At the same time, user-defined rules are supported as alarm rules , Continuously analyze an index , Once occurred , Notified to alerter To send alarm information , It also supports docking with external UI Tools (grafana) To show the data . collection 、 Capturing data is its own function , But the data that is usually caught comes from :export/instrumentation ( Indicator data exposure device ) To complete , Or the measurement system built in the application itself ( Car dashboard and so on , measurement 、 Exhibition ) To complete
5.Alertmanager: Connect by alarm rules , from Prometheus Server Received " Warning notice " after , By weight removal 、 branch Group 、 After routing and other preprocessing functions, the alarm information can be sent to the user efficiently
6.Data Visualization(Dashboards): And TSDB Dock and display the data in the database ,Prometheus web UI (Prometheus Server The built-in ), And Grafana etc. ;
7.Service Discovery: Dynamically discover the to be monitored Target, This completes the important components of the monitoring configuration , Especially useful in containerized environments ; This component is currently made up of PropetheusServer Built in support
6、 ... and 、prometheus Data model ( What is a label ( Label value )、 What is an indicator 、 What samples are )
What is an indicator : Specific objects that can generate monitoring data . for example cpu Usage rate , Memory free rate is an indicator
What is a label , What is tag value : According to the index name / object , Filter indicator data accurately according to specific conditions , Tags and tag values
Tags and tag values , It is the screening method and basis of indicator data .
The index type
The default is to use Double precision floating point data ( The server has no data type )
- ① counter : The counter is monotonically incremented
- ② gauge: The dashboard : Characterized by undulations
- ③ histogram: Histogram
- ④ summary, Abstract ,histogram Extension type of histogram
边栏推荐
- [development team follows] API specification
- Network communication basic kit -- IPv4 socket structure
- What is the difference between enterprise wechat applet and wechat applet
- CSCI 2134
- Format character%* s
- Tsinghua University product: penalty gradient norm improves generalization of deep learning model
- 96% of the collected traffic is prevented by bubble mart of cloud hosting
- Ningde times and BYD have refuted rumors one after another. Why does someone always want to harm domestic brands?
- Bugku Zhi, you have to stop him
- Rhcsa day 3
猜你喜欢

Constantly changing harmonyos custom JS components during the Spring Festival - Smart Koi
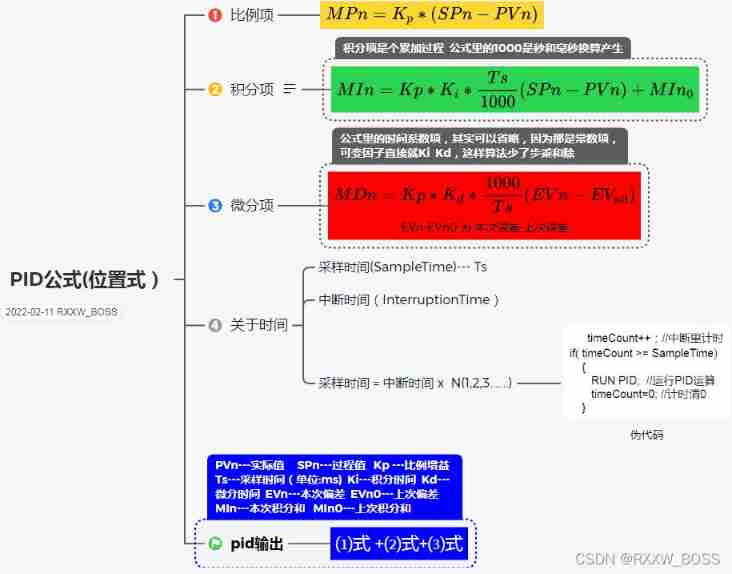
PID of sunflower classic
![Backpropagation formula derivation [Li Hongyi deep learning version]](/img/ef/f76eae39c4f8716a0030a60c85b09c.gif)
Backpropagation formula derivation [Li Hongyi deep learning version]
![Measurement fitting based on Halcon learning [4] measure_ arc. Hdev routine](/img/3a/cf6285ae1c01bda42874eeca9fe5b1.jpg)
Measurement fitting based on Halcon learning [4] measure_ arc. Hdev routine

Have you entered the workplace since the first 00???

3D game modeling is in full swing. Are you still confused about the future?

There is no need to authorize the automatic dream weaving collection plug-in for dream weaving collection
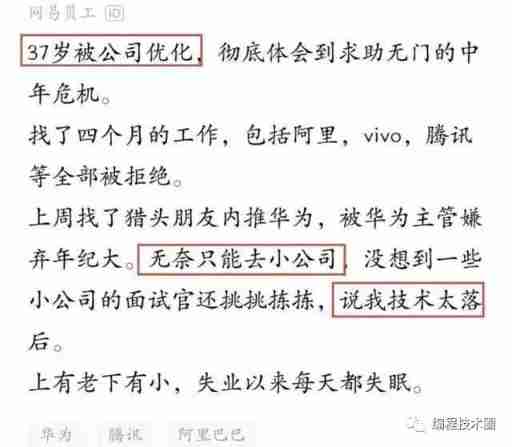
The 37 year old programmer was laid off, and he didn't find a job for 120 days. He had no choice but to go to a small company. As a result, he was confused
C language black Technology: Archimedes spiral! Novel, interesting, advanced~

在尋求人類智能AI的過程中,Meta將賭注押向了自監督學習
随机推荐
Osnabrueck University | overview of specific architectures in the field of reinforcement learning
The 37 year old programmer was laid off, and he didn't find a job for 120 days. He had no choice but to go to a small company. As a result, he was confused
(column 23) typical C language problem: find the minimum common multiple and maximum common divisor of two numbers. (two solutions)
Sword finger offer 14- I. cut rope
Global and Chinese markets for electroencephalogram (EEG) devices 2022-2028: Research Report on technology, participants, trends, market size and share
Zhihu million hot discussion: why can we only rely on job hopping for salary increase? Bosses would rather hire outsiders with a high salary than get a raise?
JS object definition
PHP database connection succeeded, but data cannot be inserted
AI 助力藝術設計抄襲檢索新突破!劉芳教授團隊論文被多媒體頂級會議ACM MM錄用
C # learning notes: structure of CS documents
7 * 24-hour business without interruption! Practice of applying multiple live landing in rookie villages
Bugku Zhi, you have to stop him
12. Gettimeofday() and time()
Dans la recherche de l'intelligence humaine ai, Meta a misé sur l'apprentissage auto - supervisé
基於.NetCore開發博客項目 StarBlog - (14) 實現主題切換功能
Create real-time video chat in unity3d
Add token validation in swagger
Johnson–Lindenstrauss Lemma
The difference between int (1) and int (10)
There is no need to authorize the automatic dream weaving collection plug-in for dream weaving collection