当前位置:网站首页>Statistics of radar data in nuscenes data set
Statistics of radar data in nuscenes data set
2022-07-07 02:36:00 【naca yu】
- Focus on v1.0-mini Version of radar data reading and statistics :
from nuscenes.utils.data_classes import RadarPointCloud
import numpy as np
import matplotlib.pyplot as plt


points_list = []
radar_sensor = [ 'RADAR_BACK_LEFT',
  'RADAR_BACK_RIGHT',
  'RADAR_FRONT',
  'RADAR_FRONT_LEFT',
  'RADAR_FRONT_RIGHT']
# RadarPointCloud The interface of is nuscenes Provide
for sample in nusc.sample:
  for sensor in radar_sensor:
    sensor_token = sample['data'][sensor]
    points = RadarPointCloud.from_file(str(nusc.get_sample_data_path(sensor_token))).points.transpose(1,0).astype(np.float32)
    points_list.append(points)
print('total points {}'.format(len(points_list)))
point_num = 0
min_points = 2000
max_points = -2
for idx, points in enumerate(points_list):
  point_num += points.shape[0]
  min_points = min(points.shape[0], min_points)
  max_points = max(points.shape[0], max_points)
point_num = point_num*1.0 / len(points_list)
print(f'max_points{
      max_points} min_points{
      min_points} average_points{
      point_num}')
- Output
total points 2020
max_points84 min_points0 average_points39.36584158415842
- statistics
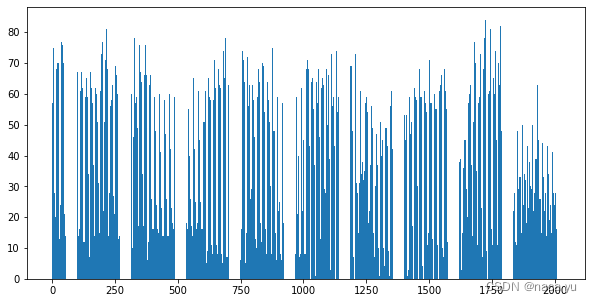
data_dis = [num.shape[0] for num in points_list]

plt.figure(figsize=(10,5))
plt.bar(range(len(data_dis)), data_dis)
- summary :
- As shown in the above figure, frame by frame , Sensor by sensor statistics , Each sensor is distributed :radar_front High data density , Above average
- radar_back The data density of the post radar is high , Even a frame appears 0 Reflection points
- The overall distribution is uneven , And there are multiple reflection points of 0 The phenomenon of
边栏推荐
- Draco - glTF模型压缩利器
- Introduction to the internal structure of the data directory of PostgreSQL
- Lumion 11.0软件安装包下载及安装教程
- Web3的先锋兵:虚拟人
- 一文读懂Faster RCNN
- widerperson数据集转化为YOLO格式
- Linear list --- circular linked list
- 猿桌派第三季开播在即,打开出海浪潮下的开发者新视野
- MySQL --- 常用函数 - 字符串函数
- leetcode:736. Lisp 语法解析【花里胡哨 + 栈 + 状态enumaotu + slots】
猜你喜欢
Data connection mode in low code platform (Part 1)

HAVE FUN | “飞船计划”活动最新进展

MySQL --- 常用函数 - 字符串函数
3 -- Xintang nuc980 kernel supports JFFS2, JFFS2 file system production, kernel mount JFFS2, uboot network port settings, and uboot supports TFTP
3D laser slam: time synchronization of livox lidar hardware

argo workflows源码解析

猿桌派第三季开播在即,打开出海浪潮下的开发者新视野
运维管理系统有哪些特色
postgresql之整體查詢大致過程
![[server data recovery] data recovery case of a Dell server crash caused by raid damage](/img/29/e07bf1f8eae9be19f6eed69be5642d.jpg)
[server data recovery] data recovery case of a Dell server crash caused by raid damage
随机推荐
#yyds干货盘点# 解决名企真题:最大差值
leetcode:5. Longest palindrome substring [DP + holding the tail of timeout]
6-6 vulnerability exploitation SSH security defense
写作系列之contribution
[server data recovery] data recovery case of a Dell server crash caused by raid damage
[leetcode]Search for a Range
wzoi 1~200
Halcon instance to opencvsharp (C openCV) implementation -- bottle mouth defect detection (with source code)
牛客编程题--必刷101之双指针篇
C语言练习题_1
Draco - glTF模型压缩利器
Compress JS code with terser
安德鲁斯—-多媒体编程
Apifox,你的API接口文档卷成这样了吗?
Introduction to FLIR blackfly s industrial camera
Use of pgpool II and pgpooladmin
MetaForce原力元宇宙佛萨奇2.0智能合约系统开发(源码部署)
AWS学习笔记(一)
GEE升级,可以实现一件run tasks
Overall query process of PostgreSQL