当前位置:网站首页>Skywalking theory and Practice
Skywalking theory and Practice
2022-07-02 09:54:00 【Don't talk about Xiao Li】
What is link tracking ?
With more and more services , The analysis of the call chain will become more and more complex There are some common problems , such as :
1. How to concatenate the whole call link , Fast location problem ?
2. How to clarify the dependencies between micro Services ?
3. How to analyze the performance of each micro service interface ?

Link tracking framework comparison
1. Zipkin yes Twitter Open source call chain analysis tool , Currently based springcloud sleuth It has been widely used , It's characterized by light weight , Easy to use and deploy .
2. Pinpoint It is a Korean open source call chain analysis based on bytecode injection , And the application of monitoring and analysis tools . The feature is that it supports a variety of plug-ins ,UI Powerful , The access end has no Code hacking .
3. SkyWalking It is a native open source call chain analysis based on bytecode injection , And the application of monitoring and analysis tools . The feature is that it supports a variety of plug-ins ,UI Strong function , Access end No code intrusion . At present, we have joined Apache The incubator .
4. CAT It is the public comment open source call chain analysis based on coding and configuration , Application monitoring analysis , Log collection , Monitoring alarm and a series of monitoring platform tools .

Performance comparison

Three kinds of concurrent users are simulated :500,750,1000. Use jmeter test , Each thread sends 30 A request , Set your thinking time to 10ms. The sampling rate used is 1, namely 100%, This may be different from production .pinpoint The default sampling rate is 20, namely 50%, By setting agent Change the configuration file of to 100%.zipkin The default is 1. Combine get up , Altogether 12 Kind of .
Let's take a look at the summary table : As can be seen from the table above , Among the three link monitoring components ,skywalking The impact of the probe on throughput is minimal ,zipkin In the middle of throughput .pinpoint Probe to throughput The impact is obvious , stay 500 When concurrent users , Test the throughput of the service from 1385 Down to 774, Great influence . Then look at CPU and memory Influence , On the internal server Pressure test carried out , Yes CPU and memory It's almost all over the world 10% within .
skywalking What is it? ?
According to the official explanation ,Skywalking It's a Observability analysis platform (Observability Analysis Platform, abbreviation OAP) and Application performance management system (Application Performance Management abbreviation APM).
Skywalking Main functional features
1 , Multiple monitoring means , You can use language probes and service mesh Obtain monitored data ;
2、 Support multi language automatic probe , Include Java,.NET Core and Node.JS;
3、 Lightweight and efficient , No need for big data platform and large amount of server resources ;
4、 modularization ,UI、 Storage 、 There are various mechanisms for cluster management ;
5、 Support alarm ;
6、 Excellent visualization solution ;
The community is quite active .Skywalking Has entered Apache incubation , current star The number has exceeded 11k, The latest version 6.5.0 Has been released . Developers are Chinese , You can directly communicate with the project sponsor to solve the problem .
The probe has no inclination **.** contrast CAT A probe with inclination , Advantages . Integration can be carried out without modifying a line of code of the original project .
Excellent probe performance . Some netizens are right about Pinpoint and Skywalking Tested , because Pinpoint Too much data collected , Therefore, the performance loss is large , and Skywalking The performance of the probe is excellent .
There are many supporting components . Especially for RPC Framework support , This is not available in other frameworks .Skywalking Yes Dubbo、gRPC Wait for native support , Even the minority motan and sofarpc All support .
Skywalking Three modules
Agent( probe ):Agent Run in each service instance , Responsible for collecting service instances Trace 、Metrics Data such as , And then through gRPC Report to SkyWalking Back end .
OAP:SkyWalking Back end services , There are two main responsibilities .
One is responsible for receiving Agent Reported Trace、Metrics Data such as , hand Analysis Core ( involve SkyWalking OAP Multiple modules in ) Conduct flow analysis , Finally, the analysis results are written into the persistent storage .SkyWalking have access to ElasticSearch、H2、MySQL As its persistent storage , Generally used online ElasticSearch The cluster acts as its back-end storage .
The other is responsible for responding SkyWalking UI Query request sent from the interface , Query the previously persistent data , The correct response result is returned to UI The interface is displayed .
UI Interface :SkyWalking The front and rear ends are separated , The UI The interface is responsible for encapsulating the user's query operation into GraphQL The request is submitted to OAP The backend triggers subsequent query operations , After receiving the query results, it will be responsible for displaying them on the front end .

Skywalking How to use it? ?


Skywalking theory
- Span: Basic work unit , for example , In a new span Send a RPC Equivalent to sending a response request to RPC,span Through one 64 position ID Unique identification ,trace Take another 64 position ID Express ,span And other data , For example, abstract 、 Timestamp event 、 Key notes (tags)、span Of ID、 And progress ID( Usually IP Address )
span Starting and stopping constantly , At the same time, time information is recorded , When you create a span, You have to stop it at some point in the future . - Trace: A series of spans A tree structure of , for example , If you're running a distributed big data project , You may need to create a trace.
- Annotation: Used to record the existence of an event in time , Some core annotations Used to define the beginning and end of a request
- cs - Client Sent - Client initiates a request , This annotion Describes this span The beginning of
- sr - Server Received - The server gets the request and is ready to start processing it , If you take it sr subtract cs Time stamp can get network delay
- ss - Server Sent - Comments indicate completion of request processing ( When the request returns to the client ), If ss subtract sr The timestamp can get the processing time required by the server
- cr - Client Received - indicate span The end of , The client successfully received the reply from the server , If cr subtract cs The timestamp can get all the time needed for the client to get the reply from the server
take Span and Trace Use... In a system Zipkin The process of annotation is graphical :

Reference documents
1. Microservice link tracking SkyWalking(1).pdf2 Skywalking UI Introduce (1).pdfskywalking principle _Skywalking From entry to mastery _weixin_39603265 The blog of -CSDN Blog
边栏推荐
- Image recognition - data augmentation
- Save video opencv:: videowriter
- Binary and decimal system of C language
- 道阻且长,行则将至
- Read Day5 30 minutes before going to bed every day_ All key values in the map, how to obtain all value values
- Required request body is missing:(跨域问题)
- In SQL injection, why must the ID of union joint query be equal to 0
- MySQL事务
- 每天睡觉前30分钟阅读_day4_Files
- Bugkuctf-web24 (problem solving ideas and steps)
猜你喜欢
2837xd 代码生成——StateFlow(2)

Navicat 远程连接Mysql报错1045 - Access denied for user ‘root‘@‘222.173.220.236‘ (using password: YES)

每天睡前30分钟阅读Day6_Day6_Date_Calendar_LocalDate_TimeStamp_LocalTime
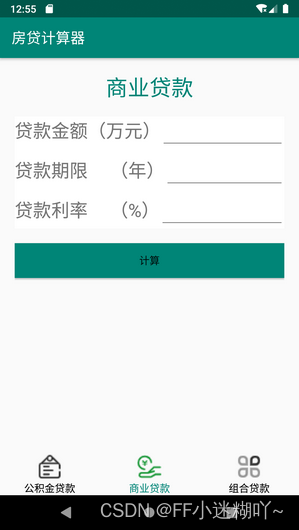
Fragmenttabhost implements the interface of housing loan calculator

2837xd 代码生成——补充(2)

2837xd 代码生成——总结篇

2837xd 代码生成——StateFlow(3)
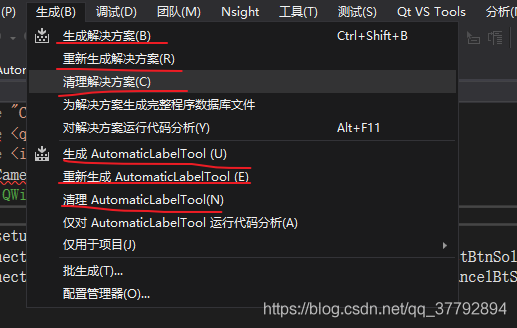
vs+qt 设置应用程序图标

TD conducts functional simulation with Modelsim
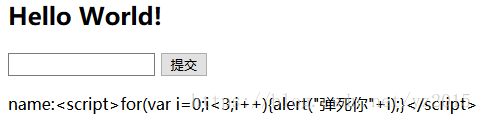
Web security and defense
随机推荐
Personal experience & blog status
并网逆变器PI控制(并网模式)
YOLO物体识别,生成数据用到的工具
Alibaba /热门json解析开源项目 fastjson2
每天睡觉前30分钟阅读_day3_Files
2837xd代码生成模块学习(1)——GPIO模块
Enterprise level SaaS CRM implementation
三相逆变器离网控制——PR控制
职业规划和发展
Fragmenttabhost implements the interface of housing loan calculator
Learn combinelatest through a practical example
C语言之做木桶
个人经历&&博客现状
Int to string, int to qstring
Tinyxml2 reading and modifying files
2837xd code generation - stateflow (1)
2837xd 代码生成——补充(2)
C语言之分草莓
Attack and defense world web advanced area unserialize3
Difference between redis serialization genericjackson2jsonredisserializer and jackson2jsonredisserializer