Introduce
Nmon (Nigel’s Monitor) By IBM Provide 、 Free monitoring AIX System and Linux Tools for system resources . This tool can collect the resource consumption of server system and output a specific file , And available excel Analysis tools (nmon analyser) Statistical analysis of data .
download
Search for downloads nmon, Upload to the server and unzip . I'll use an older version to show you . After decompressing, there is nmon16e_x86_rhel65, and nmon analyser v34a.xls.
- nmon16e_x86_rhel65 In front of it is the executable file , At the end of execution, a monitoring file will be generated , Monitor the server hardware indicators of file record collection , Suffix is .nmon.
- nmon analyser v34a.xls Used to turn this monitoring file into readable Excel form , With chart .
Use steps
The server processes
start-up nmon The command is as follows , Automatically run in the background after startup
./nmon16e_x86_rhel65 -f -s 10 -c 999999999 -m ./
If the first execution fails Permission Denied, perform
chmod +x nmon16e_x86_rhel65 that will do .
Parameter interpretation :
- -s 10 Every time 10 Data is collected every second .
- -c 999999999 collection 999999999 Secondary hardware data , It means to collect for a long time
- -f The generated data file name contains the time the file was created .
- -m The storage directory of the generated data file is the current directory .
[root@localhost nmontest]# ./nmon16e_x86_rhel65 -f -s 10 -c 999999999 -m ./
[root@localhost nmontest]# ls -lrt
total 372
-rwxr-xr-x. 1 root root 347506 Jul  1  2016 nmon16e_x86_rhel65
-rw-r--r--. 1 root root  29653 Aug  5 15:02 localhost_200805_1502.nmon
The name of the monitoring file is “ Host name + Time ” form ,nmon File according to sampling interval , Keep writing data
[root@localhost nmontest]# tail -f localhost_200805_1502.nmon
VM,T0004,2,0,0,1247,7428,-1,0,0,0,0,37,0,0,0,0,0,0,0,0,0,0,0,0,0,0,0,0,0,0,0,0,0,0,0,0,0,0
PROC,T0004,1,0,81.4,-1.0,-1.0,-1.0,0.8,-1.0,-1.0,-1.0
NET,T0004,0.0,0.1,0.0,0.0,0.0,0.1,0.0,0.0
NETPACKET,T0004,0.0,1.5,0.0,0.0,0.0,0.8,0.0,0.0
JFSFILE,T0004,29.6,0.0,1.4,29.6,13.3
DISKBUSY,T0004,0.0,0.0,0.0,0.0,0.0,0.0
DISKREAD,T0004,0.0,0.0,0.0,0.0,0.0,0.0
DISKWRITE,T0004,0.0,0.0,0.0,0.0,0.0,0.0
DISKXFER,T0004,0.0,0.0,0.0,0.0,0.0,0.0
End of collection , close nmon
[root@localhost nmontest]# ps -ef | grep nmon
root      5226     1  0 15:02 pts/0    00:00:00 ./nmon16e_x86_rhel65 -f -s 10 -c 999999999 -m ./
root      6626  3519  0 15:24 pts/0    00:00:00 grep --color=auto nmon
[root@localhost nmontest]# kill -9 5226
This machine processes
take nmon The files are transferred to the local computer (ASCII Format transfer ), use nmon analyser v34a.xls Transformation format . If there is a macro related warning , Press “ Tools -> macro -> Security -> Choose low security ” that will do .

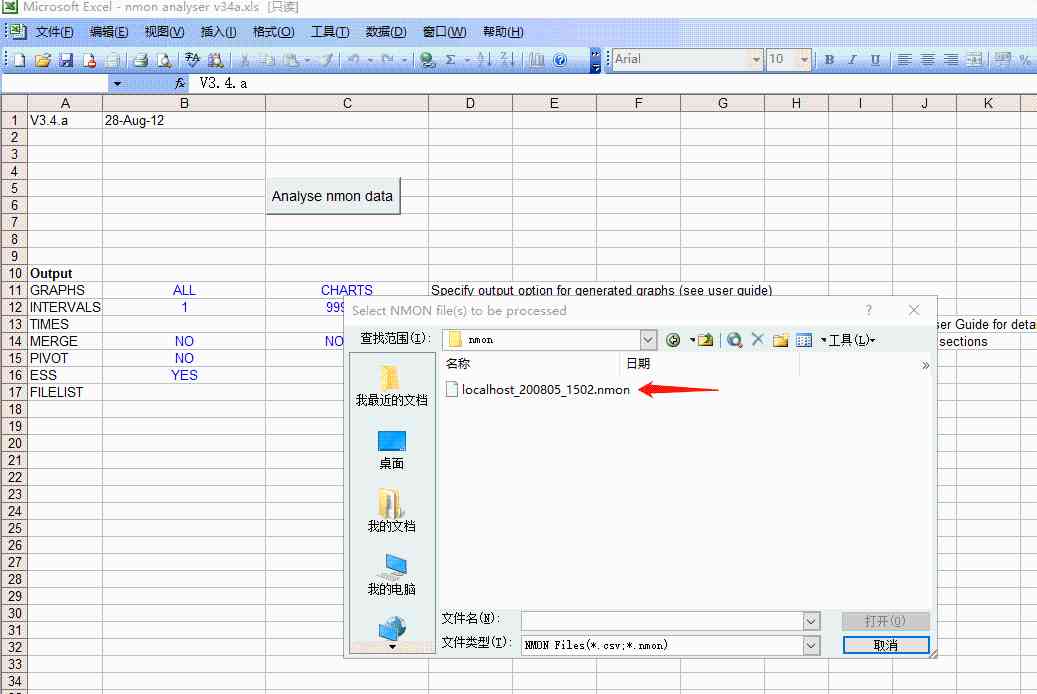
Pop up the window many times , Ask if you want to replace the existing x86 Definition , Click it all .
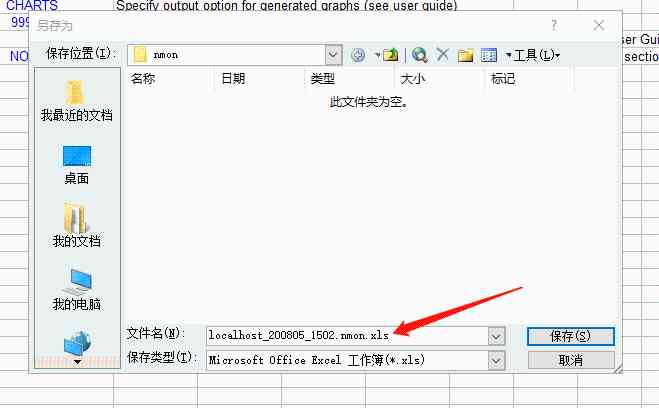
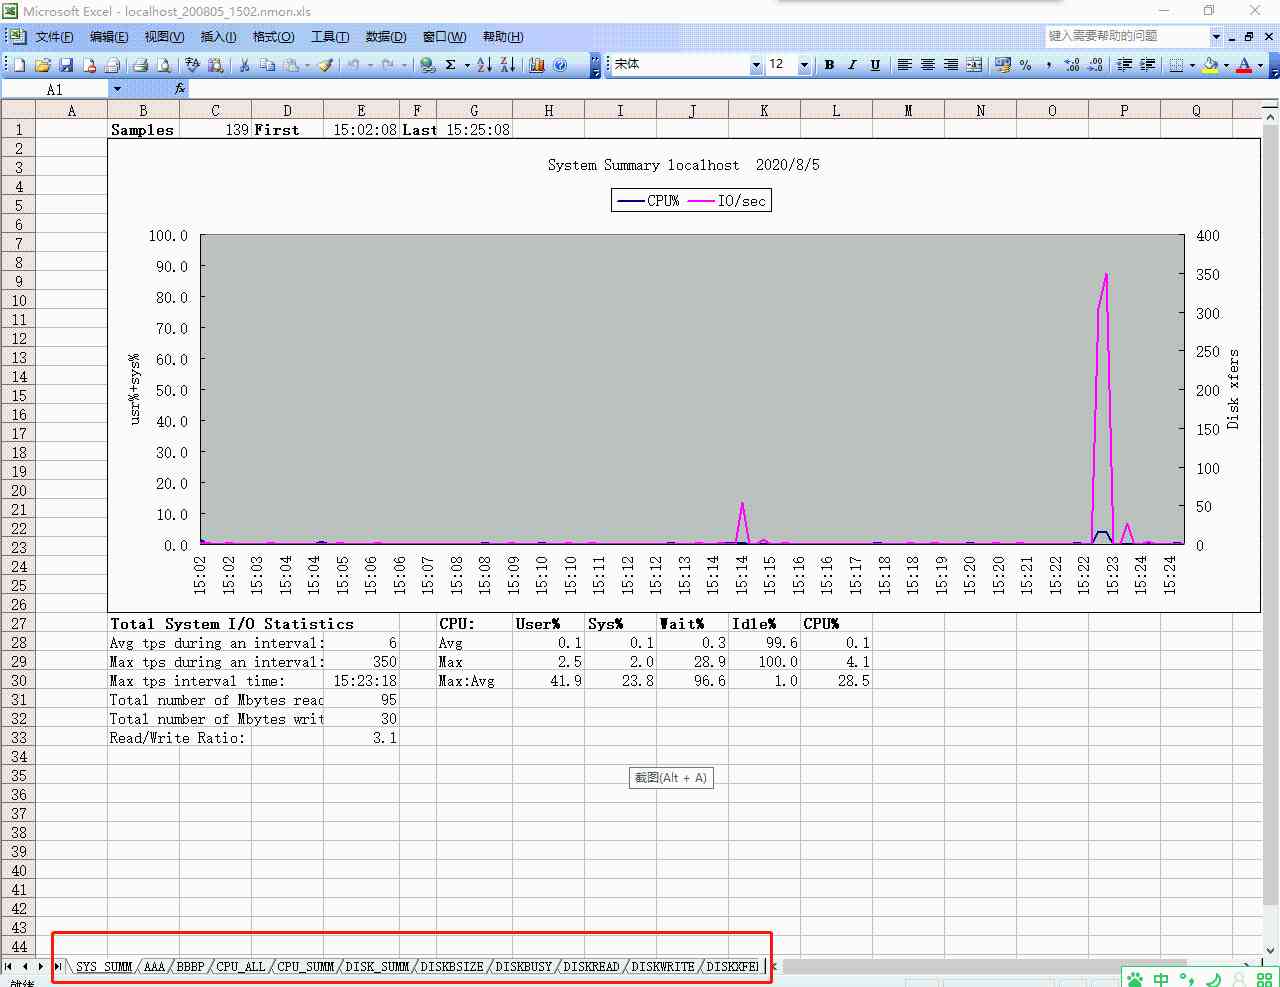
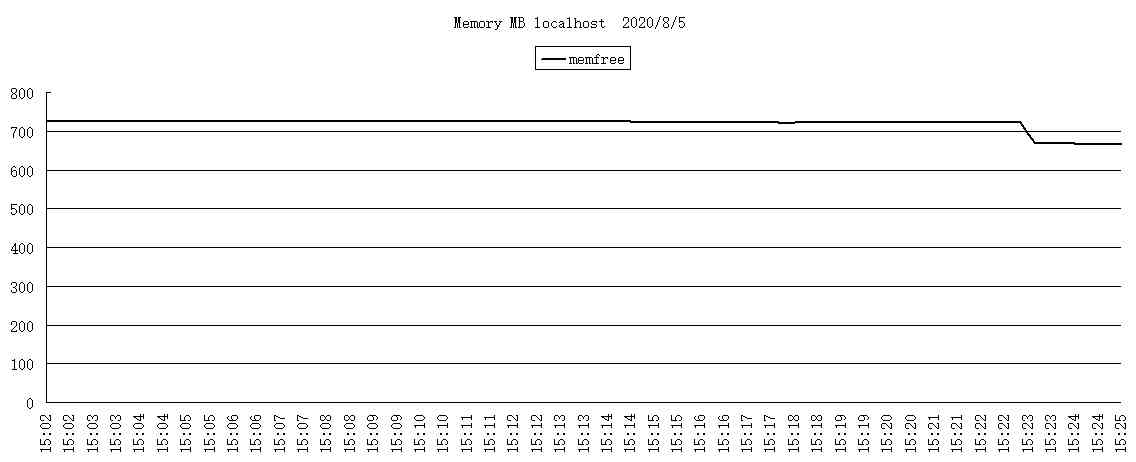
preservation xls File format . open xls file . The label name below represents the hardware indicators monitored by the tag ,
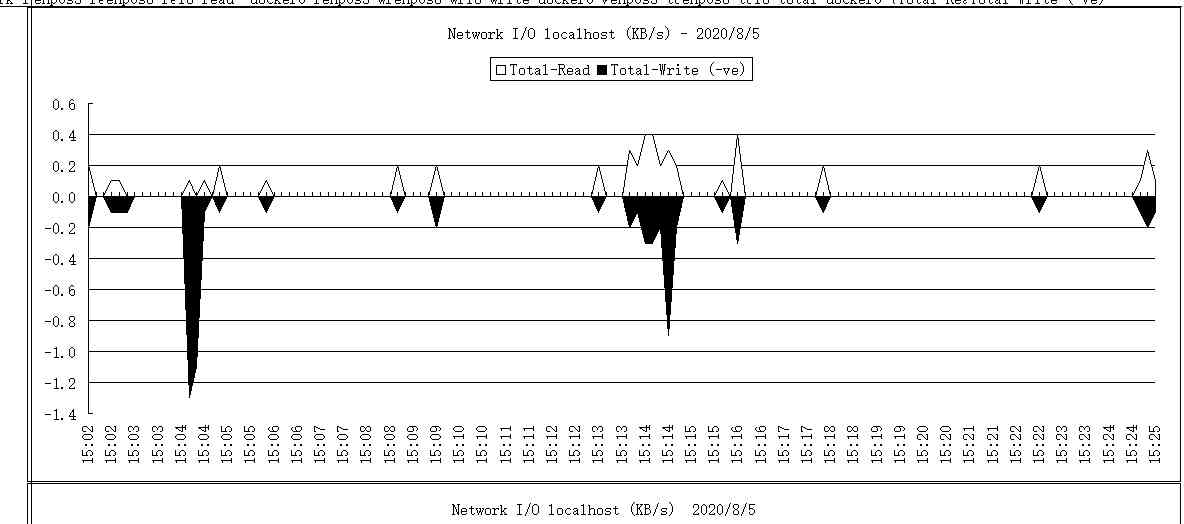
Here are the metrics for monitoring network and memory usage .
summary
nmon It can collect hardware information for a long time , If the collection interval is large, the impact on server performance can be ignored . It is suitable for collecting for a period of time , For example, collecting for a few days , Then summarize the analysis scenarios . Through the analysis of hardware resource occupation change reason , There will be a lot of new discoveries , So that we have a better grasp of the system . But not for real-time monitoring .
![[cloud service] there are so many ECS instances on alicloud server, how to select the type? Best practice note](/img/fe/1d868fd0087758416a6f1de6016587.jpg)

