当前位置:网站首页>Write it down once Net travel management background CPU Explosion Analysis
Write it down once Net travel management background CPU Explosion Analysis
2022-07-03 03:46:00 【Dotnet cross platform】
One : background
1. Tell a story
Some time ago, a friend found me on wechat , Talk about him web System cpu After running for a period of time, it exploded , Let me help you see what's going on , Let's see , Make a statement , I think dump It's free. , It's mainly about tempering your skills , There is no high technical analysis cost of a software engineer .
Without further ado , Let's go windbg speak .
Two :WinDbg analysis
1. CPU Is it really high
Is it really high , We have to verify it by ourselves , Use !tp Just take a look at the order .
0:065> !tp
CPU utilization: 81%
Worker Thread: Total: 32 Running: 7 Idle: 25 MaxLimit: 8191 MinLimit: 32
Work Request in Queue: 1
    AsyncTimerCallbackCompletion [email protected]
--------------------------------------
Number of Timers: 1
--------------------------------------
Completion Port Thread:Total: 4 Free: 4 MaxFree: 64 CurrentLimit: 4 MaxLimit: 1000 MinLimit: 32
From the perspective of hexagrams , Do exist CPU High explosion , Based on past experience , The boom in managed programs is mostly due to GC Triggered , But the trigger GC There are many strange reasons , After all, clr level GC The cause of triggering is as high as 14 Kind of , The code is as follows :
static const char* const str_gc_reasons[] =
{
    "alloc_soh",
    "induced",
    "lowmem",
    "empty",
    "alloc_loh",
    "oos_soh",
    "oos_loh",
    "induced_noforce",
    "gcstress",
    "induced_lowmem",
    "induced_compacting",
    "lowmemory_host",
    "pm_full_gc",
    "lowmemory_host_blocking"
};
2. It's really GC Trigger
Verify whether the current program is GC Trigger , There are many ways , It can be used !t perhaps !t -special, But these two methods are not particularly accurate , The most accurate is based on GC Mode goes directly to CLR Search for global variables in clr!SVR::gc_heap::gc_started The value of , Refer to the following :
0:038> dp clr!SVR::gc_heap::gc_started L1
712d3190  00000001
You can see , At this time gc_started=1, explain GC Is the trigger state , Next, you can search from all the thread stacks garbage_collect perhaps gc1 What keywords can .
0:038> k
 # ChildEBP RetAddr
00 0318f934 70de8248     clr!SVR::gc_heap::relocate_survivor_helper+0x1ea
01 0318f944 70de83df     clr!SVR::gc_heap::relocate_survivors_in_plug+0x24
02 0318f970 70de84ac     clr!SVR::gc_heap::relocate_survivors_in_brick+0x70
03 0318f9a8 70de830b     clr!SVR::gc_heap::relocate_survivors+0xe4
04 0318fa00 70de218a     clr!SVR::gc_heap::relocate_phase+0xb9
05 0318fbb4 70de18bf     clr!SVR::gc_heap::plan_phase+0x136e
06 0318fbec 70de1d49     clr!SVR::gc_heap::gc1+0x101
07 0318fc3c 70de1421     clr!SVR::gc_heap::garbage_collect+0x746
08 0318fc58 70ddacde     clr!SVR::gc_heap::gc_thread_function+0x14a
09 0318fc6c 70ddac6f     clr!SVR::gc_heap::gc_thread_stub+0x72
0a 0318fc80 770a6a14     clr!GCThreadStub+0x1f
0b 0318fc94 77e4a9ef     kernel32!BaseThreadInitThunk+0x24
0c 0318fcdc 77e4a9ba     ntdll!__RtlUserThreadStart+0x2f
0d 0318fcec 00000000     ntdll!_RtlUserThreadStart+0x1b
From the perspective of hexagrams ,gc_thread_stub Indicates that the current is a GC Threads , It is in relocate_phase Stage , This shows that the current is a Compression recovery ,GC See the official documents for the recycling flow chart .
GarbageCollectGeneration()
    {
        SuspendEE();
        garbage_collect();
        RestartEE();
    }

    garbage_collect()
    {
        generation_to_condemn();
        gc1();
    }

    gc1()
    {
        mark_phase();
        plan_phase();
    }

    plan_phase()
    {
        // actual plan phase work to decide to
        // compact or not
        if (compact)
        {
            relocate_phase();
            compact_phase();
        }
        else
            make_free_lists();
    }
At this stage , The managed heap can also be in a corrupt state , You can use it. !dumpheap -stat To validate the .
0:038> !dumpheap -stat
The garbage collector data structures are not in a valid state for traversal.
It is either in the "plan phase," where objects are being moved around, or
we are at the initialization or shutdown of the gc heap. Commands related to
displaying, finding or traversing objects as well as gc heap segments may not
work properly. !dumpheap and !verifyheap may incorrectly complain of heap
consistency errors.
Object <exec cmd="!ListNearObj /d 03301000">03301000</exec> has an invalid method table.
3. Why does compression recycling occur
Generally speaking ,GC It is divided into cleaning and compression recycling , The latter is a heavyweight operation , Very hurt GC, It's a little better in the temporary section , Next, let's look at the current GC Which generation is being recycled ? You can go to CLR Check the judgment generation field inside .clr!WKS::GCHeap::GcCondemnedGeneration.
0:038> dp clr!SVR::GCHeap::GcCondemnedGeneration L1
712d79d8  00000002
A bad , The result is a 2, This 2 Express fullGC, That is, full recovery , Most of them correspond to gc_reason=lowmem The situation of , That is, there is not enough memory .
4. Is there really insufficient memory
To find out , We use it !address -summary Take a look at the current virtual memory situation .
0:038> !address -summary

--- Usage Summary ---------------- RgnCount ----------- Total Size -------- %ofBusy %ofTotal
<unknown>                              1835          dce6e000 (   3.452 GB)  91.56%   86.29%
Image                                   842           f436000 ( 244.211 MB)   6.33%    5.96%
Free                                    312           eba5000 ( 235.645 MB)            5.75%
Stack                                   451           2d80000 (  45.500 MB)   1.18%    1.11%
Heap                                     72           2342000 (  35.258 MB)   0.91%    0.86%
TEB                                     150             96000 ( 600.000 kB)   0.02%    0.01%
Other                                     7             4e000 ( 312.000 kB)   0.01%    0.01%
PEB                                       1              1000 (   4.000 kB)   0.00%    0.00%

--- Type Summary (for busy) ------ RgnCount ----------- Total Size -------- %ofBusy %ofTotal
MEM_PRIVATE                            2051          dd635000 (   3.459 GB)  91.76%   86.48%
MEM_IMAGE                              1267          11ad1000 ( 282.816 MB)   7.33%    6.90%
MEM_MAPPED                               40           2345000 (  35.270 MB)   0.91%    0.86%

--- State Summary ---------------- RgnCount ----------- Total Size -------- %ofBusy %ofTotal
MEM_COMMIT                             2604          cbe7d000 (   3.186 GB)  84.51%   79.65%
MEM_RESERVE                             754          255ce000 ( 597.805 MB)  15.49%   14.60%
MEM_FREE                                312           eba5000 ( 235.645 MB)            5.75%

--- Largest Region by Usage ----------- Base Address -------- Region Size ----------
<unknown>                                    3300000          20087000 ( 512.527 MB)
Image                                       6f819000            f5f000 (  15.371 MB)
Free                                        fea50000           1590000 (  21.562 MB)
Stack                                        3110000             7a000 ( 488.000 kB)
Heap                                        3bc80000            621000 (   6.129 MB)
TEB                                         fe6e5000              1000 (   4.000 kB)
Other                                       fea10000             33000 ( 204.000 kB)
PEB                                         fea49000              1000 (   4.000 kB)
From the perspective of hexagrams , Current MEM_COMMIT=3.186G, maximal Free block Free=15.371MB, According to the memory address shown before , We found that this program is 32bit , ran 64bit On the machine , In this case, the program can occupy up to 4G Memory space , although MEM_RESERVE= 597.805 MB, But this RESERVE It's scattered , Essentially, the program at this time is Virtual address tension , because Virtual address nervous , Lead to GC Constantly doing Full memory Recycling .
3、 ... and : summary
Based on the above analysis , GC The main reason for triggering is 32bit programmatic 4G Due to memory limitations , Lead to GC Keep recycling in full , This kind of scene really makes GC Very embarrassed , The priority solution is to change the program to 64bit, Let's see how to optimize program memory later , After all, now Managed heap In a damaged state , It's not easy to analyze .
边栏推荐
- 编译文件时报错:错误: 编码GBK的不可映射字符
- [DRM] simple analysis of DRM bridge driver call process
- Limit of one question per day
- [combinatorics] basic counting principle (addition principle | multiplication principle)
- [mathematical logic] normal form (conjunctive normal form | disjunctive normal form | major item | minor item | maximal item | minor item | principal conjunctive normal form | principal disjunctive no
- Leetcode: dynamic planning template
- 8.8.2-PointersOnC-20220214
- [learning notes] seckill - seckill project - (11) project summary
- Introduction à mongodb
- node,npm以及yarn下载安装
猜你喜欢

Pytorch轻量级可视化工具wandb(local)

MongoDB简介

900w+ data, from 17s to 300ms, how to operate

Message queue addition failure
![Learning notes of C programming [compiled by Mr. Tan Haoqiang] (Chapter III sequence programming) 04 C sentence](/img/60/bae0e8d92a53bcd2b2de3fb22b3b99.jpg)
Learning notes of C programming [compiled by Mr. Tan Haoqiang] (Chapter III sequence programming) 04 C sentence
机械臂速成小指南(八):运动学建模(标准DH法)

Without sxid, suid & sgid will be in danger- Shangwen network xUP Nange
pytorch项目怎么跑?
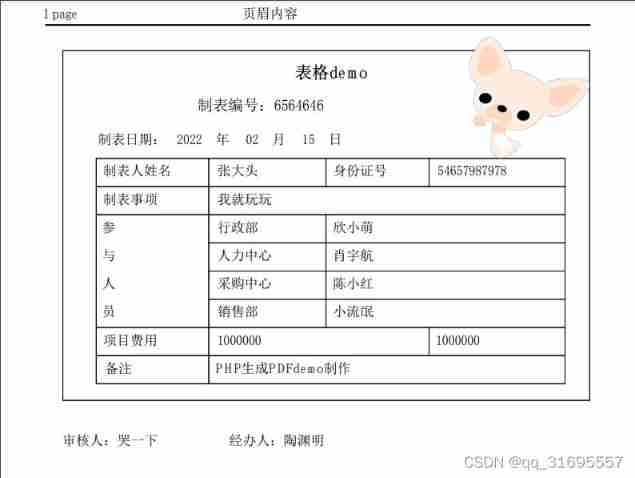
PHP generates PDF tcpdf

Limit of one question per day
随机推荐
Mysql Mac版下载安装教程
Application of derivative in daily question
学会pytorch能干什么?
[mathematical logic] propositional logic (propositional and connective review | propositional formula | connective priority | truth table satisfiable contradiction tautology)
Recursion: quick sort, merge sort and heap sort
Null and undefined
Web session management security issues
简易版 微信小程序开发之页面跳转、数据绑定、获取用户信息、获取用户位置信息
TCP/IP模型中的重磅嘉宾TCP--尚文网络奎哥
Summary of determinant knowledge points in Chapter 1 of Linear Algebra (Jeff's self perception)
Small guide for rapid formation of manipulator (VIII): kinematic modeling (standard DH method)
[mathematical logic] propositions and connectives (propositions | propositional symbolization | truth connectives | no | conjunction | disjunction | non truth connectives | implication | equivalence)
Advanced redis applications [password protection, data persistence, master-slave synchronization, sentinel mode, transactions] [not completed yet (semi-finished products)]
如何迈向IPv6之IPv6过渡技术-尚文网络奎哥
[combinatorics] basic counting principle (addition principle | multiplication principle)
[embedded module] OLED display module
Docker install and start MySQL service
Limit of one question per day
900w+ data, from 17s to 300ms, how to operate
Table structure of Navicat export database