当前位置:网站首页>Thoroughly understand box plot analysis
Thoroughly understand box plot analysis
2022-08-04 06:05:00 【I'm fine please go away thank you】
Learn from this article
Article table of contents
I. Box plot
Box plot (English: Box plot), also known as box and whisker plot, box plot, box plot or boxplot, is a statistical chart used to display the dispersion of a set of data.Named for its shape like a box.It is also often used in various fields, commonly used in quality management, to quickly identify outliers.
The biggest advantage of the box plot is that it is not affected by outliers, can accurately and stably depict the discrete distribution of the data, and is also conducive to data cleaning.
If you want to understand the box plot, then you must understand...
Two and five factors "number"
Let's take a set of serial numbers as an example: 12, 15, 17, 19, 20, 23, 25, 28, 30, 33, 34, 35, 36, 37 to explain these five major "numbers".
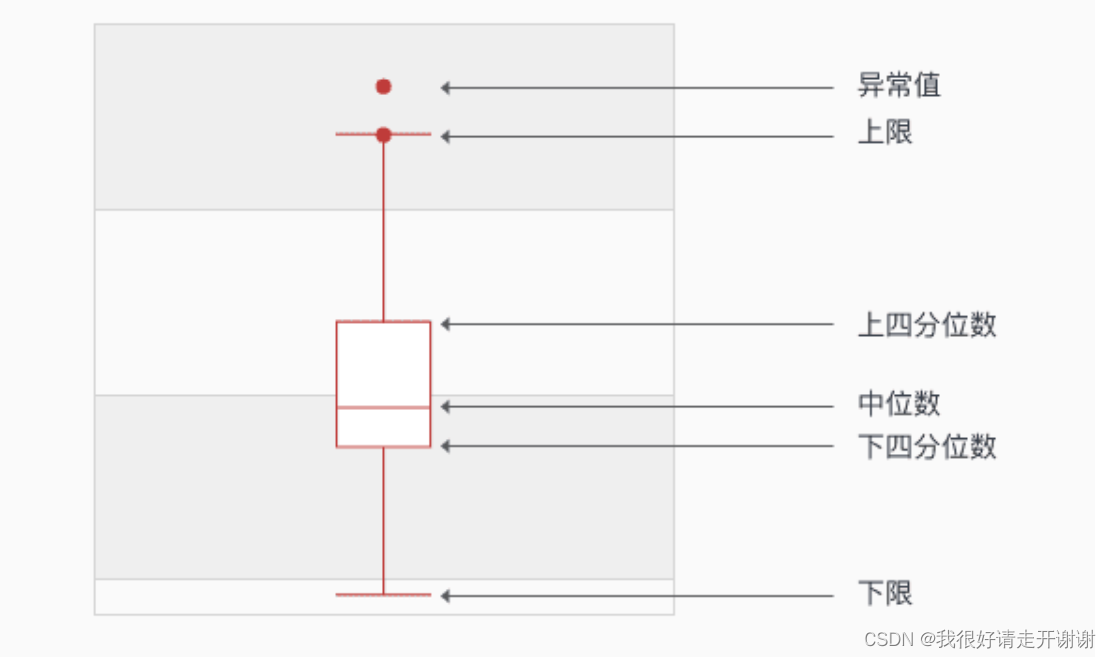
1, lower quartile Q1
(1) Determine the position of the quartiles.Qi's position=i(n+1)/4, where i=1, 2, 3.n represents the number of items contained in the sequence.
(2) According to the location, calculate the corresponding quartile.
Example:
The position of Q1=(14+1)/4=3.75,
Q1=0.25×third term+0.75×fourth term=0.25×17+0.75×19=18.5;
2, median (second quartile) Q2
The median is the number in the middle of a group of numbers arranged from small to large.If the number of sequences is even, the median of the group is the average of the two middle numbers.
Example:
The position of Q2=2(14+1)/4=7.5,
Q2=0.5×the seventh term+0.5×the eighth term=0.5×25+0.5×28=26.5
3, upper quartile Q3
The calculation method is the same as the lower quartile.
Example:
The position of Q3=3(14+1)/4=11.25,
Q3=0.75×eleventh term+0.25×twelfth term=0.75×34+0.25×35=34.25.
4, upper limit
The upper limit is the maximum value within the non-anomalous range.
The first thing to know is what is the interquartile range and how is it calculated?
Interquartile range IQR=Q3-Q1, then upper limit=Q3+1.5IQR
5, lower limit
The lower bound is the minimum value within the non-anomalous range.
Lower limit=Q1-1.5IQR
Three, the value of the box plot
1. Intuitively identify outliers in data batches
I have talked about identifying outliers for a long time. In fact, the standard for judging outliers in boxplots is based on quartiles and interquartile ranges. The quartiles have a certain resistance, up to 25%The data can become arbitrarily far away without greatly disturbing the quartiles, so the outliers do not affect the data shape of the boxplot, and the results of the boxplot to identify outliers are more objective.It can be seen that the boxplot has certain advantages in identifying outliers.
2. Use boxplots to determine skewness and tail weight of data batches
For a standard normally distributed sample, there are very few outliers.The more outliers, the heavier the tail and the smaller the degrees of freedom (that is, the number of freely changing quantities);
The skewness indicates the degree of deviation. If the outliers are concentrated on the side of the smaller value, the distribution is left-skewed; if the outliers are concentrated on the side of the larger value, the distribution is right-skewed.
3. Use boxplots to compare the shapes of several batches of data
On the same number line, the boxplots of several batches of data are arranged in parallel, and the shape information such as the median, tail length, outliers, and distribution interval of several batches of data is clearly revealed.As shown in the figure above, it can be intuitively seen that the sales of each branch in the third quarter are generally declining.
But the box plot also has its limitations, such as: it cannot accurately measure the skewness and tail weight of the data distribution; for large batches of data, the reflected information is more ambiguous and the median represents the overall evaluation levelThere are certain limitations.
边栏推荐
猜你喜欢
随机推荐
Matplotlib中的fill_between;np.argsort()函数
postgresql 事务隔离级别与锁
CTFshow—Web入门—信息(9-20)
k3s-轻量级Kubernetes
NFT市场开源系统
8.30难题留坑:计数器问题和素数等差数列问题
超详细MySQL总结
SQl练习 2022/6/29
SQL练习 2022/7/3
攻防世界MISC———Dift
MySql的concat和group_concat的区别
postgresql中创建新用户等各种命令
RecyclerView的用法
lmxcms1.4
NFT市场以及如何打造一个NFT市场
Learning curve learning_curve function in sklearn
视图、存储过程、触发器
判断字符串是否有子字符串重复出现
The pipeline mechanism in sklearn
线性回归简介01---API使用案例