当前位置:网站首页>jvm three heap and stack
jvm three heap and stack
2022-08-05 05:04:00 【Xi small 2】
一、堆
1.1、什么是堆
Java 堆是虚拟机所管理的内存中最⼤的⼀块,Java 堆是所有线程共享的⼀块内存区域,在虚拟机启动时创建.此内存区域的唯⼀⽬的就是存放对象实例,⼏乎所有的对象实例以及数组都在这⾥分配内存
1.2、堆中存放的数据
1.通过new关键 ,创建的对象存放在堆中;
2.所有线程会共享到同一个堆内存;
3.在堆内存中是有垃圾回收机制的;
1.3、A memory leak occurs
堆内存泄漏问题
内存泄漏(Memory Leak)是指程序中已动态分配的堆内存由于某种原因程序未释放或无法释放,造成系统内存的浪费,导致程序运行速度减慢甚至系统崩溃等严重后果.
内存泄漏: Many objects are created and stored in heap memory,GCAfter being recycled many times, the garbage object cannot be cleaned up.
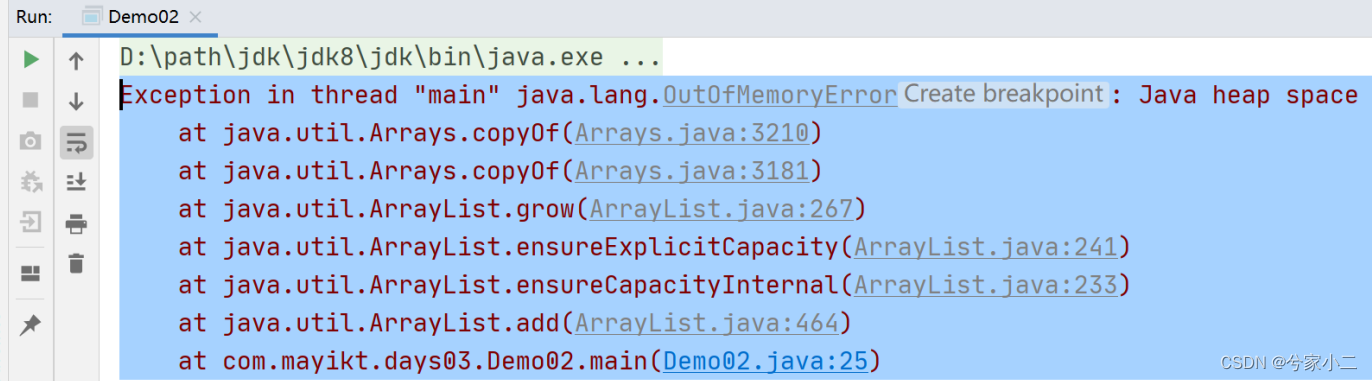
内存泄漏示例1
- 设置 jvm 测试-Xmx8m When we loop over the data new 出来放到list 中, UserEntity 对象一直被list 引用,无法存放gc 回收,从而内存泄漏 导致 内存溢出
/** * 演示堆内存溢出 -Xmx8m * * @param args */
public static void main(String[] args) {

    List list = new ArrayList<>();
    while (true) {

        list.add(new UserEntity());
    }
}


public class UserEntity {

    // 申请 1mb 空间
    private byte[] mayiktByte = new byte[1024 * 1024];
}
内存泄漏示例2
如下示例:
bytes 如果不设置为null , will always take up space,Even active System.gc(),Can't clean up either
  public static void main(String[] args) throws InterruptedException {

        System.out.println("1");    // 堆内存 假设 5mb
        Thread.sleep(1000 * 30);    // 阻塞30s
        byte[] bytes = new byte[1024 * 1024 * 10];// 申请10mb内存
        System.out.println("2");    // 堆内存 假设 15mb
        Thread.sleep(1000 * 30);    // 阻塞30s
        bytes = null;               // null GCRoot 引用链
        System.gc();                // 主动调用GC方法 不会立即清理 Heap memory garbage notification
        System.out.println("3");    // gc回收 15-10mb 5mb左右
        Thread.sleep(1000 * 10000);
    }
其他:
- 1、错误使用了 Threadlocal
- 2、HashMap 自定义key 可以导致
1.4、内存溢出:
内存溢出 一般都是 problems caused by memory leaks, gcGarbage objects cannot be recycled,Re-applying for heap memory,The new memory storage object has no space to use
出现情况:
- 1、数据库表中 存放几千万条数据---- limit 0,100000 (分页查询 limit 0,20)
- 2、循环代码 一直new 新的对象存放在我们的集合中, 使用完后未清空,使得JVM不能回收(All complete empty collections,Or avoid large amounts of data)
- 3、使用的第三方软件中的BUG
- 4、启动参数内存值设定的过小,如最大堆内存10mb (Increase heap memory space)
- 5、代码中存在死循环或循环产生过多重复的对象实体;
内存溢出(Out Of Memory)应用系统中存在无法回收的内存或使用的内存过多,最终使得程序运行要用到的内存大于能提供的内存.
1.5、Check whether the heap usage is too large
Win操作系统打开任务管理系统 查看到那个进程占用cpu比较高即可
Linux 可使用arthas(阿尔萨斯) 排查cpu飙高的问题
# 1.下载阿尔萨斯
curl -O https://arthas.aliyun.com/arthas-boot.jar
2. java -jar arthas-boot.jar
3. Select the underlying process to run 输入1
4. thread -n 3
1.5、How to check the size of objects occupied by the heap
1、命令
1.Jps 查看当前系统中有哪些Java进程
需安装 jdk
jps                     # 查看当前系统中有哪些Java进程
jmap -heap 进程id       # 查看堆内存占用情况
2、使用图形化界面 Jvisualvm 或者是 jconsole.exe
jdk 安装目录下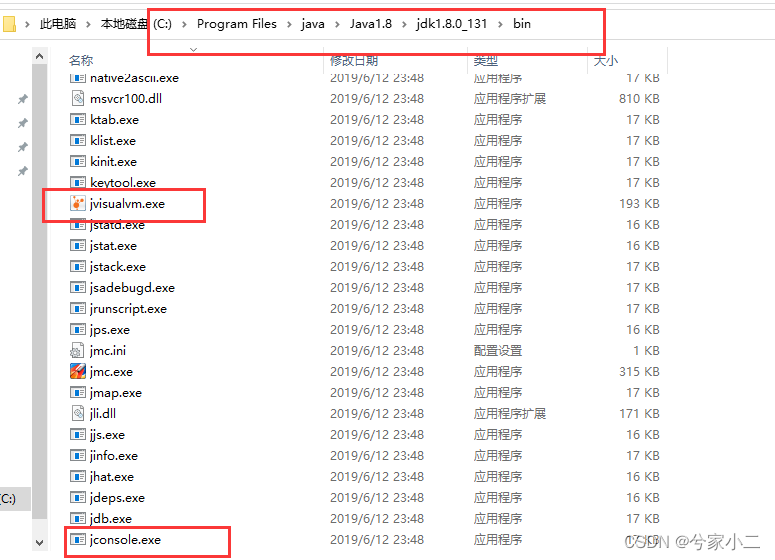
使用 Jvisualvm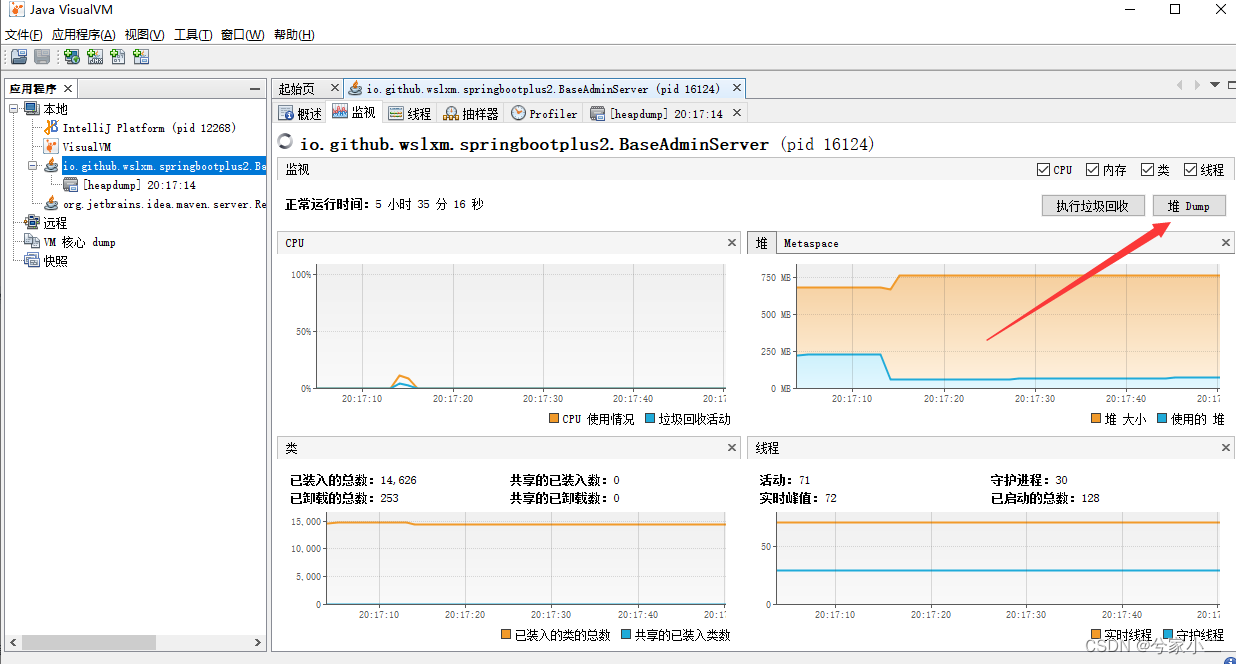
View the maximum occupied memory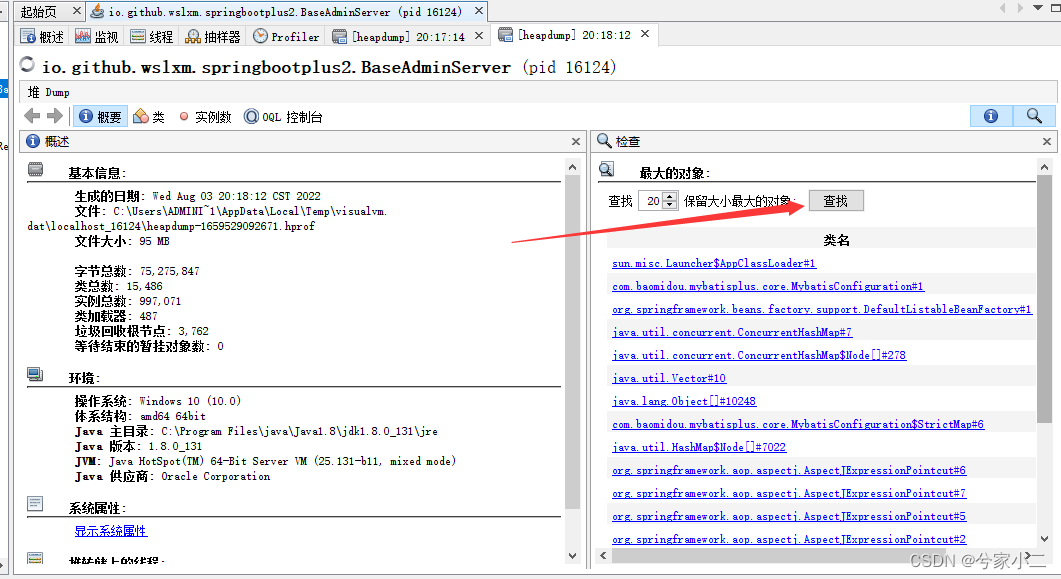
边栏推荐
猜你喜欢
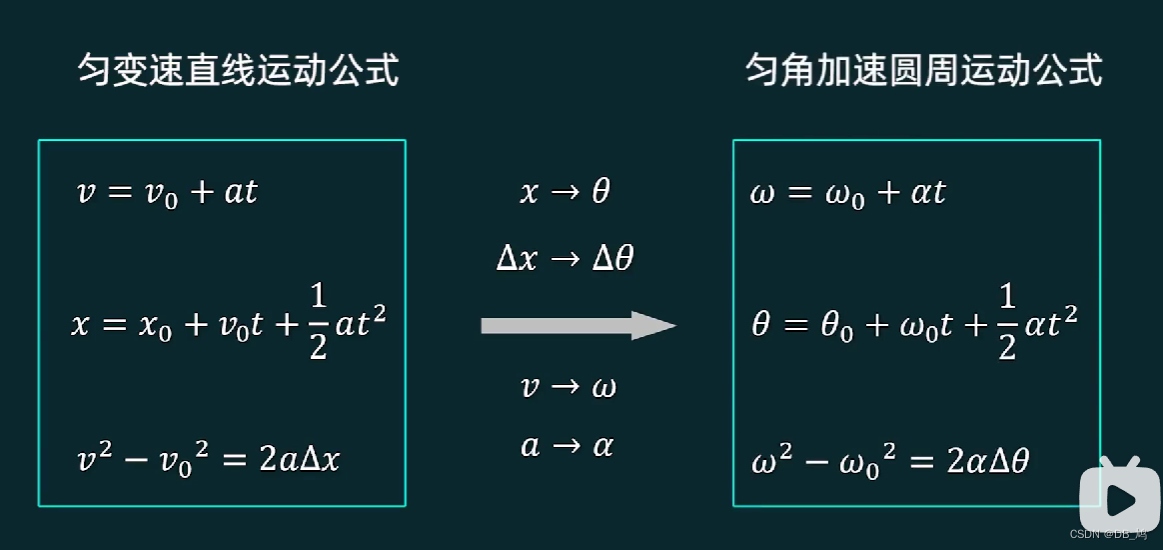
大学物理---质点运动学
![[BJDCTF2020] EasySearch](/img/60/464de3bcdda876171b9f61ad31bff1.png)
[BJDCTF2020] EasySearch
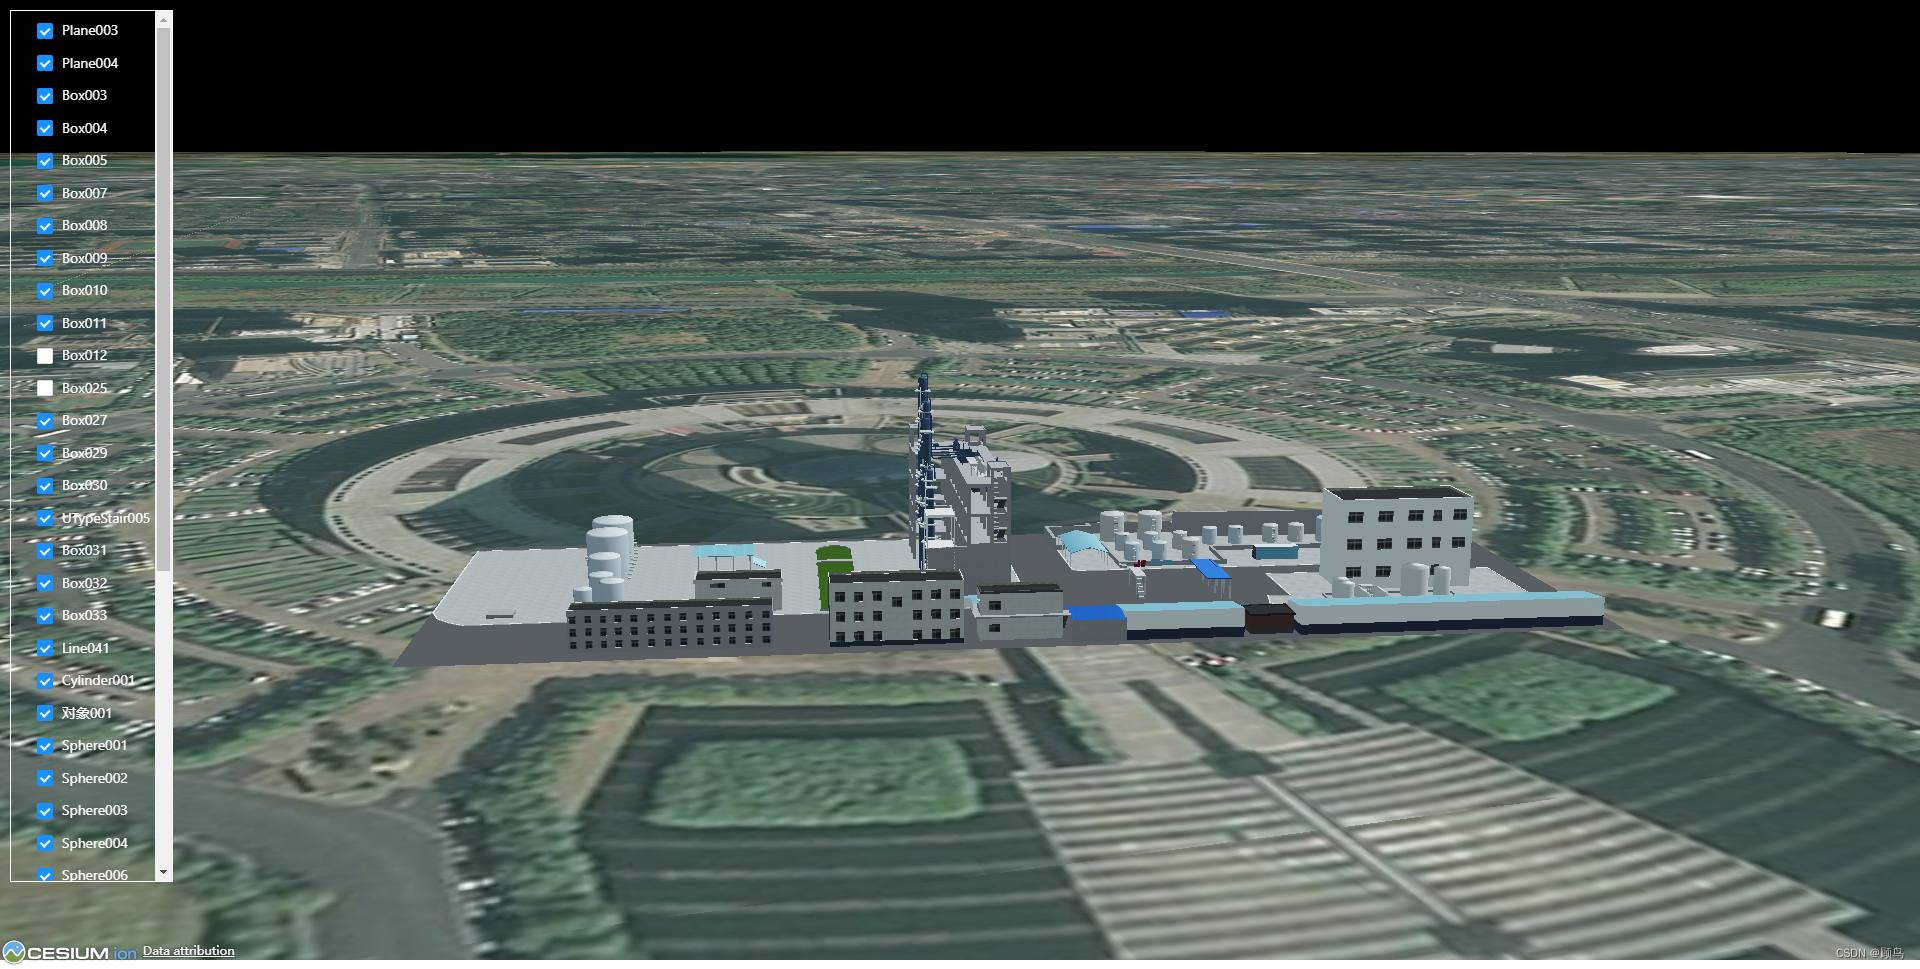
【cesium】3D Tileset 模型加载并与模型树关联
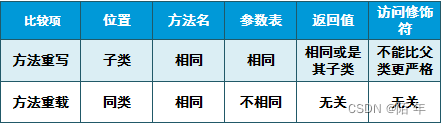
Day019 Method overriding and introduction of related classes
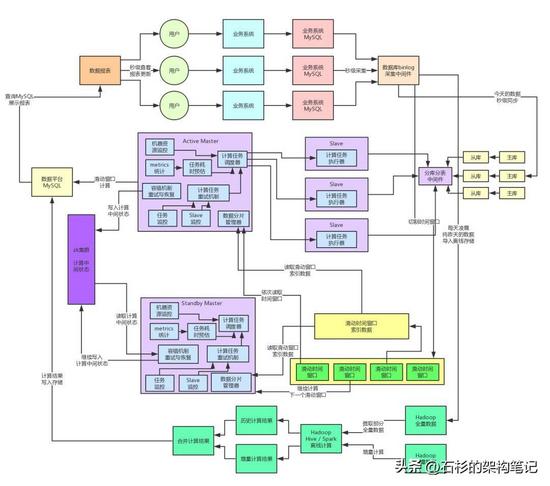
开发一套高容错分布式系统

什么是ASEMI光伏二极管,光伏二极管的作用
How to identify false evidence and evidence?

Analyses the mainstream across technology solutions
使用IDEA连接TDengine服务器
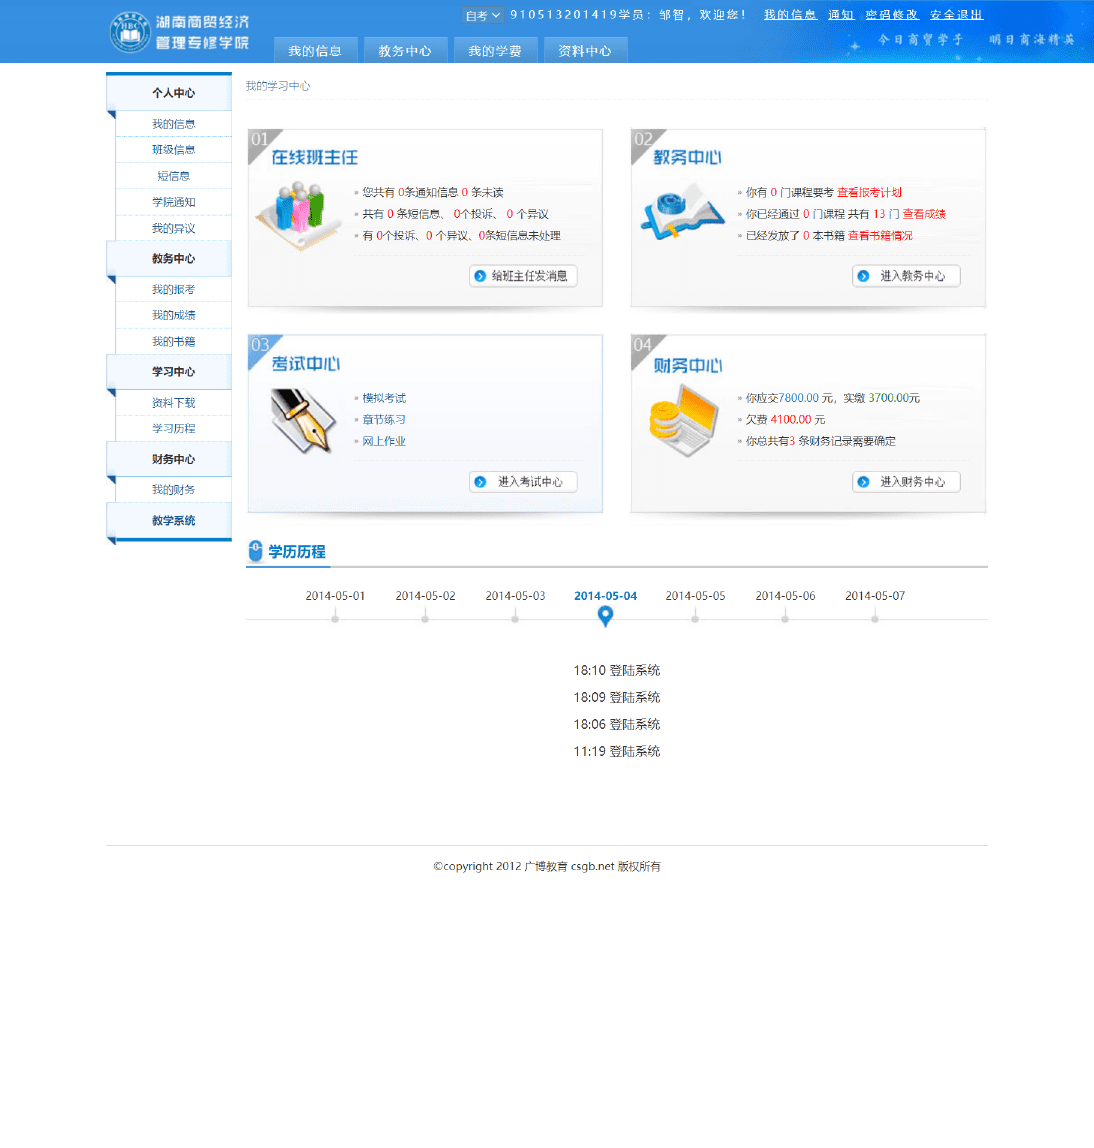
【学生毕业设计】基于web学生信息管理系统网站的设计与实现(13个页面)

随机推荐
Flutter 父子组件如何都能收到点击事件
小程序_动态设置tabBar主题皮肤
Flutter学习5-集成-打包-发布
Dephi reverse tool Dede exports function name MAP and imports it into IDA
Detailed explanation of Mysql's undo log
write the story about us
C language - vernacular to understand the original code, inverse code and complement code
虚证、实证如何鉴别?
Flutter学习2-dart学习
dedecms报错The each() function is deprecated
Feature preprocessing
Redis哨兵模式配置文件详解
关于sklearn库的安装
dedecms dream weaving tag tag does not support capital letters fix
淘宝账号如何快速提升到更高等级
判断语句_switch与case
Why did you start preparing for the soft exam just after the PMP exam?
Homework 8.4 Interprocess Communication Pipes and Signals
[cesium] element highlighting
基于Web的商城后台管理系统的设计与实现