当前位置:网站首页>(超详细二)onenet数据可视化详解,如何用截取数据流绘图
(超详细二)onenet数据可视化详解,如何用截取数据流绘图
2022-07-06 09:19:00 【麓南的风】
目录
前言
上一篇我们采用传感器接入了onenet平台,实时上传采集的数据。当我们打开设备,打开数据流看着一排排在刷新的数据,有没有什么方法更直观一些呢?比如截取数据流进行可视化处理,用数据点绘制曲线,或者用仪表的方式感受采集数据的变化?
硬件搭建
https://blog.csdn.net/qq_45998204/article/details/124686714
详见上一章
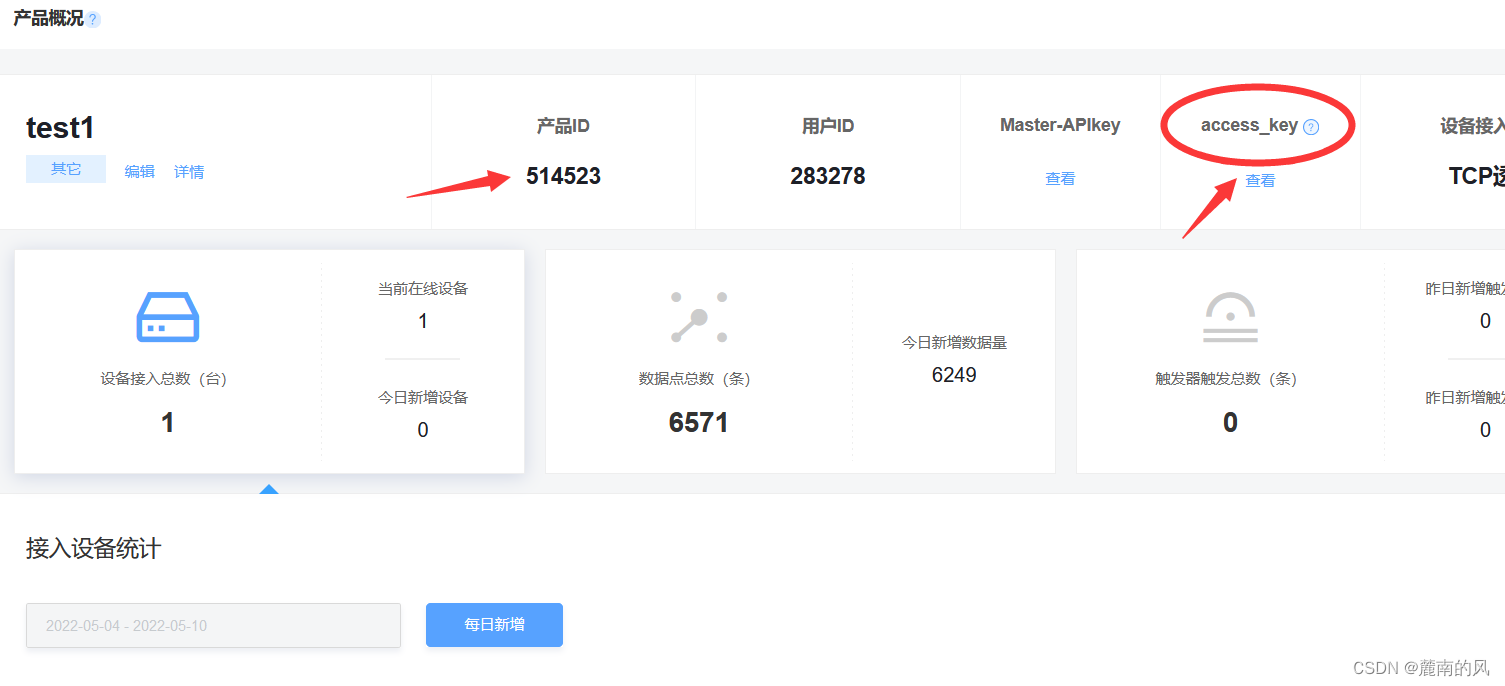
onenet平台准备
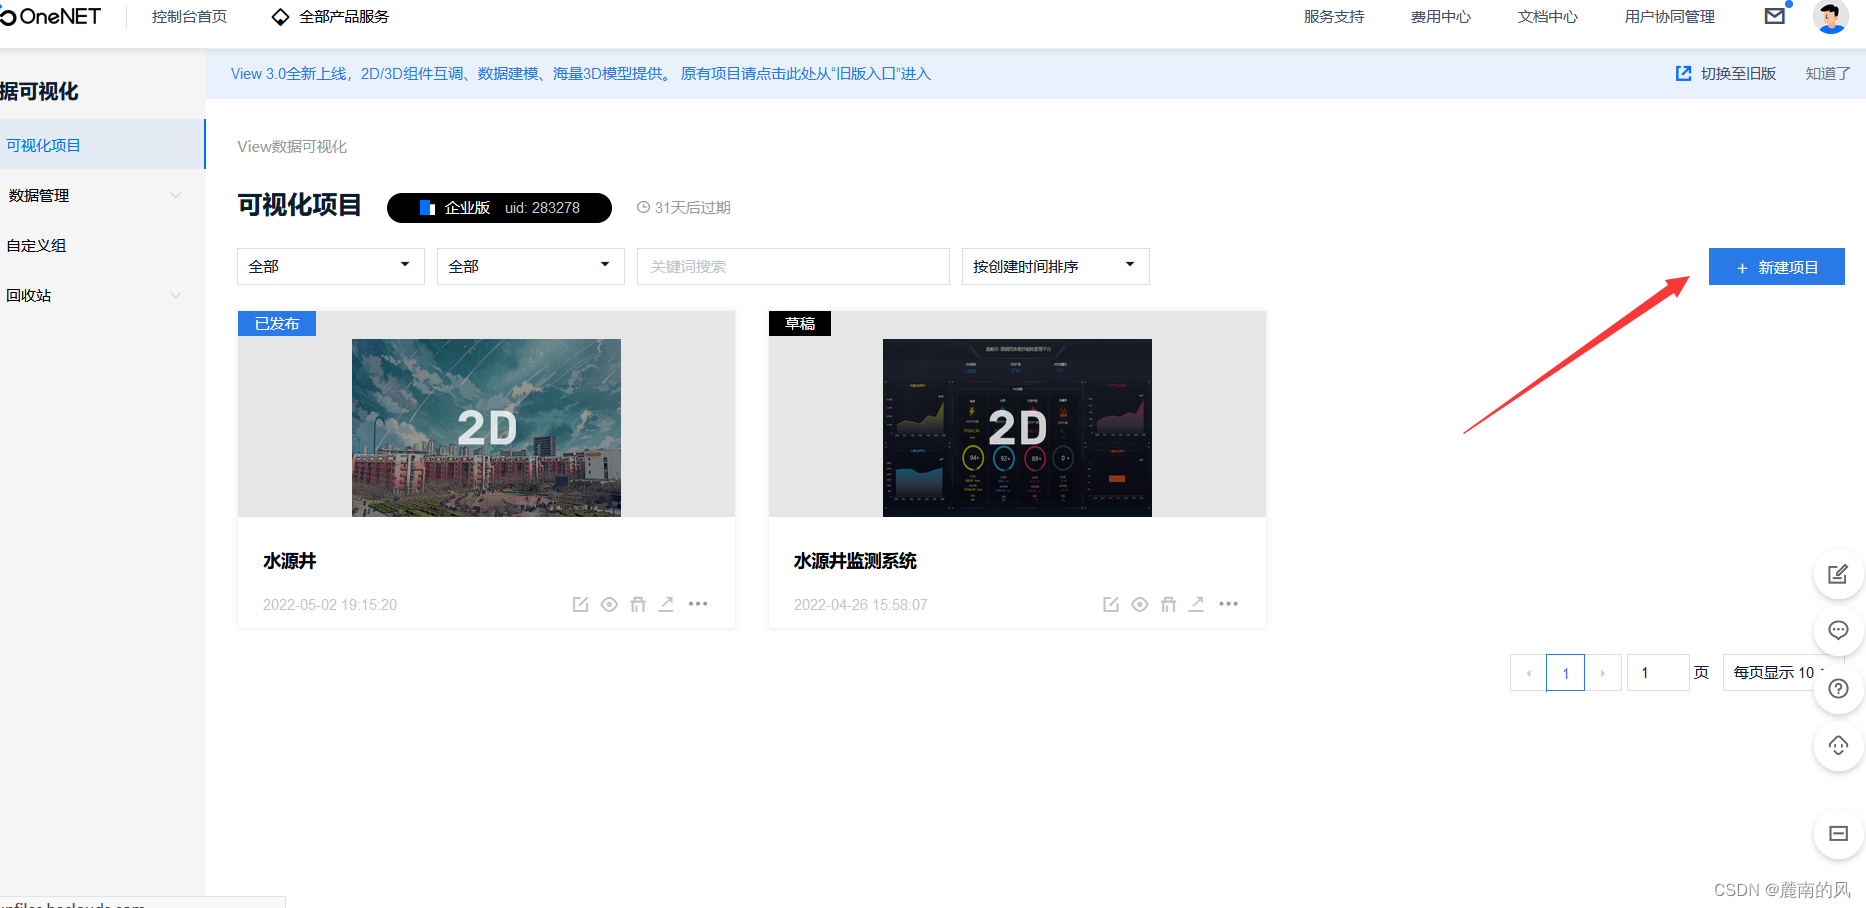
新建一个面板
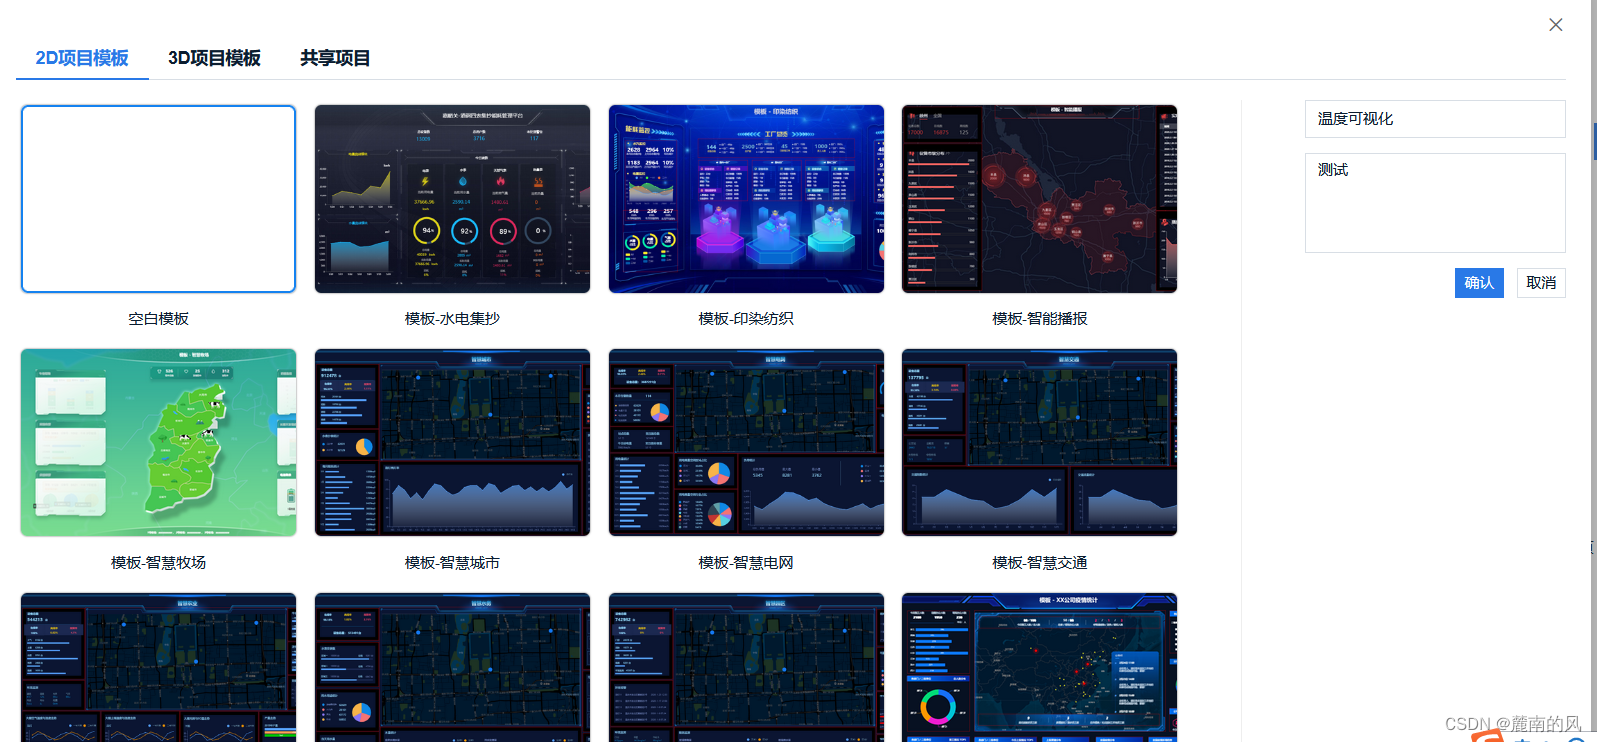
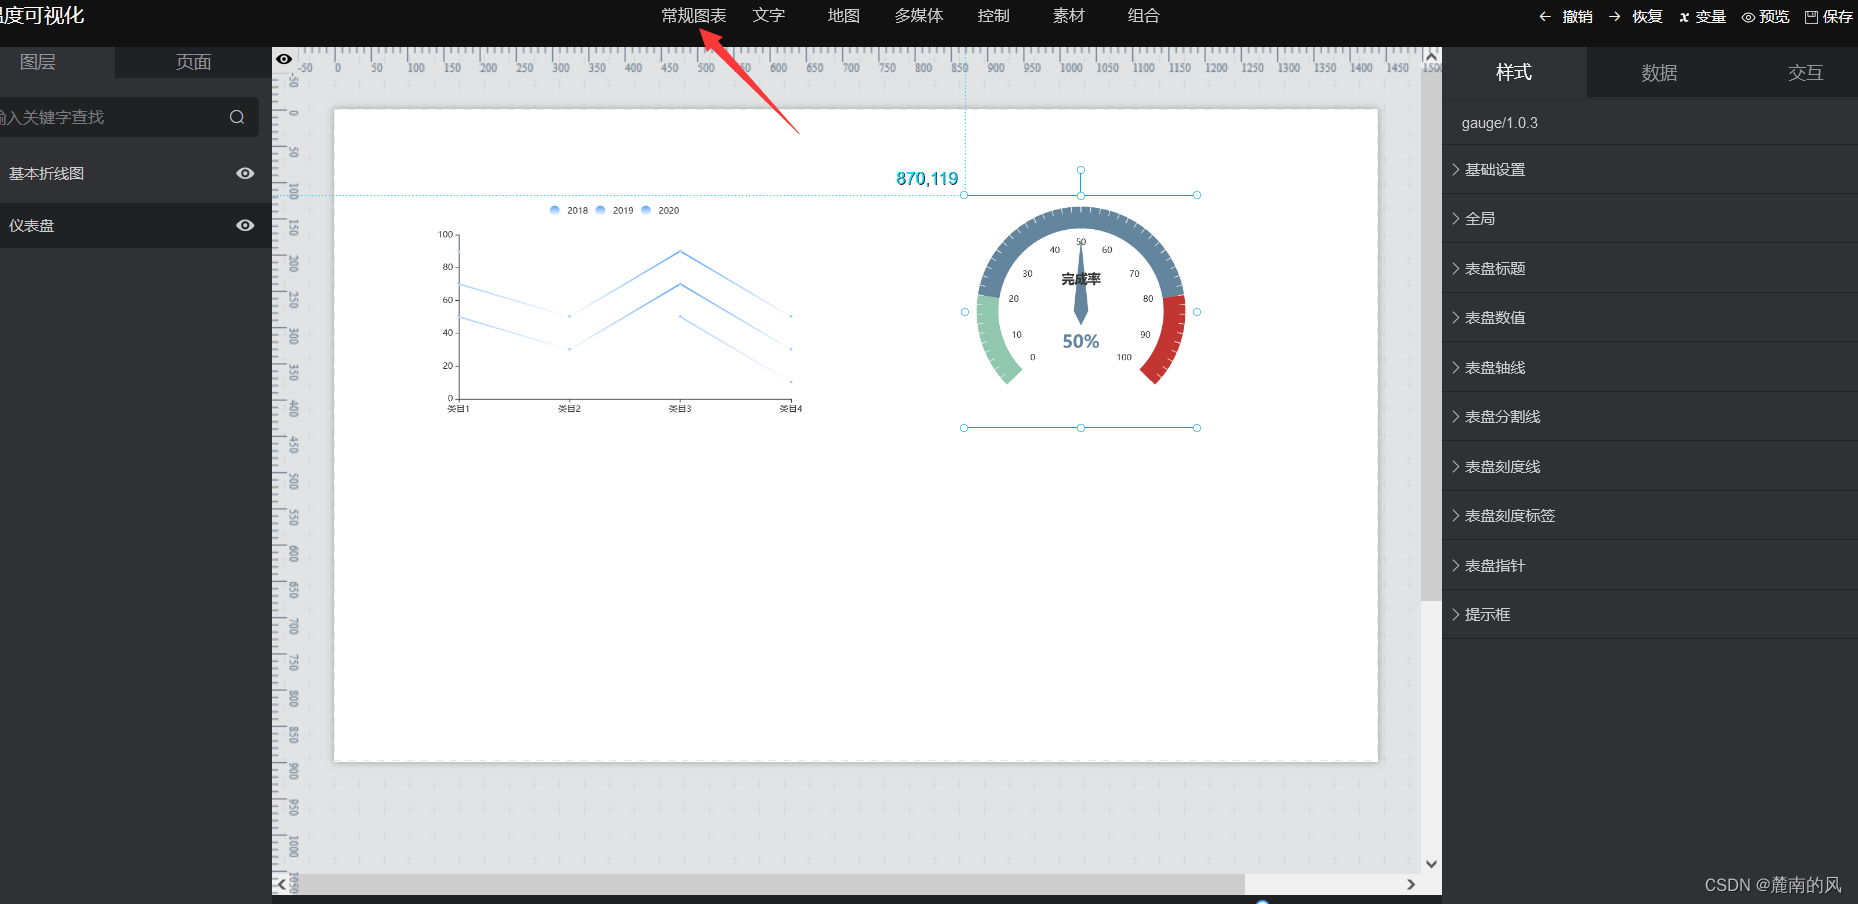
自行添加所需格式的常规图表
数据流导入
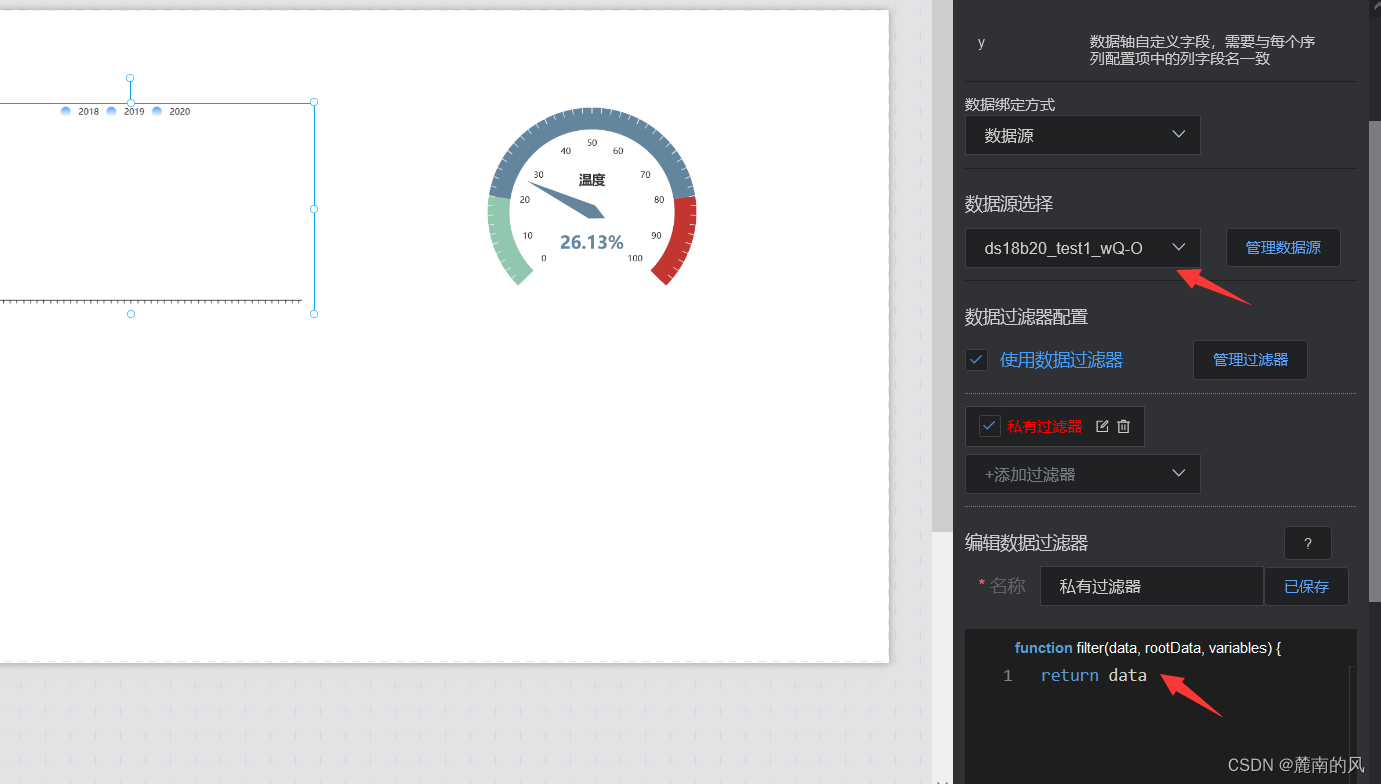
打开数据,管理数据源
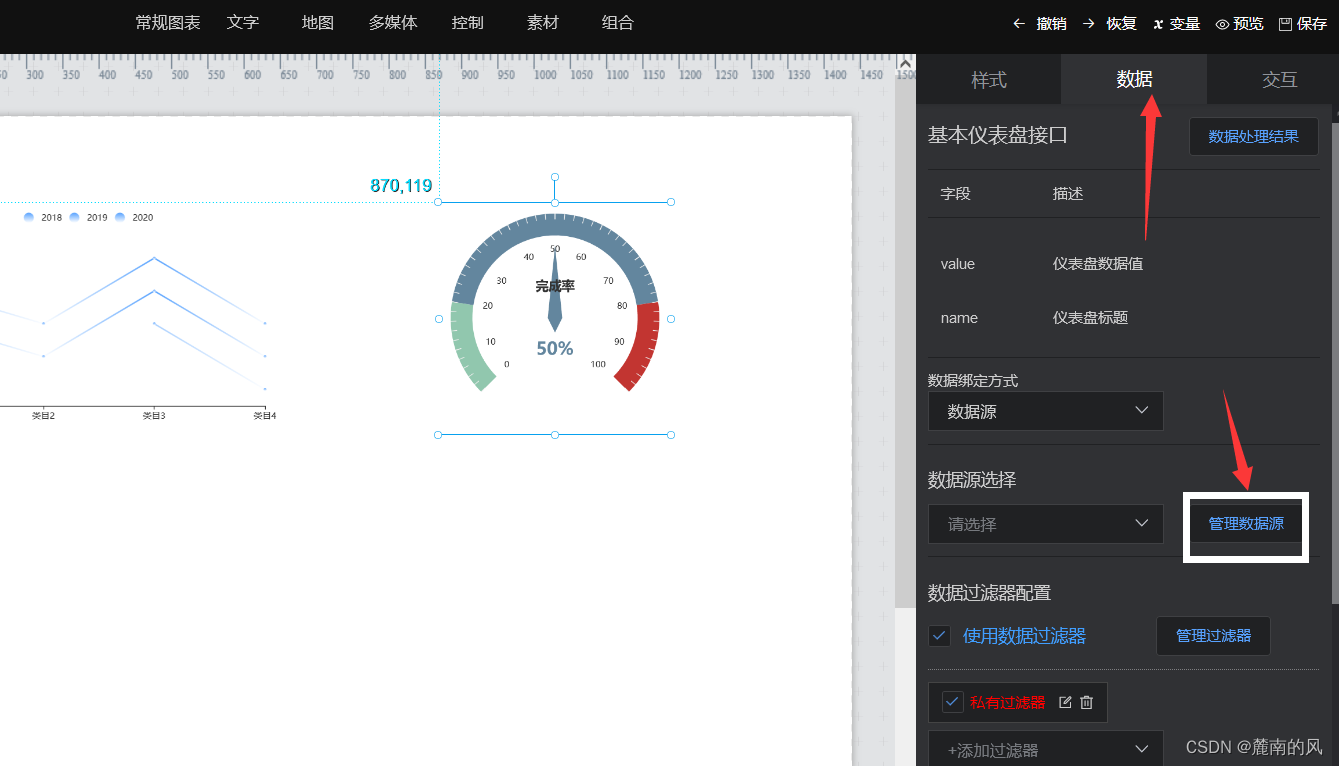
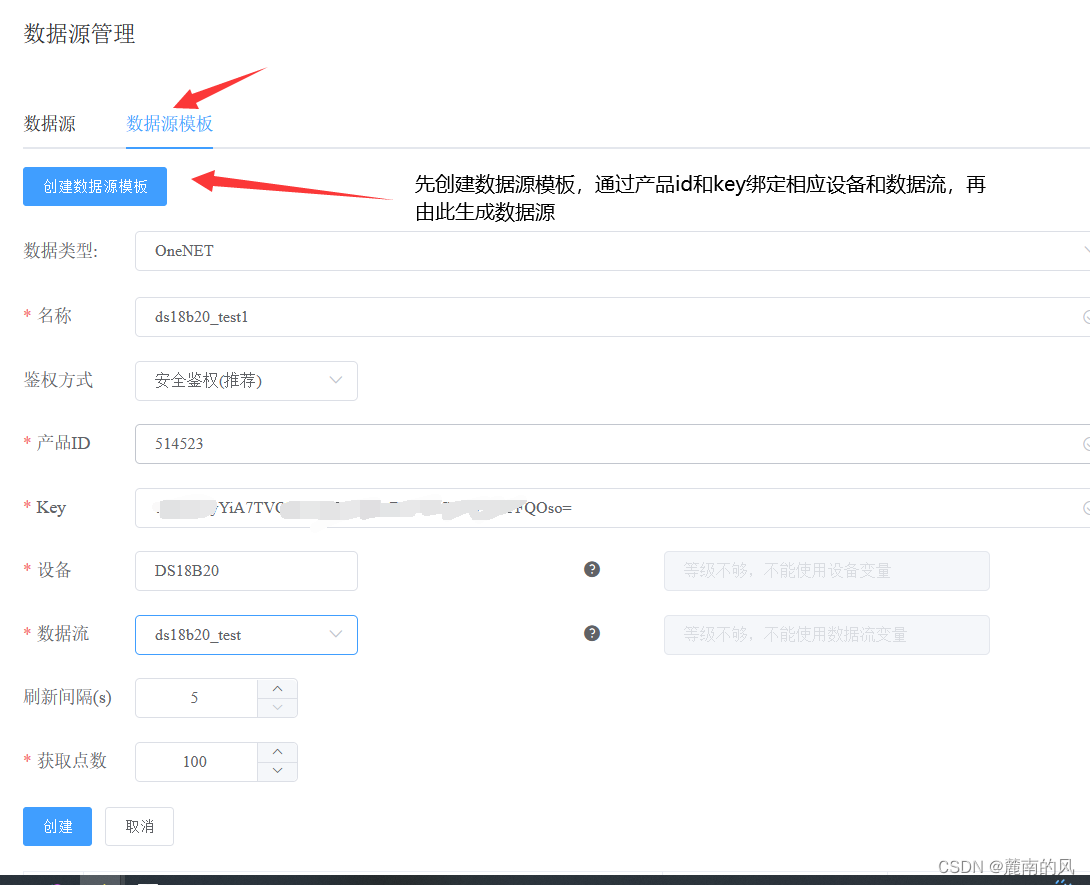
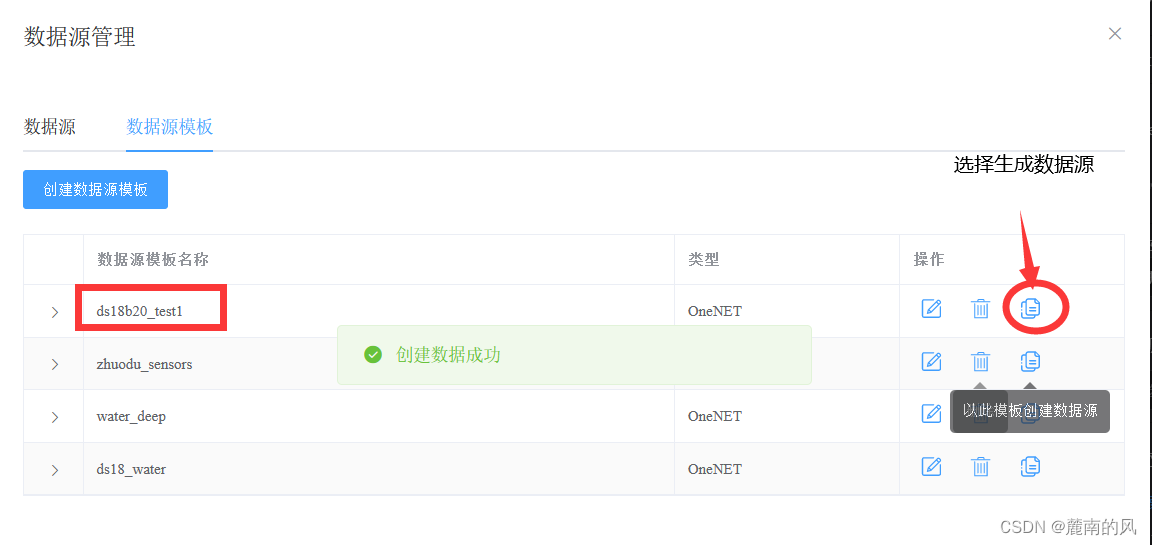
这样我们再打开数据源选择时,就能找到我们上传的数据流了
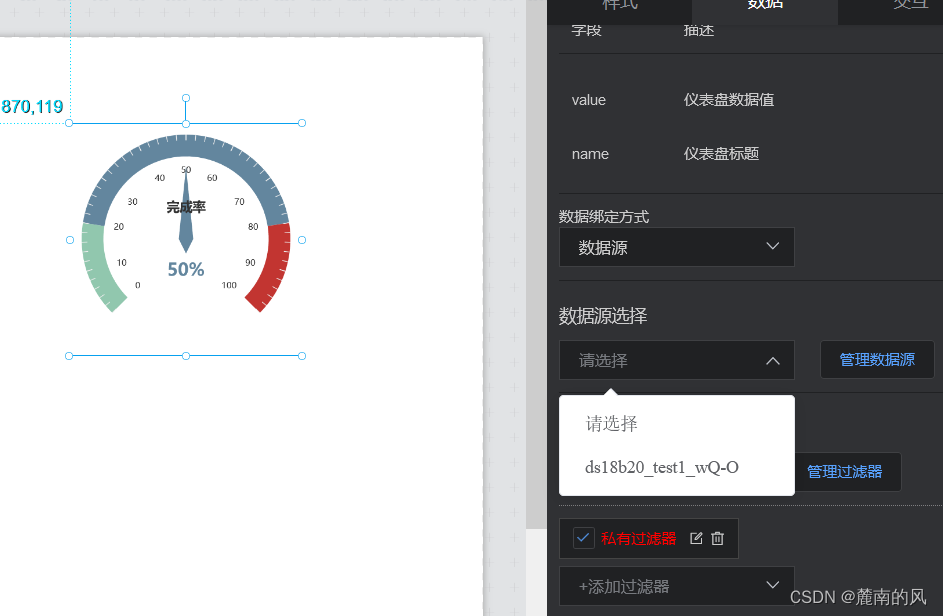
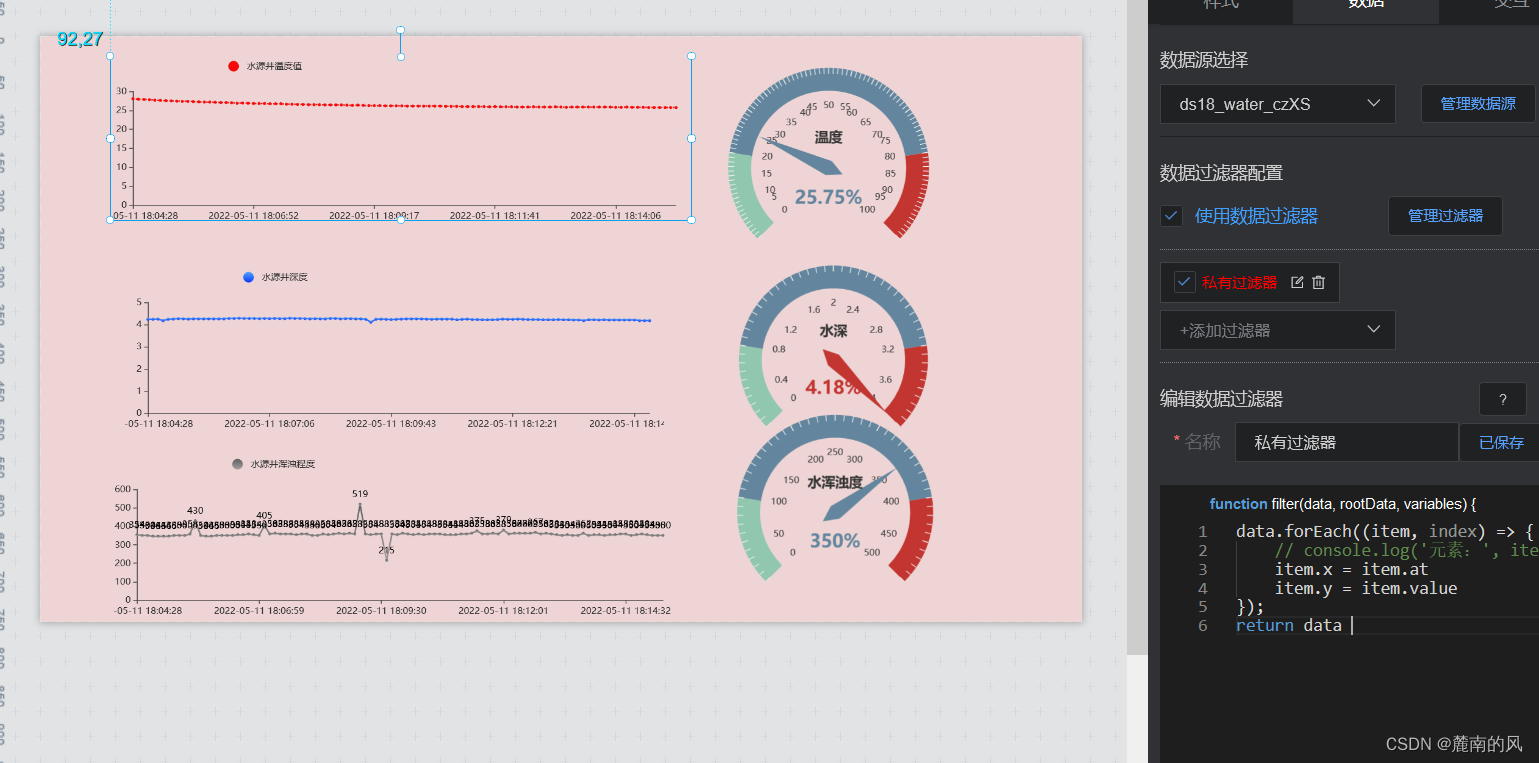
如何对仪表盘进行控制,打开私有过滤器,进行修改,看看值的变化
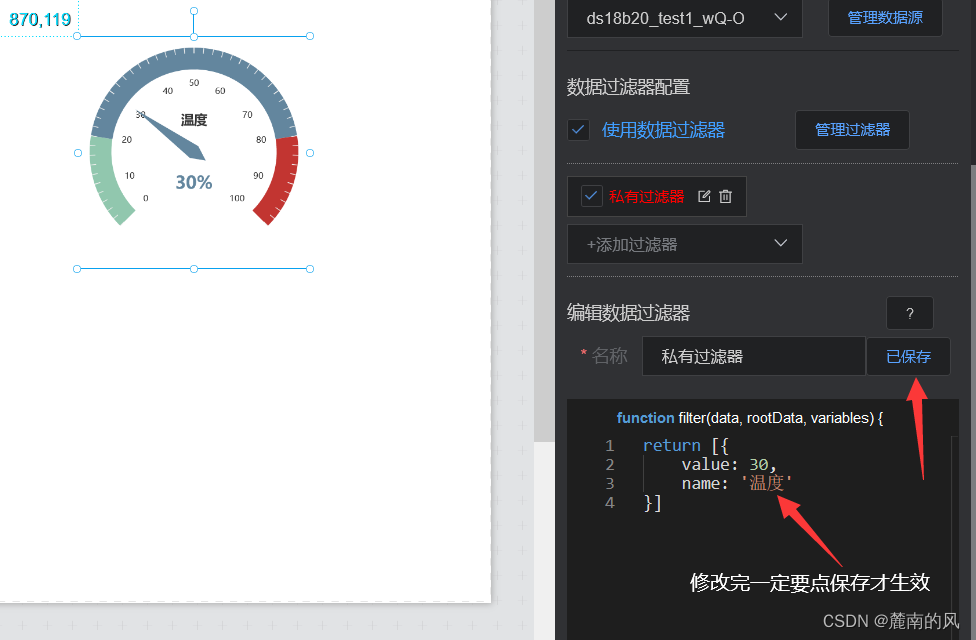
data-----选择的数据流值
rootdata----该设备下的所有数据流值
OneNET View提供了过滤器来对数据源进行个性化处理,用户可以自行写入JavaScript代码,实现数据结构转换、筛选和一些简单的计算
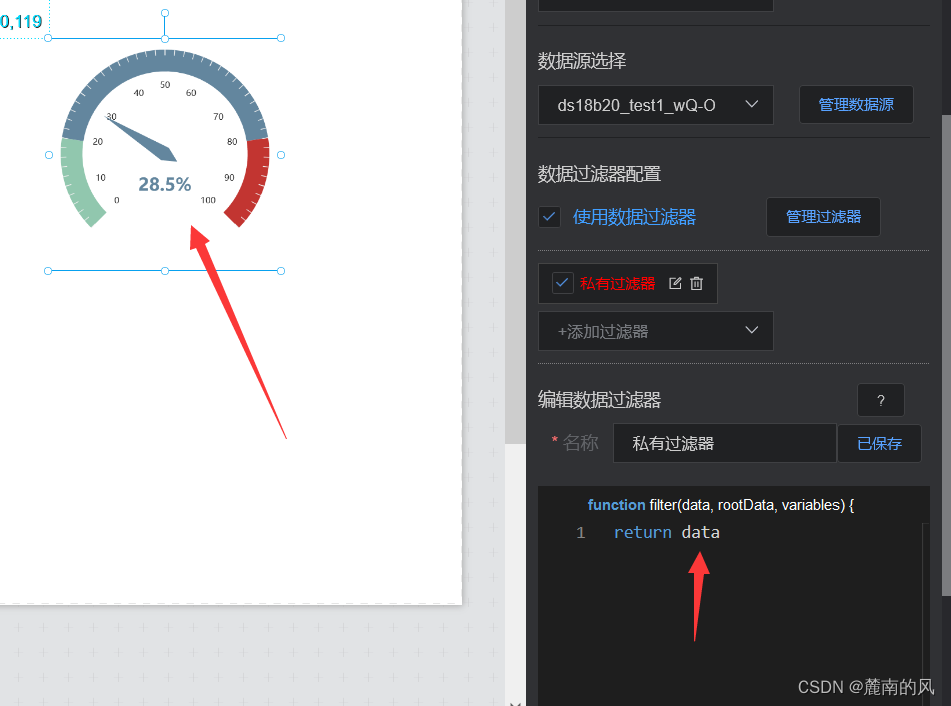
输入data,我们可以观察到,仪表板随着返回的数据流值发生了改变
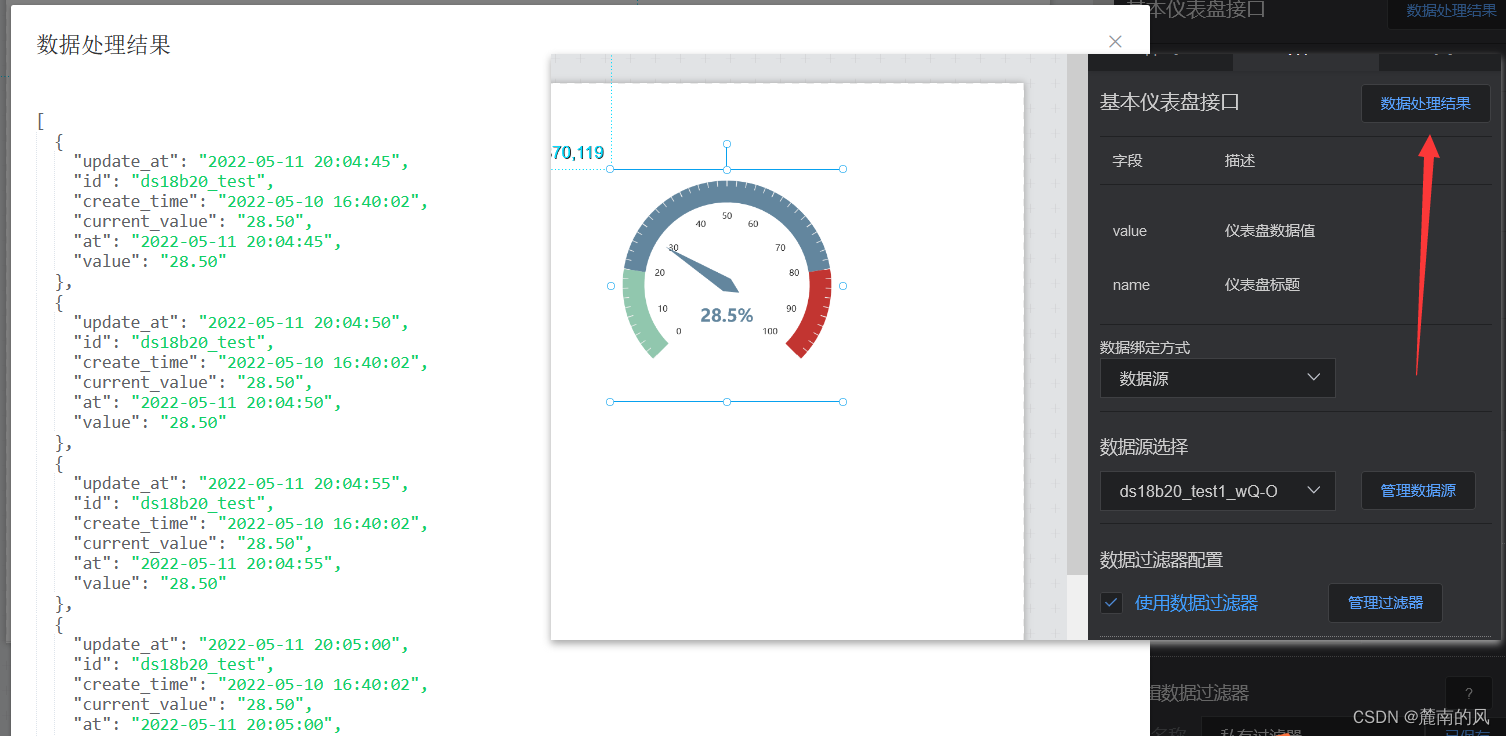
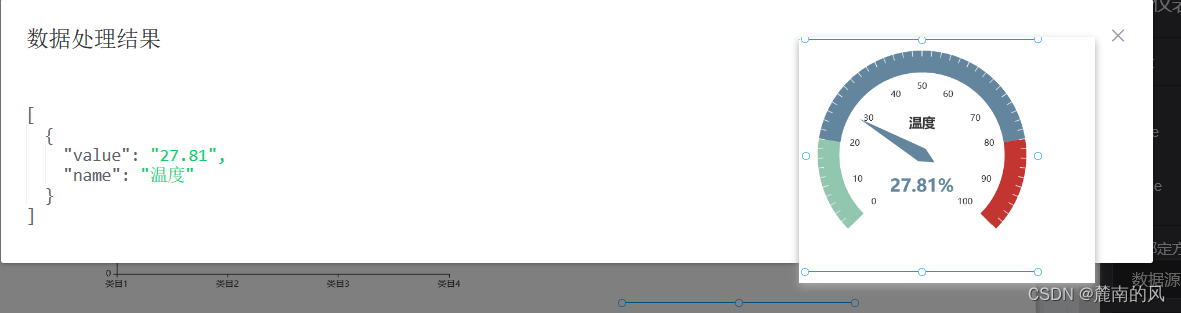
打开数据处理结果,可以直观的观察到数据流返回信息,前边我们设置了刷新间隔5秒,数据点数100,在这么多数据处理结果里面,我们需要截取最新一组数据应用仪表盘显示
接下来就是如何截取我们所需的数据值来绘图
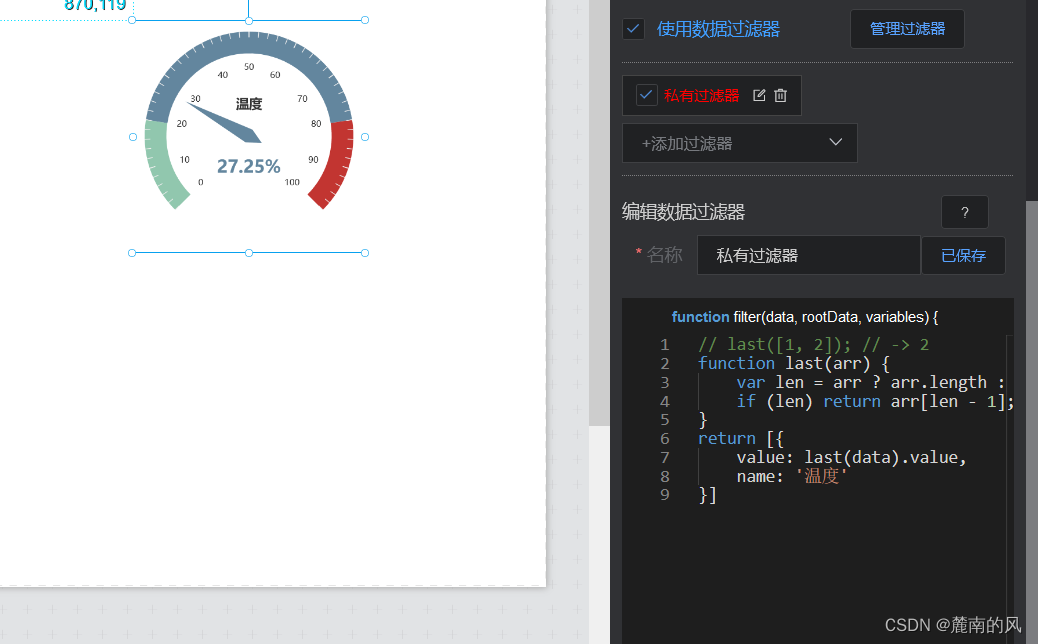
打开私有过滤器,进行修改,让它返回最后一组数据
调用函数 last(arr)
将last(data)赋给value
打开数据处理结果,最新一组数据显示一致
仪表盘程序段(获取上传最后一组数据)
// last([1, 2]); // -> 2
function last(arr) {
    var len = arr ? arr.length : 0;
    if (len) return arr[len - 1];
}
return [{
    value: last(data).value,
    name: '温度'
}]
修改程序后一定要保存
观察单个数据无法很好表达整体情况
于是引入曲线图
选中定义的曲线图,添加数据源后,修改私有过滤器,返回数据流data(保存!)
再打开数据处理结果,这里很多组数据,我们需要选取有用数据来帮助绘图,比如上传时间,上传的采样值(温度)
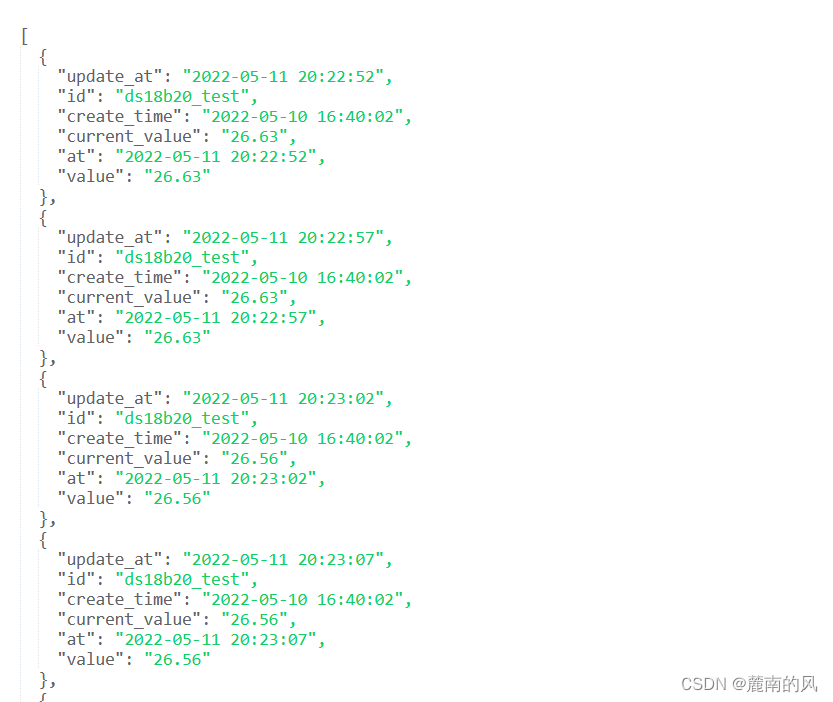
通常数据源返回的结果大多是数组类型,通过迭代可以对每个元素进行处理。
打开私有过滤器
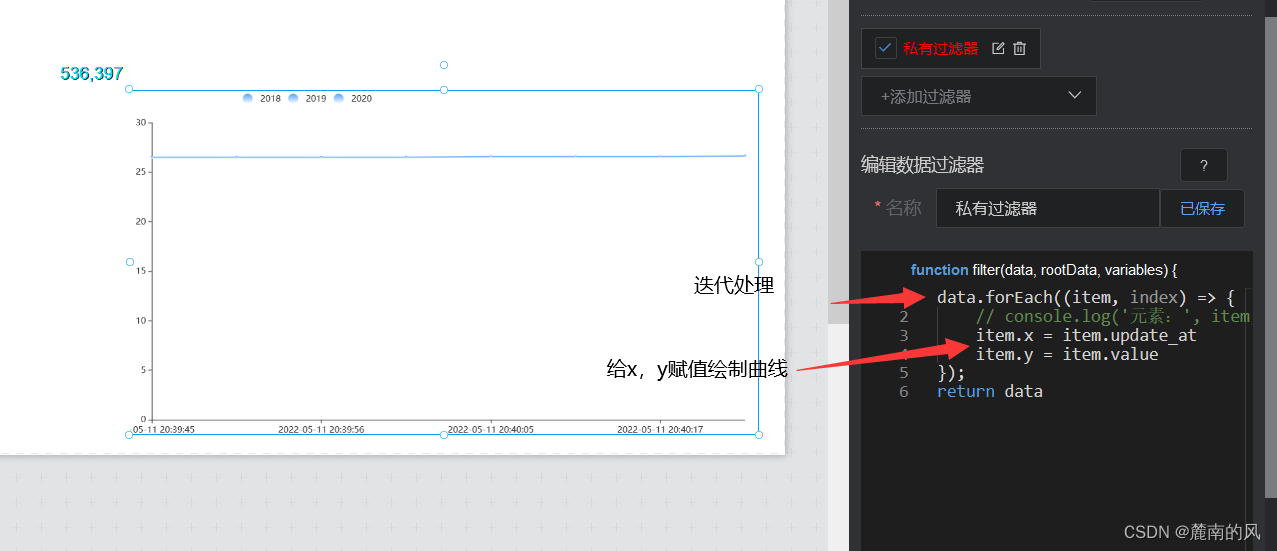
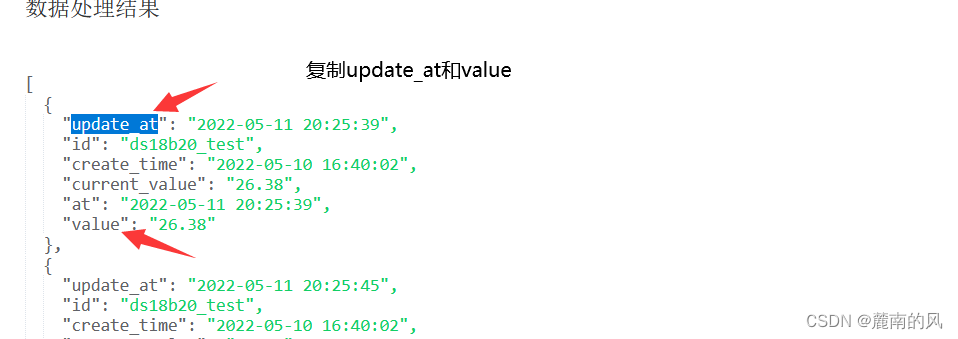
曲线代码段
data.forEach((item, index) => {
    // console.log('元素:', item, ';下标:', index);
    item.x = item.update_at
    item.y = item.value
});
return data 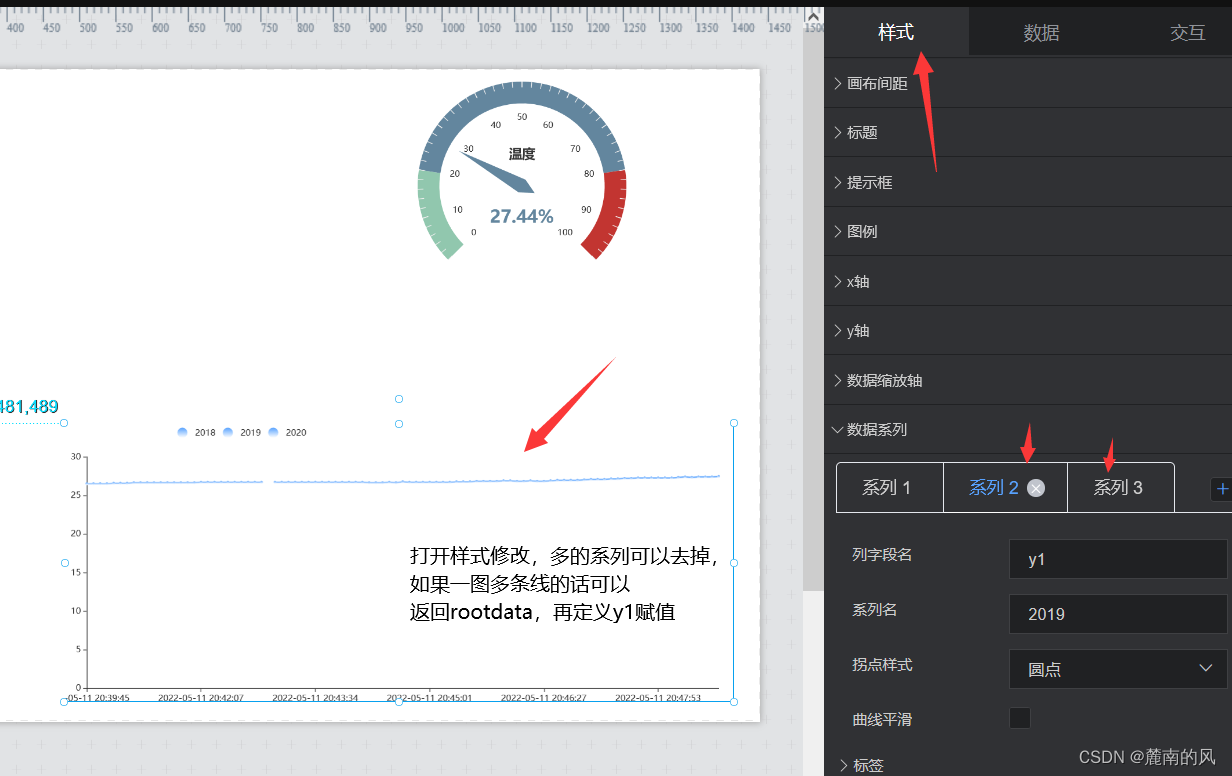
多设备多数据流上传情况同理
链接
(个人可视化图后来重做了一遍用于项目了,暂时关闭访问)
注意
看了评论发现有的人没有出图,流程没有问题,有个小细节注意一下
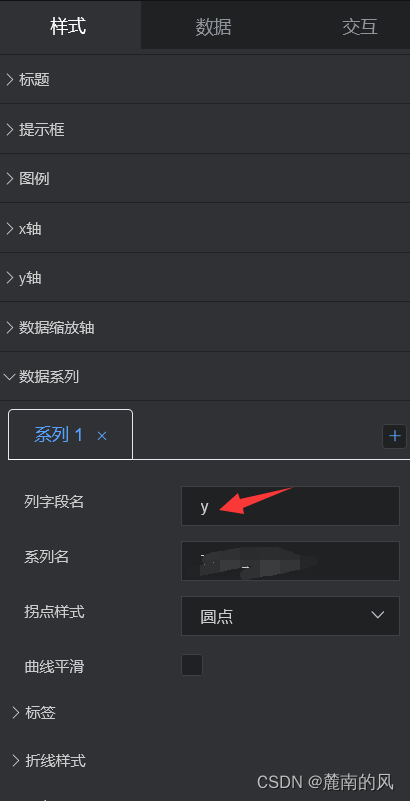
导入常规图表时这里是有三个系列,复制程序后发现只有x轴更新,是因为这里的y轴字段名是y1,而程序赋值的是y,修改此处就好了
有空再更一下rootdata的使用
欢迎交流
边栏推荐
- The earth revolves around the sun
- 阿里云一面:并发场景下的底层细节 - 伪共享问题
- Fairygui bar subfamily (scroll bar, slider, progress bar)
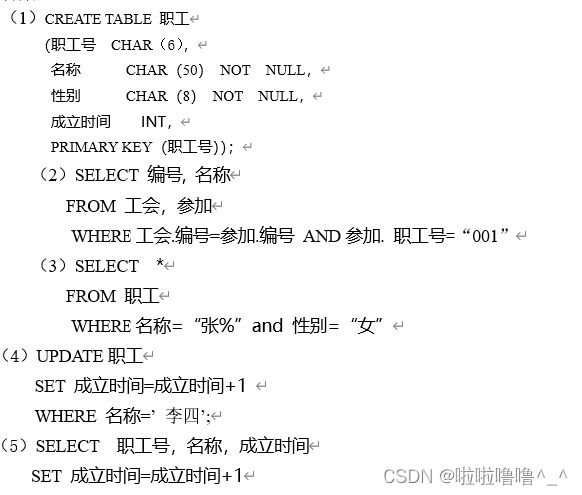
- TYUT太原理工大学2022数据库题库选择题总结
- Basic DOS commands
- Tyut outline of 2022 database examination of Taiyuan University of Technology
- System design learning (III) design Amazon's sales rank by category feature
- Several high-frequency JVM interview questions
- 《软件测试》习题答案:第一章
- [algorithm] sword finger offer2 golang interview question 3: the number of 1 in the binary form of the first n numbers
猜你喜欢
![Heap sort [handwritten small root heap]](/img/f0/6efda3c6f499a32671a935dd2f21db.png)
Heap sort [handwritten small root heap]
View UI Plus 发布 1.2.0 版本,新增 Image、Skeleton、Typography组件
Database operation of tyut Taiyuan University of technology 2022 database
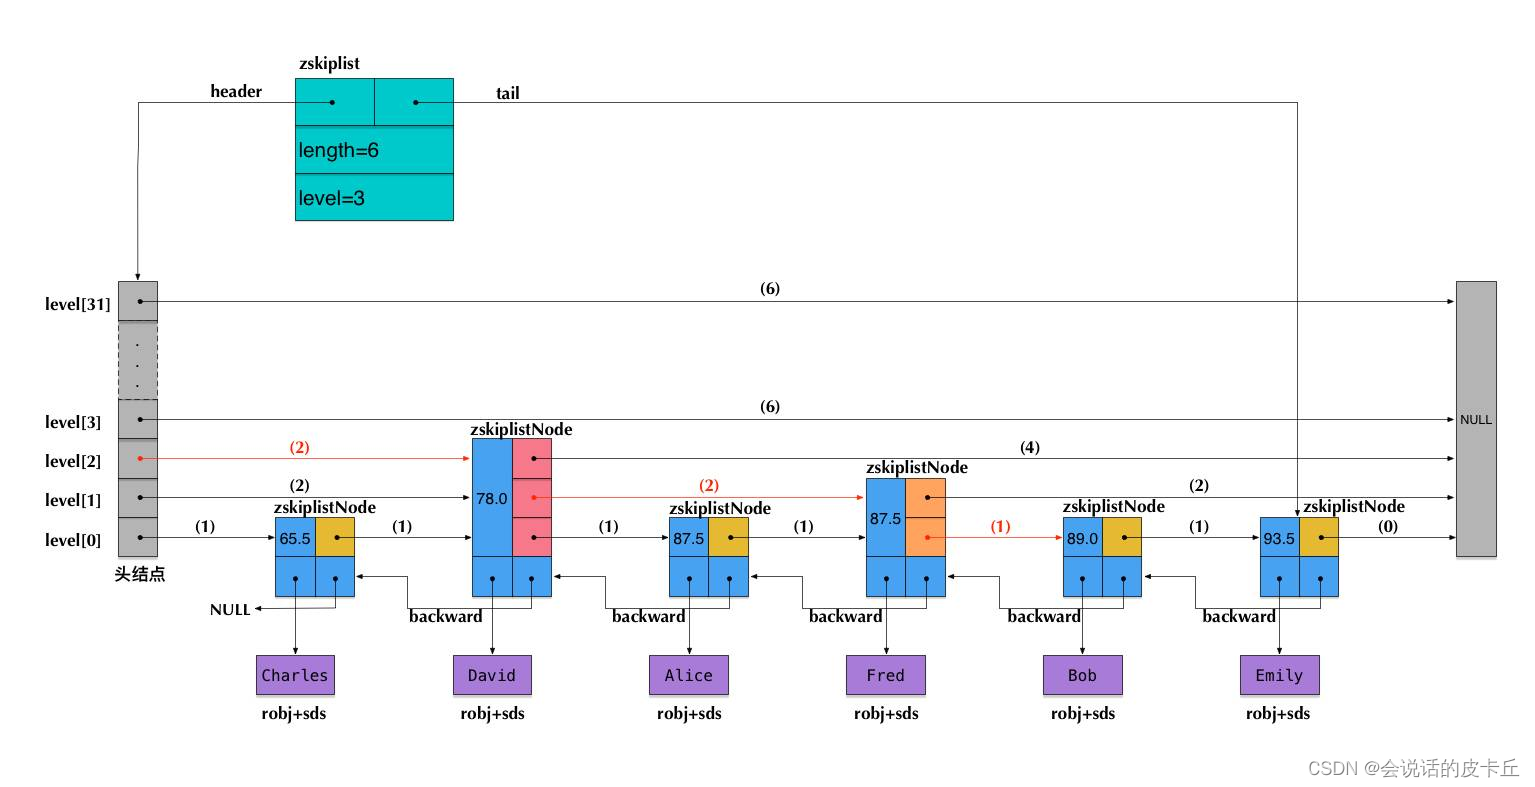
Redis介绍与使用
![[algorithm] sword finger offer2 golang interview question 2: binary addition](/img/c2/6f6c3bd4d70252ba73addad6a3a9c1.png)
[algorithm] sword finger offer2 golang interview question 2: binary addition
![[untitled]](/img/b1/9a2bebebb24132a405fc4e7d854e51.png)
[untitled]
![[algorithm] sword finger offer2 golang interview question 4: numbers that appear only once](/img/f7/23ffc81ec8e9161c15d863c1a67916.png)
[algorithm] sword finger offer2 golang interview question 4: numbers that appear only once
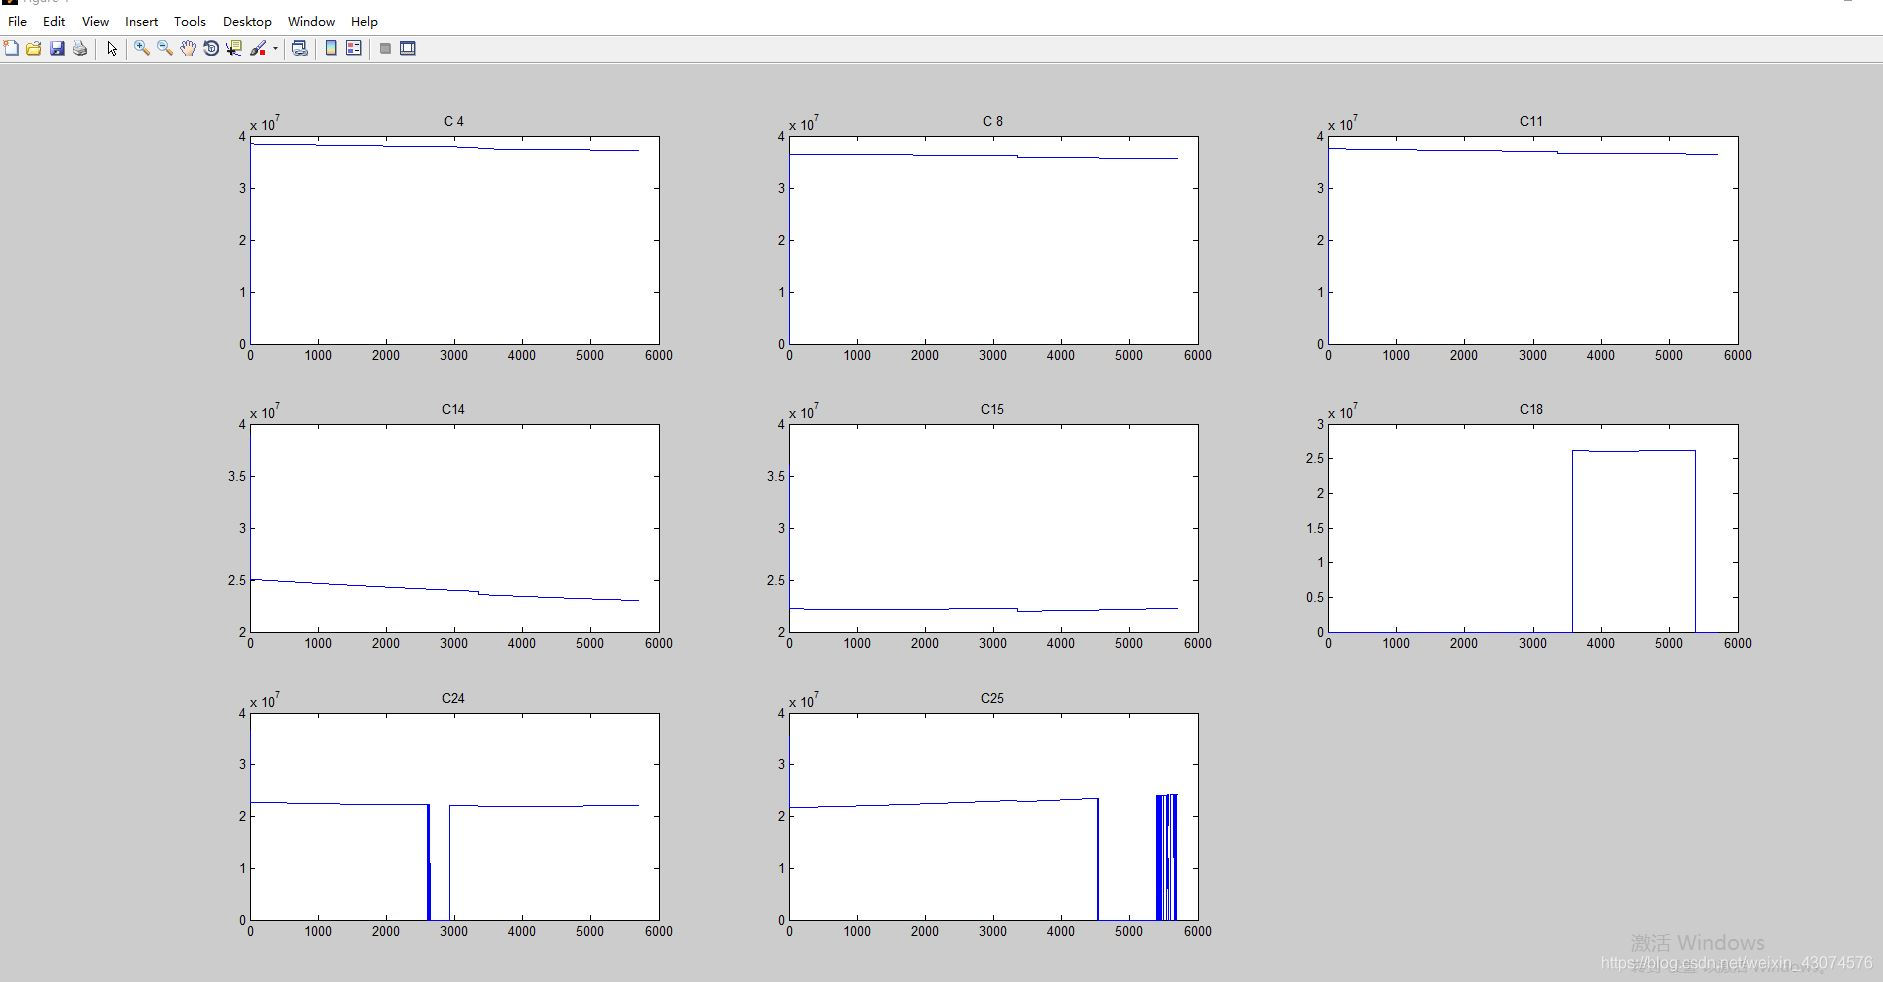
Code example of MATLAB reading GNSS observation value o file
![Fundamentals of UD decomposition of KF UD decomposition [1]](/img/e9/564e0163c3756c0ba886913f1cfaef.jpg)
Fundamentals of UD decomposition of KF UD decomposition [1]
一文搞定 UDP 和 TCP 高频面试题!
随机推荐
[GNSS data processing] Helmert variance component estimation analysis and code implementation
Branch and loop statements
Employment of cashier [differential constraint]
10 minutes pour maîtriser complètement la rupture du cache, la pénétration du cache, l'avalanche du cache
[untitled]
One article to get UDP and TCP high-frequency interview questions!
阿里云微服务(一)服务注册中心Nacos以及REST Template和Feign Client
First acquaintance with C language (Part 2)
Rt-ppp test using rtknavi
Inheritance and polymorphism (Part 2)
面试必备:聊聊分布式锁的多种实现!
Interview Essentials: talk about the various implementations of distributed locks!
Alibaba cloud microservices (I) service registry Nacos, rest template and feign client
【快趁你舍友打游戏,来看道题吧】
TYUT太原理工大学2022软工导论简答题
MySQL 30000 word essence summary + 100 interview questions, hanging the interviewer is more than enough (Collection Series
Code example of MATLAB reading GNSS observation value o file
First acquaintance with C language (Part 1)
Alibaba cloud side: underlying details in concurrent scenarios - pseudo sharing
Sharing ideas of on-chip transplantation based on rtklib source code