当前位置:网站首页>MATLAB中deg2rad和rad2deg函数的使用
MATLAB中deg2rad和rad2deg函数的使用
2022-07-06 11:21:00 【jk_101】
目录
deg2rad函数的功能是将角从以度为单位转换为以弧度为单位。
rad2deg函数的功能是将角的单位从弧度转换为度。
语法
R = deg2rad(D)
D = rad2deg(R)
说明
对于 D 的每个元素,R = deg2rad(D) 将角的单位从度转换为弧度。
D = rad2deg(R) 将 R 中每个元素的角单位从弧度转换为度。
示例
以弧度为单位的直角
将 90 度角转换为以弧度为单位。
R = deg2rad(90)
R = 1.5708
曲面距离
以度为单位指定慕尼黑和班加罗尔之间的球面距离和地球的平均半径(以千米为单位)。计算慕尼黑和班加罗尔之间的距离(沿地球曲面度量,以千米为单位)。
D = 64.7;
radEarth = 6371;
R = deg2rad(D);
dist = radEarth*R


dist = 7.1943e+03
pi 以度为单位
将 pi 转换为以度为单位。
D = rad2deg(pi)
D = 180
球面距离
指定地球的平均半径和沿着地球表面测量的从慕尼黑到班加罗尔的距离(以千米为单位)。以度为单位计算慕尼黑和班加罗尔之间的球面距离。
dist = 7194;
radEarth = 6371;
R = dist/radEarth;
D = rad2deg(R)


D = 64.6972
输入参数说明
D - 以度为单位的角
以度为单位的角,指定为标量、向量、矩阵或多维数组。如果 D 包含复数元素,则 deg2rad 将分别转换实部和虚部。
数据类型: single | double
复数支持: 是
R - 以弧度为单位的角
以弧度为单位的角,指定为标量、向量、矩阵或多维数组。如果 R 包含复数元素,则 rad2deg 将分别转换实部和虚部。
数据类型: single | double
复数支持: 是
输出参数说明
R - 以弧度为单位的角
以弧度为单位的角,以标量、向量、矩阵或多维数组形式返回。R 的大小与 D 相同。
D - 以度为单位的角
以度为单位的角,以标量、向量、矩阵或多维数组形式返回。D 的大小与 R 的大小相同。
边栏推荐
- R语言ggplot2可视化:使用ggpubr包的ggstripchart函数可视化分组点状条带图(dot strip plot)、设置add参数为不同水平点状条带图添加箱图
- Actf 2022 came to a successful conclusion, and 0ops team won the second consecutive championship!!
- Mathematics in machine learning -- common probability distribution (XIII): Logistic Distribution
- Intelligent supply chain management system solution for hardware and electromechanical industry: digital intelligent supply chain "creates new blood" for traditional industries
- Xingnuochi technology's IPO was terminated: it was planned to raise 350million yuan, with an annual revenue of 367million yuan
- pychrm社区版调用matplotlib.pyplot.imshow()函数图像不弹出的解决方法
- 上海部分招工市场对新冠阳性康复者拒绝招录
- GCC【7】- 编译检查的是函数的声明,链接检查的是函数的定义bug
- AIRIOT物联网平台赋能集装箱行业构建【焊接工位信息监控系统】
- Pychrm Community Edition calls matplotlib pyplot. Solution of imshow() function image not popping up
猜你喜欢
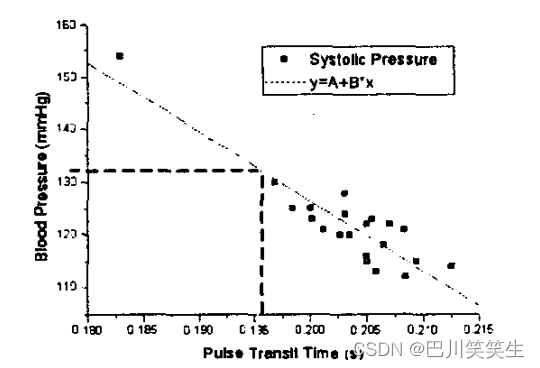
用于远程医疗的无创、无袖带血压测量【翻译】
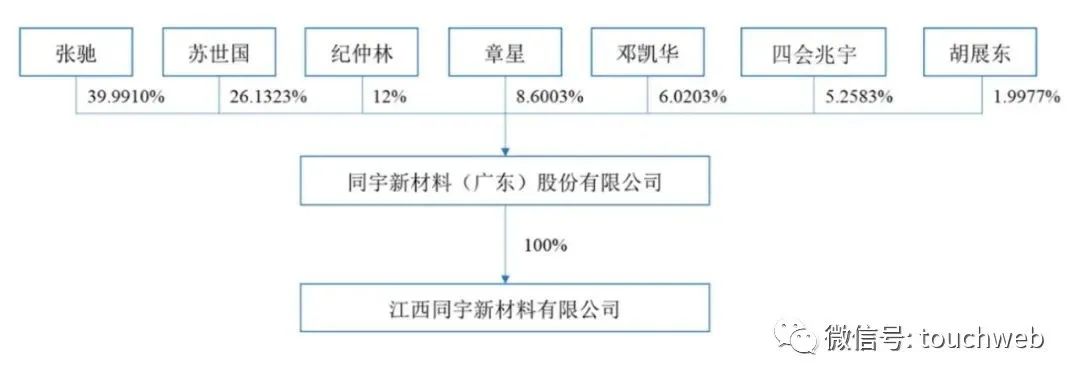
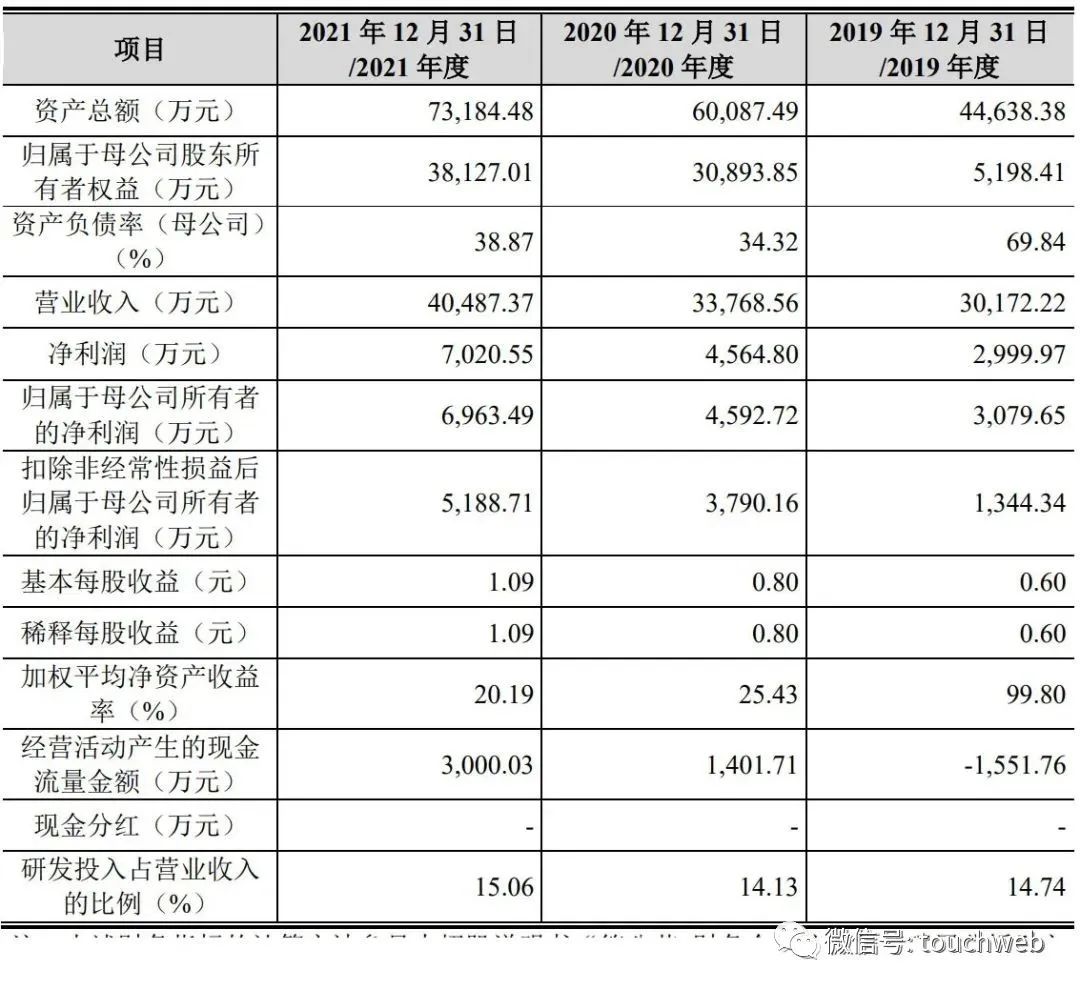
Tongyu Xincai rushes to Shenzhen Stock Exchange: the annual revenue is 947million Zhang Chi and Su Shiguo are the actual controllers

基于蝴蝶种类识别
朗坤智慧冲刺科创板:年营收4亿 拟募资7亿

Synchronous development of business and application: strategic suggestions for application modernization
![[depth first search] Ji suanke: Square](/img/fc/e42ae0d036be258bed5623d55fc2db.jpg)
[depth first search] Ji suanke: Square
![Deep circulation network long-term blood pressure prediction [translation]](/img/9c/c1ed28242a4536c1e8fde3414f82a8.png)
Deep circulation network long-term blood pressure prediction [translation]

How are you in the first half of the year occupied by the epidemic| Mid 2022 summary

五金机电行业供应商智慧管理平台解决方案:优化供应链管理,带动企业业绩增长

五金机电行业智能供应链管理系统解决方案:数智化供应链为传统产业“造新血”
随机推荐
Graffiti intelligence is listed on the dual main board in Hong Kong: market value of 11.2 billion Hong Kong, with an annual revenue of 300 million US dollars
三面蚂蚁金服成功拿到offer,Android开发社招面试经验
test about BinaryTree
如何提高网站权重
[depth first search] Ji suanke: find numbers
Helm deploy etcd cluster
Xingnuochi technology's IPO was terminated: it was planned to raise 350million yuan, with an annual revenue of 367million yuan
史上超级详细,想找工作的你还不看这份资料就晚了
Airiot IOT platform enables the container industry to build [welding station information monitoring system]
基于ppg和fft神经网络的光学血压估计【翻译】
Actf 2022 came to a successful conclusion, and 0ops team won the second consecutive championship!!
AutoCAD - what is the default lineweight for centerline drawing and CAD? Can I modify it?
Binary search tree
Intelligent supply chain management system solution for hardware and electromechanical industry: digital intelligent supply chain "creates new blood" for traditional industries
Camel case with Hungarian notation
Interview assault 63: how to remove duplication in MySQL?
能源行业的数字化“新”运维
openmv4 学习笔记1----一键下载、图像处理背景知识、LAB亮度-对比度
ROS custom message publishing subscription example
驼峰式与下划线命名规则(Camel case With hungarian notation)