当前位置:网站首页>Matplotlib plotting notes
Matplotlib plotting notes
2022-08-05 06:45:00 【ProfSnail】
使用Python中的Matplotlib绘图,There are some functions that are not fully remembered,Every time you have to go online to find the corresponding code usage,Take this article as a note,记录常用、Uncommon usage.
官方文档地址:https://matplotlib.org/stable/api/axes_api.html
坐标轴
Axis label density
MultipleLocator(1)表示间距为1.
from matplotlib import ticker
ax.xaxis.set_major_locator(ticker.MultipleLocator(1))
ax.yaxis.set_major_locator(ticker.MultipleLocator(1))
不显示坐标轴
All borders will be hidden at once.
plt.axis('off')
The scale of the horizontal and vertical axes
Let the ratio of the horizontal and vertical axes be 1:1.
plt.gca().set_aspect(1)
坐标轴范围
It is used in the normal single-image situationplt.xlim(xmin,xmax).Use in multi-image situationsax.set(xlim=(xmin, xmax),ylim=(ymin,ymax)).
# Generally used for single image
plt.xlim(xmin, xmax)
plt.ylim(ymin, ymax)
# Multi-map case
ax.set(xlim=(xmin, xmax), ylim=(ymin, ymax))
# or single image use
plt.gca().set(xlim=(xmin, xmax), ylim=(ymin, ymax))
子图
生成子图
生成子图,plt.subplots(行数,列数),返回的axesis a two-dimensional index structure.
fig, axes = plt.subplots(nrows=2, ncols=2)
Flatten a two-dimensional index structure into a one-dimensional index structure,axes.flatten()
for i, ax in enumerate(axes.flatten()):
	ax.plot(x, y)
子图标题
使用ax.set_title(‘title’)The name of the marker subgraph,此时,The title is usually at the top of the figure.
ax.set_title('title')
To make the title at the bottom of the figure,使用y=-0.2,Defines the position of the title.
ax.set_title('title', y=-0.2)
fontsize=15,调整字体大小.
ax.set_title('title', y=-0.2, fontsize=15)
子图间距
通过plt.subplots_adjust进行调整,参数里面的top, left, right, rightIt corresponds to the bottom left corner of the image as the origin,The position ratio of the top, bottom, left, and right corners,取值为0-1.wspace和hspaceControls the vertical and horizontal spacing between subplots.
plt.subplots_adjust(left, bottom, right, top, wspace, hspace)
Sets the display range of the subplot axes
如果使用plt.xlim(xmin, xmax)的方式,在迭代过程中,This range limit only applies to the last subgraph,The correct way is to use for each subplotax.set(xlim=(xmin,xmax))的方法.
参见:https://matplotlib.org/stable/api/_as_gen/matplotlib.axes.Axes.axis.html
fig, axes = plt.subplots(2, 3)
for i, ax in enumerate(axes.flatten()):
	ax.set(xlim=(xmin, xmax), ylim=(ymin,ymax))
绘制
绘制箭头
由xytextthe coordinates point toxy的坐标.
    plt.gca().annotate("", xy=(0, 2.5), xytext=(0, -1.2),
            arrowprops=dict(arrowstyle="->"))
Write text on the image
使用$$之后,与LaTeX的使用方法一样.
plt.text(x=1, y=2, s=r'$\hat{\beta}$')
边栏推荐
猜你喜欢


随机推荐
document.querySelector()方法
Complete mysql offline installation in 5 minutes
The method of using ROS1 bag under ROS2
The 25 best free games on mobile in 2020
NACOS配置中心设置配置文件
Passing parameters in multiple threads
白鹭egret添加新页面教程,如何添加新页面
ES2020新特性
Email management Filter emails
DevOps process demo (practical record)
scikit-image图像处理笔记
D39_Eulerian Angles and Quaternions
Does flink cdc currently support Gauss database sources?
淘宝客APP带自营商城本地生活CPS外卖优惠电影票话费更新渠道跟单生活特权V3
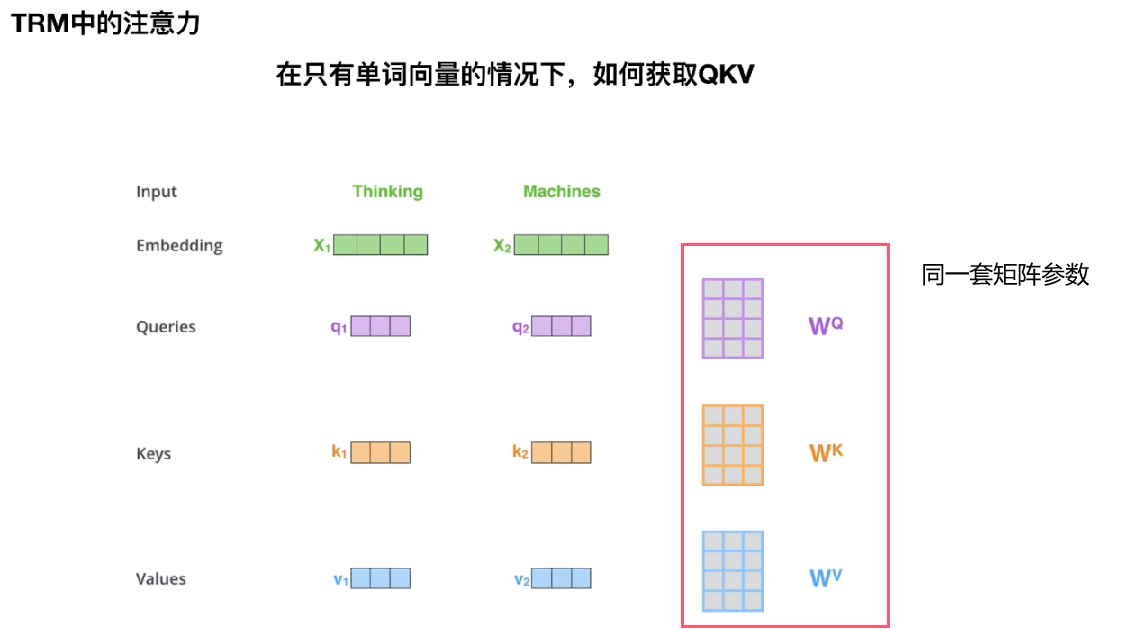
Transformer详细解读与预测实例记录
Late night drinking, 50 classic SQL questions, really fragrant~
H5 的浏览器存储
初识网页与浏览器
摆脱极域软件的限制
获取预训练模型的网络输入尺寸