当前位置:网站首页>svm.SVC application practice 1--Breast cancer detection
svm.SVC application practice 1--Breast cancer detection
2022-08-02 02:45:00 【Take the bamboo shoots 123】
这里写目录标题
Decision boundary drawing function wrapper
参考书籍:《scikit-learn机器学习:常用算法原理及编程实战》
参考博客:Support vector machine-based data classification and drawing decision boundaries(超平面)
代码
import matplotlib.pyplot as plt
import numpy as np
def plot_hyperplane(clf, X, y,
                    h=0.02,
                    draw_sv=True,
                    title='hyperplan'):

    x_min, x_max = X[:, 0].min() - 0.1, X[:, 0].max() + 0.1
    y_min, y_max = X[:, 1].min() - 0.1, X[:, 1].max() + 0.1
    # 生成网格点坐标矩阵,其中参数h控制间距
    xx, yy = np.meshgrid(np.arange(x_min, x_max, h),
                         np.arange(y_min, y_max, h))

    plt.title(title)
    plt.xlim(xx.min(), xx.max())
    plt.ylim(yy.min(), yy.max())
    plt.xticks(())
    plt.yticks(())

    Z = clf.predict(np.c_[xx.ravel(), yy.ravel()]) # SVM的分割超平面

    Z = Z.reshape(xx.shape)
    # Fills the coordinate matrix with different colors for different classes of points
    plt.contourf(xx, yy, Z, cmap='hot', alpha=0.5)
    plt.scatter(X[:,0],X[:,1],c=y)

	# Whether to highlight support vectors
    if draw_sv:
        sv = clf.support_vectors_
        plt.scatter(sv[:, 0], sv[:, 1], c='r', marker='.',s=1)
    plt.show()
该函数基于matplotlib库中的contourf()函数,A function that draws contour lines and fills with color
预测示例
1. simple data point
import numpy as np
from sklearn.pipeline import make.pipeline
from sklearn.preprocessing import StandardScaler
from sklearn.svm import SVC
x=np.array([[-1,-1],[-2,-1],[1,1],[2,1]])
y=np.array([1,1,2,2])
clf=make_pipeline(StandardScaler(),SVC(gamma='atuo'))
clf.fit(x,y)
clf.predict([[-0.8,-1]])
>>> [1]
Here we have to pay attentionmake_pipeline()函数与StandardScaler()函数的联合使用,Often used to build pipelinespipeline,数据预处理、Model fitting, etc“一条龙”!
2. 生成数据点
Next we first generate a feature with two features、Three categories of datasets
from sklean.datasets import make_blobs
x,y=make_blobs(n_samples=100,centers=3,random_state=0,cluster_std=0.8)
Then use a linear kernel function、三阶多项式核函数、 g a m m a gamma gamma=0.5、 g a m m a gamma gamma=0.1等4个SVCmodel to fit the dataset,Observe the fitting effect separately
from sklearn.svm import SVC
clf_linear=svm.SVC(C=1.0,kernel='linear')
clf_poly=svm.SVC(C=1.0,kernel='poly',degree=3)
clf.rbf=svm.SVC(C=1.0,kernel='rbf',gamma=0.5)
clf_rbf2=svm.SVC(C=1.0,kernel='rbf',gamma=0.1)
最后将4The hyperplane fitted by the model is drawn
plt.figure(figsize=(10,10),dpi=144)
clfs=[clf_linear,clf_poly,clf_rbf,clf_rbf2]
title=['linear','poly','rbf','rbf2']
for clf,i in zip(clfs,range(len(clfs))):
    clf.fit(x,y)
    plt.subplot(2,2,i+1)
    plot_hyperplane(clf,x,y,title=title[i])
运行结果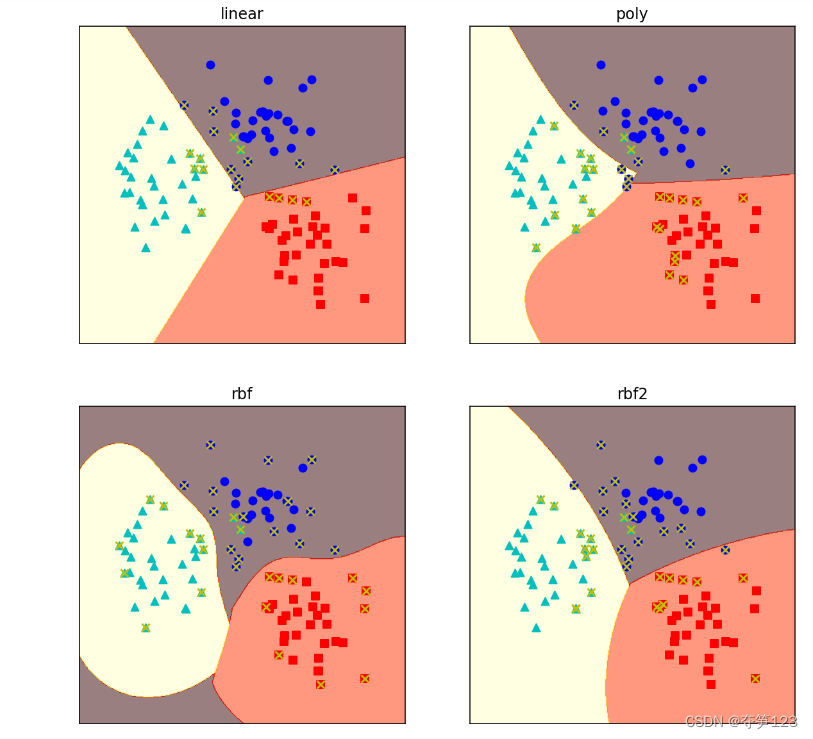 通过上面例子我们发现,When the support vector machine uses different kernel functions for classification,The drawn decision boundary also changes accordingly
对于高斯核函数,gammaToo large a value can cause overfitting,If it is too small, the Gaussian kernel function will degenerate into a linear kernel function,我们可以通过调节gammavalue to adjust the shape of the separating hyperplane
3. 乳腺癌数据集
First we load the dataset
from sklearn.datasets import load_breast_cancer
cancer=load_breast_cancer()
x=cancer.data
y=cancer.target
Split training set and test set
from sklearn.model_selection import train_test_split
x_train,x_test,y_train,y_test=train_test_split(x,y,test_size=0.2)
Next, we use the models corresponding to different kernel functions to fit the data
高斯核函数
We first try to train the model with a Gaussian kernel,The training set score and the test set score are obtained respectively
from sklearn.svm import SVC
clf=SVC(C=1.0,kernel='rbf',gamma=0.1)
clf.fit(x_train,y_train)
train_score=clf.score(x_train,y_train)
test_score=clf.score(x_test,y_test)
train_score,test_score
>>> (0.98778345781,0.52631578949)
通过观察实验结果,We found that the training set was close to a perfect score,The test set score is very low,Typical overfitting phenomenon!Since we are using a Gaussian kernel function,So we can try to changegammaparameter values to tune the performance of the model
from sklearn.model_selection import GridSearchCV
gammas=np.linspace(0,0.0003,30)
grid={
    'gamma':gammas}
clf=GridSearchCV(SVC(),grid,cv=5)
clf.fit(x,y)
clf.best_params_,clf.best_score_
>>> ({
    'gamma': 0.00011379310344827585}, 0.9367334264865704)
此处注意GridSearchCV()Functions are often used for parameter selection
在最好的gamma参数下,The average optimal score is also only0.93…,It shows that the kernel function is not the most suitable for this problem.
But we can also observe the fit of the model through the learning curve,取gamma=0.01
import matplotlib.pyplot as plt
from sklearn.model_selection import learning_curve
from sklearn.model_selection import ShuffleSplit
cv=ShuffleSplit(n_splits=10,test_size=0.2,random_state=0)
title='gaussian kernel'
plt.figure(figsize=(10,4),dpi=144)
plot_learning_curve(SVC(C=1.0,gamma=0.01),title,x,y,cv=cv)
运行结果
Please refer to the package of learning curvesklearn官方api:plot_learning_curve()函数,
You can also refer to my blog:Encapsulation of the learning curve–learning_curve()函数
Cross validation score is too low,Obvious overfitting phenomenon,Next we try to change the kernel function
多项式核函数
from sklearn.svm import SVC
clf=SVC(C=1.0,kernel='poly',degree=2)
clf.fit(x_train,y_train)
train_score=clf.score(x_train,y_train)
test_score=clf.score(x_test,y_test)
train_score,test_score
>>> (0.9186813186813186, 0.9122807017543859)
Both the training set and the test set have relatively high scores,It looks like the result is ok,Next we draw the first-order polynomials separately、二阶多项式学习曲线
from sklearn.model_selection import learning_curve
cv=ShuffleSplit(n_splits=5,test_size=0.2,random_state=0)
degrees=[1,2]
plt.figure(figsize=(12,4),dpi=144)
for i in range(len(degrees)):
	plt.subplot(1,len(degrees),i+1)
	title='degree_{}'.format(degrees[i])
	plot_learning_curve(SVC(C=1.0,kernel='poly',degree=degrees[i]),title,x,y,cv=cv)
我们可以看出,Compared to first-order polynomials,The fitting effect of the second-order polynomial kernel function is better,But still not the most ideal situation

实际上,From the model fitting results and computational efficiency, etc,Support vector machine models may not be optimal for the problem of breast cancer detection,Other models may be able to achieve more desirable results when addressing this problem,Because when dealing with practical problems,The choice of upfront model is very important
边栏推荐
猜你喜欢


随机推荐
树链剖分-
esp32经典蓝牙和单片机连接,,,手机蓝牙作为主机
mockjs生成假数据的基本使用
Chopper webshell feature analysis
NAS和私有云盘的区别?1篇文章说清楚
Docker-compose安装mysql
永磁同步电机36问(二)——机械量与电物理量如何转化?
指针数组和数组指针
20. 用两个栈实现队列
analog IC layout-Parasitic effects
C#测试项目中属性的用法
qt点云配准软件
The principle and code implementation of intelligent follower robot in the actual combat of innovative projects
NIO‘s Sword(牛客多校赛)
列表常用方法
53. 最小的k个数
(一)Redis: 基于 Key-Value 的存储系统
mysql 查看死锁
线程的不同状态
BioVendor Human Club Cellular Protein (CC16) Elisa Kit Research Fields